EXHIBIT 99.1
Published on March 25, 2025
Exhibit 99.1
|
Investor Presentation Annual report 2024 1 January – 31 December 2024 |
|
2 Disclaimer THIS PRESENTATION (THIS "PRESENTATION") HAS BEEN PREPARED BY CADELER A/S (THE "COMPANY") EXCLUSIVELY FOR INFORMATION PURPOSES AND MAY NOT BE REPRODUCED OR REDISTRIBUTED, IN WHOLE OR IN PART, BY ANY OTHER PERSON. FORWARD-LOOKING STATEMENTS THIS PRESENTATION CONTAINS CERTAIN FORWARD-LOOKING STATEMENTS WITHIN THE MEANING OF SECTION 27A OF THE U.S. SECURITIES ACT OF 1933 AND SECTION 21E OF THE U.S. EXCHANGE ACT OF 1934, EACH AS AMENDED. ALL STATEMENTS OTHER THAN STATEMENTS OF HISTORICAL FACT INCLUDED IN THIS PRESENTATION ARE FORWARD LOOKING STATEMENTS, INCLUDING THOSE REGARDING FUTURE GUIDANCE, SUCH AS THOSE RELATED TO ANTICIPATED REVENUE AND EBITDA. FORWARD LOOKING STATEMENTS INVOLVE RISKS, UNCERTAINTIES AND ASSUMPTIONS, AND ACTUAL RESULTS MAY DIFFER MATERIALLY FROM ANY FUTURE RESULTS EXPRESSED OR IMPLIED BY SUCH FORWARD LOOKING STATEMENTS. WORDS SUCH AS "ANTICIPATE," "BELIEVE ," "CONTINUE," "COULD,“ "ESTIMATE," "EXPECT," "INTEND," "MAY," "MIGHT,“ “FORECAST”, “ON TRACK,” "PLAN," “POSSIBLE,” “POTENTIAL,” “PREDICT,” "PROJECT," "SHOULD," "WOULD," "SHALL," “TARGET,” "WILL" AND SIMILAR EXPRESSIONS ARE INTENDED TO ASSIST IN IDENTIFYING FORWARD LOOKING STATEMENTS. ALTHOUGH THE COMPANY BELIEVES THAT THE EXPECTATIONS REFLECTED IN SUCH FORWARD-LOOKING STATEMENTS ARE REASONABLE, THERE CAN BE NO ASSURANCE THAT SUCH EXPECTATIONS WILL PROVE TO BE CORRECT. ALL FORWARD-LOOKING STATEMENTS INCLUDED IN THIS PRESENTATION SPEAK ONLY AS OF THE DATE OF THIS PRESENTATION AND THE COMPANY UNDERTAKES NO OBLIGATION TO REVISE OR UPDATE ANY FORWARD-LOOKING STATEMENT FOR ANY REASON, EXCEPT AS REQUIRED BY LAW. RISKS AND UNCERTAINTIES INCLUDE, BUT ARE NOT LIMITED TO, THOSE DETAILED IN THE COMPANY’S MOST RECENT ANNUAL REPORT ON FORM 20-F AND IN ITS OTHER FILINGS WITH THE U.S. SECURITIES AND EXCHANGE COMMISSION. YOU SHOULD CONSIDER THESE RISKS AND UNCERTAINTIES WHEN EVALUATING THE COMPANY AND ITS PROSPECTS. NONE OF THE COMPANY OR ANY OF ITS PARENT OR SUBSIDIARY UNDERTAKINGS OR ANY OF SUCH PERSONS’ DIRECTORS, OFFICERS OR EMPLOYEES PROVIDES ANY ASSURANCE THAT THE ASSUMPTIONS REFLECTED IN THE FORWARD-LOOKING STATEMENTS INCLUDED IN THIS PRESENTATION ARE FREE FROM ERROR NOR DOES ANY OF THEM ACCEPT ANY RESPONSIBILITY FOR THE FUTURE ACCURACY OF THE OPINIONS EXPRESSED IN THIS PRESENTATION OR FOR THE ACTUAL OCCURRENCE (OR NON-OCCURRENCE) OF THE FORECASTED DEVELOPMENTS. NON-IFRS PERFORMANCE MEASURES THIS PRESENTATION INCLUDES CERTAIN NON-IFRS PERFORMANCE MEASURES, INCLUDING EBITDA, ADJUSTED EBITDA, AND CONTRACT BACKLOG. SUCH NON-IFRS PERFORMANCE MEASURES ARE PRESENTED HEREIN AS THE COMPANY BELIEVES THAT SUCH MEASURES PROVIDE INVESTORS WITH ADDITIONAL USEFUL INFORMATION AND A MEANS OF UNDERSTANDING HOW THE COMPANY’S MANAGEMENT EVALUATES THE COMPANY’S OPERATING PERFORMANCE. SUCH PERFORMANCE MEASURES SHOULD NOT, HOWEVER, BE CONSIDERED IN ISOLATION FROM, AS SUBSTITUTES FOR, OR AS SUPERIOR TO FINANCIAL MEASURES PREPARED IN ACCORDANCE WITH IFRS. MOREOVER, OTHER COMPANIES MAY DEFINE NON-IFRS MEASURES DIFFERENTLY, WHICH LIMITS THE USEFULNESS OF THESE MEASURES FOR THE PURPOSE OF ANY COMPARISON WITH SUCH OTHER COMPANIES. INDUSTRY AND MARKET DATA INFORMATION CONTAINED IN THIS PRESENTATION CONCERNING THE COMPANY’S INDUSTRY AND THE MARKET IN WHICH IT OPERATES, INCLUDING GENERAL EXPECTATIONS ABOUT ITS INDUSTRY, MARKET POSITION, MARKET OPPORTUNITY AND MARKET SIZE, IS BASED ON DATA FROM VARIOUS SOURCES INCLUDING INTERNAL DATA AND ESTIMATES AS WELL AS THIRD PARTY SOURCES SUCH AS INDEPENDENT INDUSTRY PUBLICATIONS, GOVERNMENT PUBLICATIONS, AND REPORTS BY MARKET RESEARCH FIRMS OR OTHER PUBLISHED INDEPENDENT SOURCES. YOU ARE CAUTIONED NOT TO GIVE UNDUE WEIGHT TO SUCH INFORMATION. YOU ARE FURTHER ADVISED THAT ANY THIRD-PARTY INFORMATION REFERRED TO IN THIS PRESENTATION HAS NOT BEEN PREPARED SPECIFICALLY FOR INCLUSION IN THIS PRESENTATION AND WHILE THE COMPANY BELIEVES SUCH INFORMATION TO BE GENERALLY RELIABLE, IT HAS NOT UNDERTAKEN ANY INDEPENDENT INVESTIGATION TO CONFIRM THE ACCURACY OR COMPLETENESS OF SUCH INFORMATION OR TO VERIFY THAT MORE RECENT INFORMATION IS NOT AVAILABLE. |
|
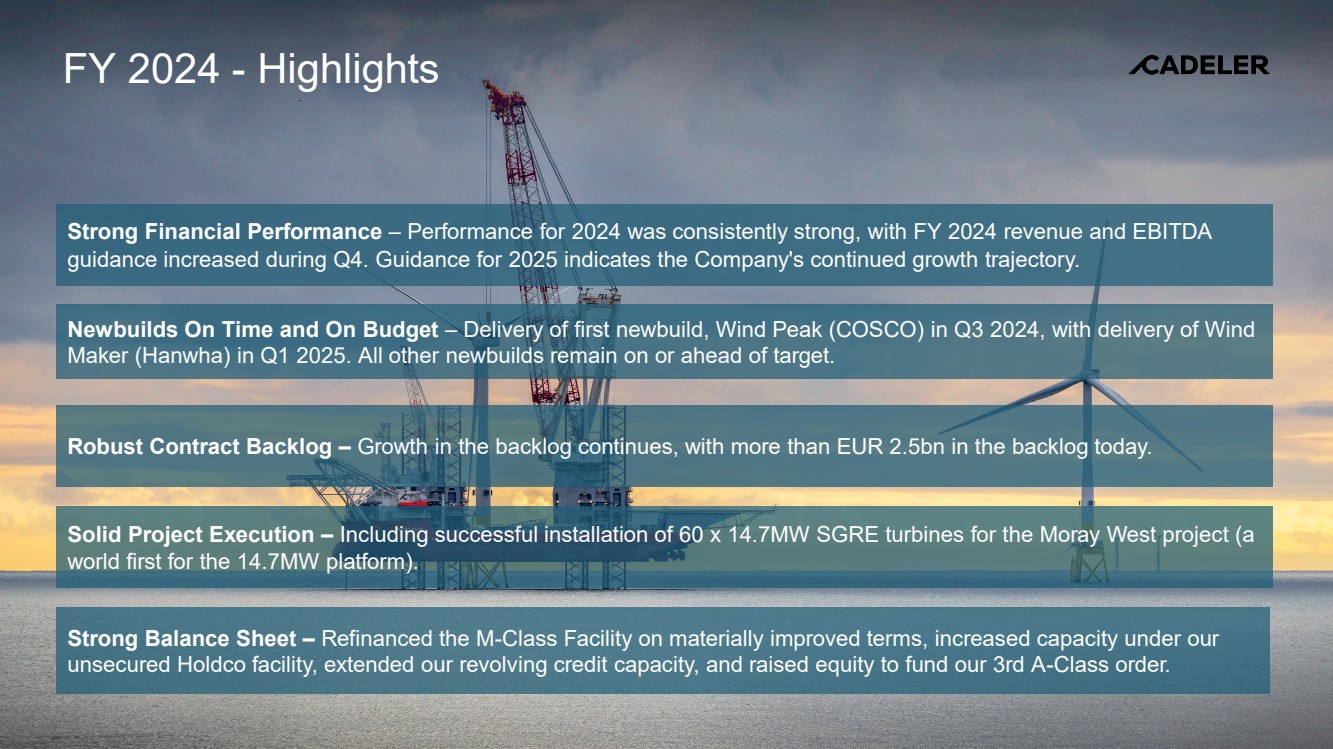
FY 2024 - Highlights Strong Financial Performance – Performance for 2024 was consistently strong, with FY 2024 revenue and EBITDA guidance increased during Q4. Guidance for 2025 indicates the Company's continued growth trajectory. Newbuilds On Time and On Budget – Delivery of first newbuild, Wind Peak (COSCO) in Q3 2024, with delivery of Wind Maker (Hanwha) in Q1 2025. All other newbuilds remain on or ahead of target. Robust Contract Backlog – Growth in the backlog continues, with more than EUR 2.5bn in the backlog today. Solid Project Execution – Including successful installation of 60 x 14.7MW SGRE turbines for the Moray West project (a world first for the 14.7MW platform). Strong Balance Sheet – Refinanced the M-Class Facility on materially improved terms, increased capacity under our unsecured Holdco facility, extended our revolving credit capacity, and raised equity to fund our 3rd A-Class order. |
|
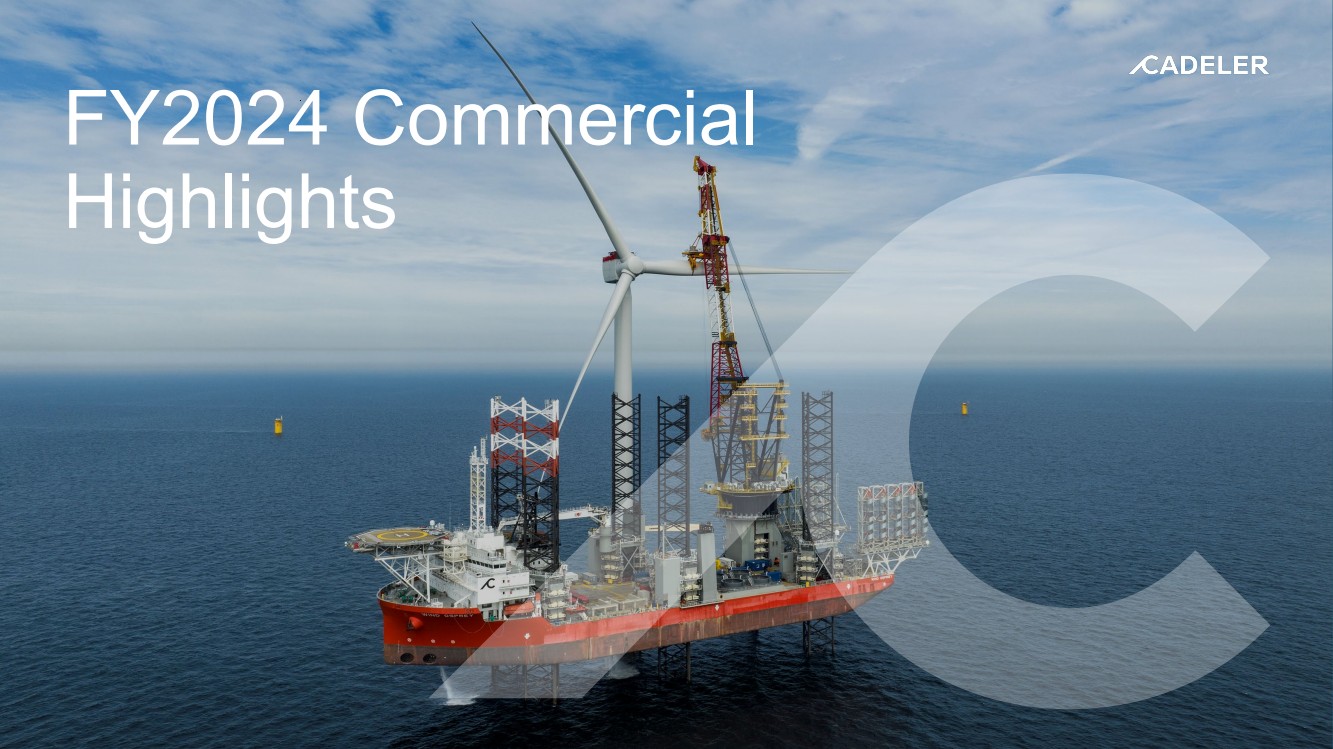
FY2024 Commercial Highlights |
|
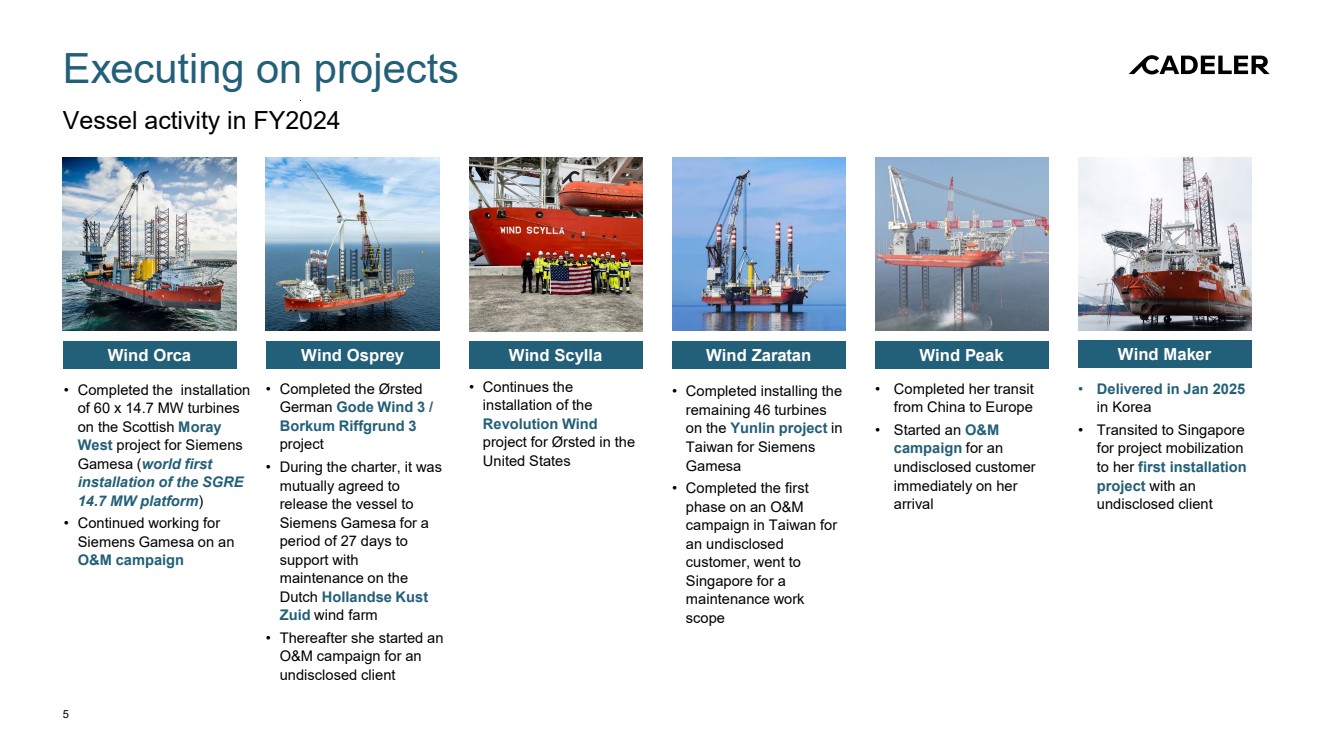
Executing on projects Vessel activity in FY2024 5 Wind Orca Wind Osprey Wind Scylla Wind Zaratan Wind Peak • Completed the installation of 60 x 14.7 MW turbines on the Scottish Moray West project for Siemens Gamesa (world first installation of the SGRE 14.7 MW platform) • Continued working for Siemens Gamesa on an O&M campaign • Completed the Ørsted German Gode Wind 3 / Borkum Riffgrund 3 project • During the charter, it was mutually agreed to release the vessel to Siemens Gamesa for a period of 27 days to support with maintenance on the Dutch Hollandse Kust Zuid wind farm • Thereafter she started an O&M campaign for an undisclosed client • Continues the installation of the Revolution Wind project for Ørsted in the United States • Completed installing the remaining 46 turbines on the Yunlin project in Taiwan for Siemens Gamesa • Completed the first phase on an O&M campaign in Taiwan for an undisclosed customer, went to Singapore for a maintenance work scope • Completed her transit from China to Europe • Started an O&M campaign for an undisclosed customer immediately on her arrival Wind Maker • Delivered in Jan 2025 in Korea • Transited to Singapore for project mobilization to her first installation project with an undisclosed client |
|
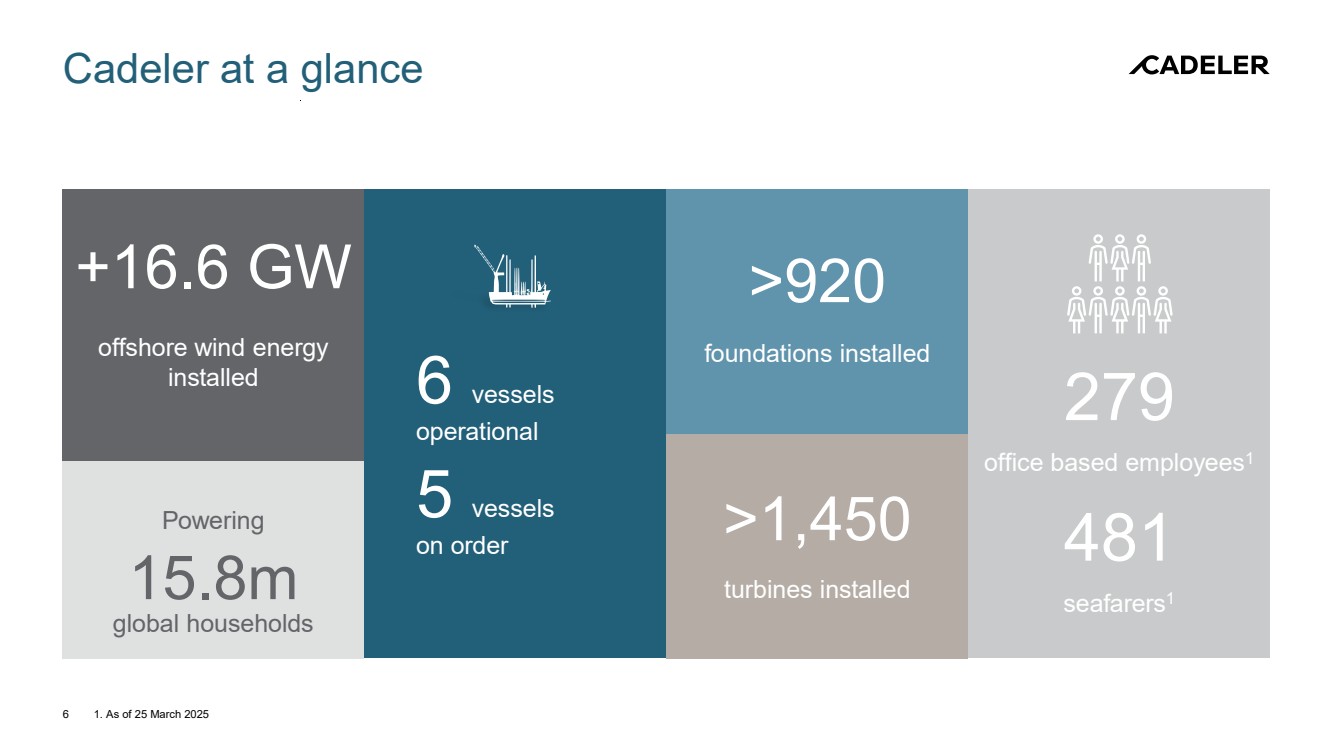
Cadeler at a glance 6 1. As of 25 March 2025 turbines installed >1,450 +16.6 GW offshore wind energy installed >920 foundations installed office based employees1 6 vessels 279 operational 5 vessels on order global households 15.8m Powering seafarers1 481 |
|
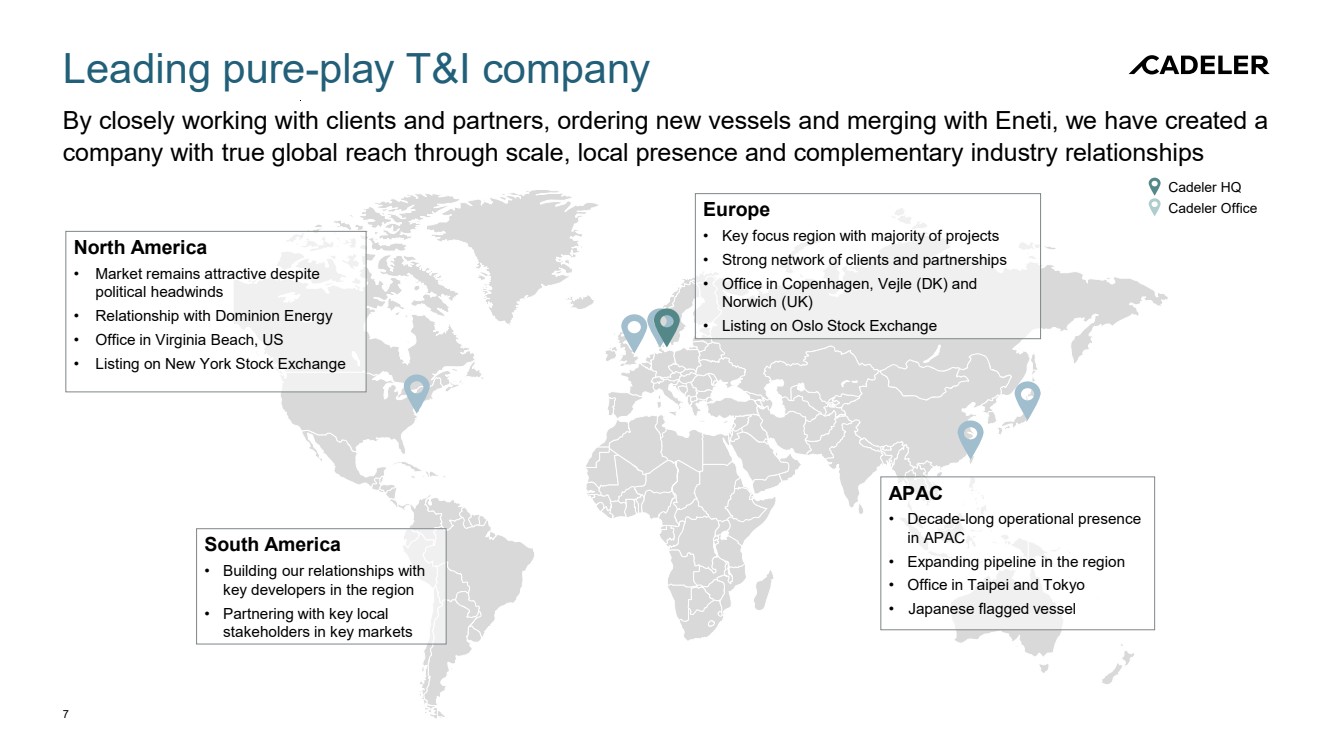
Leading pure-play T&I company By closely working with clients and partners, ordering new vessels and merging with Eneti, we have created a company with true global reach through scale, local presence and complementary industry relationships 7 North America • Market remains attractive despite political headwinds • Relationship with Dominion Energy • Office in Virginia Beach, US • Listing on New York Stock Exchange Europe • Key focus region with majority of projects • Strong network of clients and partnerships • Office in Copenhagen, Vejle (DK) and Norwich (UK) • Listing on Oslo Stock Exchange South America • Building our relationships with key developers in the region • Partnering with key local stakeholders in key markets APAC • Decade-long operational presence in APAC • Expanding pipeline in the region • Office in Taipei and Tokyo • Japanese flagged vessel Cadeler HQ Cadeler Office |
|
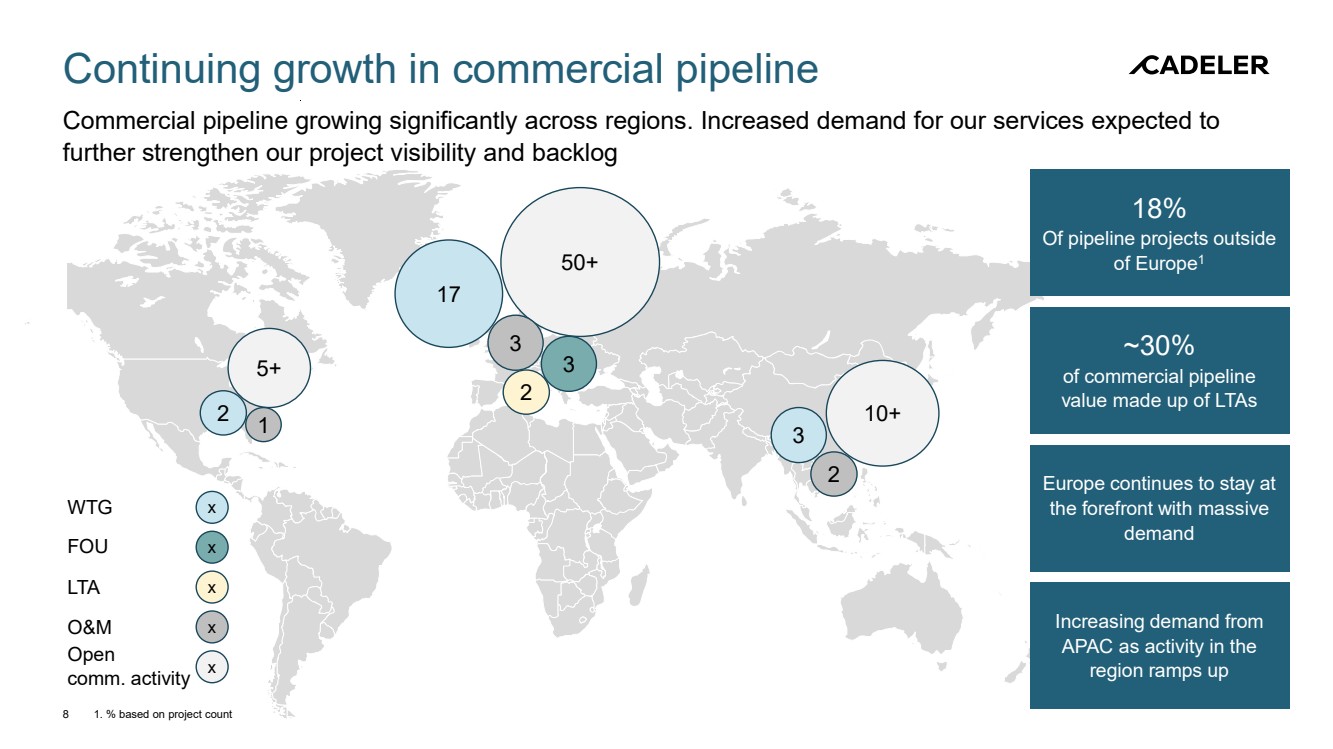
Continuing growth in commercial pipeline Commercial pipeline growing significantly across regions. Increased demand for our services expected to further strengthen our project visibility and backlog 8 1. % based on project count ~30% of commercial pipeline value made up of LTAs Europe continues to stay at the forefront with massive demand 17 3 50+ 2 3 2 10+ 5+ 1 3 2 x x x x WTG x FOU LTA O&M Open comm. activity 18% Of pipeline projects outside of Europe1 Increasing demand from APAC as activity in the region ramps up |
|
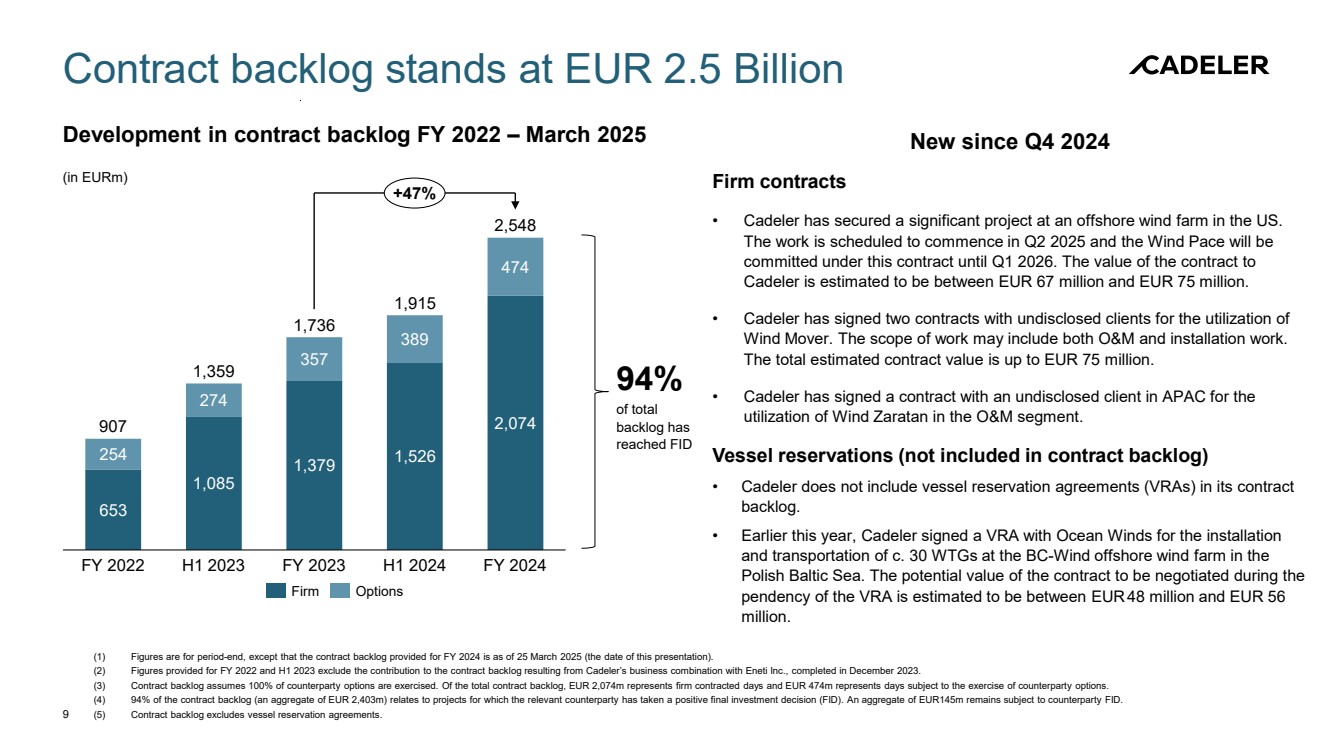
Contract backlog stands at EUR 2.5 Billion 9 New since Q4 2024 Firm contracts • Cadeler has secured a significant project at an offshore wind farm in the US. The work is scheduled to commence in Q2 2025 and the Wind Pace will be committed under this contract until Q1 2026. The value of the contract to Cadeler is estimated to be between EUR 67 million and EUR 75 million. • Cadeler has signed two contracts with undisclosed clients for the utilization of Wind Mover. The scope of work may include both O&M and installation work. The total estimated contract value is up to EUR 75 million. • Cadeler has signed a contract with an undisclosed client in APAC for the utilization of Wind Zaratan in the O&M segment. Vessel reservations (not included in contract backlog) • Cadeler does not include vessel reservation agreements (VRAs) in its contract backlog. • Earlier this year, Cadeler signed a VRA with Ocean Winds for the installation and transportation of c. 30 WTGs at the BC-Wind offshore wind farm in the Polish Baltic Sea. The potential value of the contract to be negotiated during the pendency of the VRA is estimated to be between EUR48 million and EUR 56 million. Development in contract backlog FY 2022 – March 2025 (1) Figures are for period-end, except that the contract backlog provided for FY 2024 is as of 25 March 2025 (the date of this presentation). (2) Figures provided for FY 2022 and H1 2023 exclude the contribution to the contract backlog resulting from Cadeler’s business combination with Eneti Inc., completed in December 2023. (3) Contract backlog assumes 100% of counterparty options are exercised. Of the total contract backlog, EUR 2,074m represents firm contracted days and EUR 474m represents days subject to the exercise of counterparty options. (4) 94% of the contract backlog (an aggregate of EUR 2,403m) relates to projects for which the relevant counterparty has taken a positive final investment decision (FID). An aggregate of EUR145m remains subject to counterparty FID. (5) Contract backlog excludes vessel reservation agreements. (in EURm) 653 254 274 357 389 474 FY 2022 H1 2023 FY 2023 H1 2024 FY 2024 907 1,359 1,736 1,915 2,548 1,085 1,379 1,526 2,074 +47% Firm Options 94% of total backlog has reached FID |
|
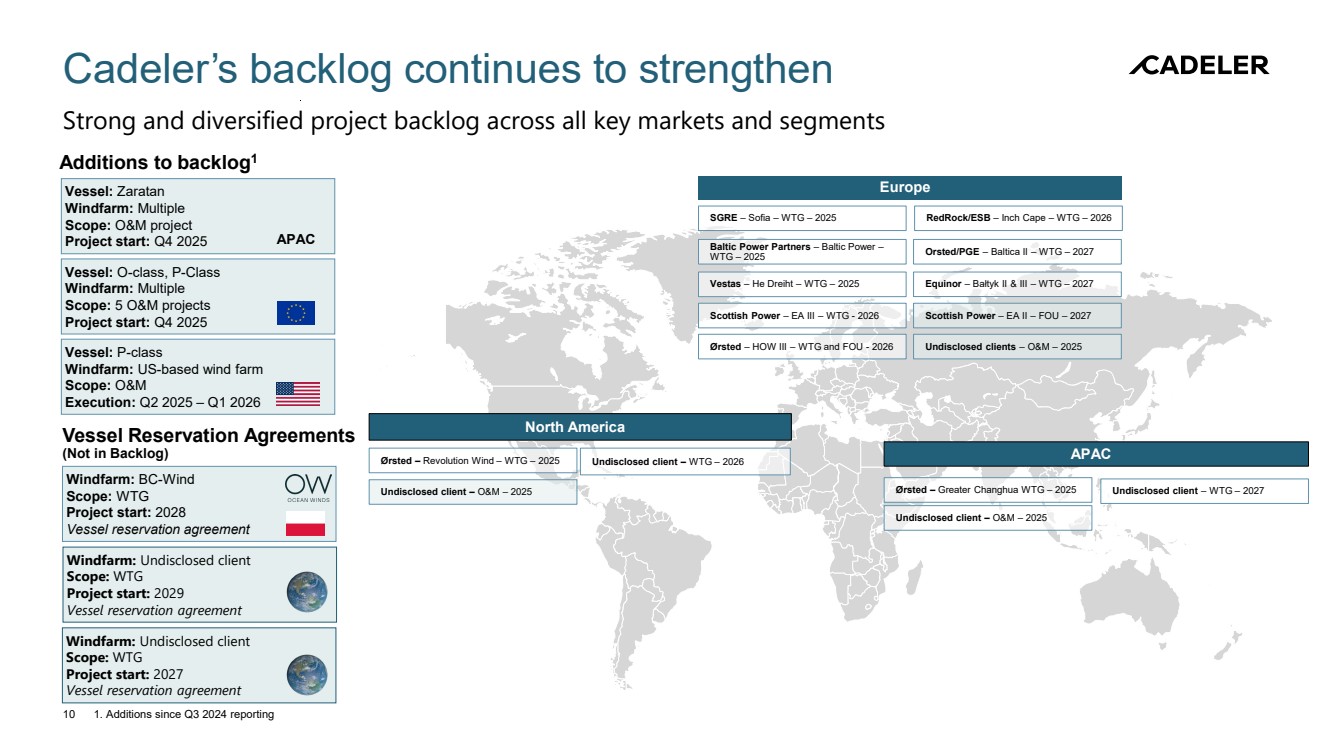
Cadeler’s backlog continues to strengthen Strong and diversified project backlog across all key markets and segments 10 1. Additions since Q3 2024 reporting Additions to backlog1 Vessel Reservation Agreements (Not in Backlog) Windfarm: BC-Wind Scope: WTG Project start: 2028 Vessel reservation agreement Europe APAC Undisclosed client – WTG – 2027 North America Ørsted – Revolution Wind – WTG – 2025 Vestas – He Dreiht – WTG – 2025 Baltic Power Partners – Baltic Power – WTG – 2025 SGRE – Sofia – WTG – 2025 Scottish Power – EA III – WTG - 2026 Ørsted – HOW III – WTG and FOU - 2026 Orsted/PGE – Baltica II – WTG – 2027 RedRock/ESB – Inch Cape – WTG – 2026 Scottish Power – EA II – FOU – 2027 Equinor – Bałtyk II & III – WTG – 2027 Vessel: P-class Windfarm: US-based wind farm Scope: O&M Execution: Q2 2025 – Q1 2026 Undisclosed client – O&M – 2025 Ørsted – Greater Changhua WTG – 2025 Undisclosed client – WTG – 2026 Vessel: O-class, P-Class Windfarm: Multiple Scope: 5 O&M projects Project start: Q4 2025 Undisclosed clients – O&M – 2025 Vessel: Zaratan Windfarm: Multiple Scope: O&M project Project start: Q4 2025 APAC Windfarm: Undisclosed client Scope: WTG Project start: 2027 Vessel reservation agreement Windfarm: Undisclosed client Scope: WTG Project start: 2029 Vessel reservation agreement Undisclosed client – O&M – 2025 |
|
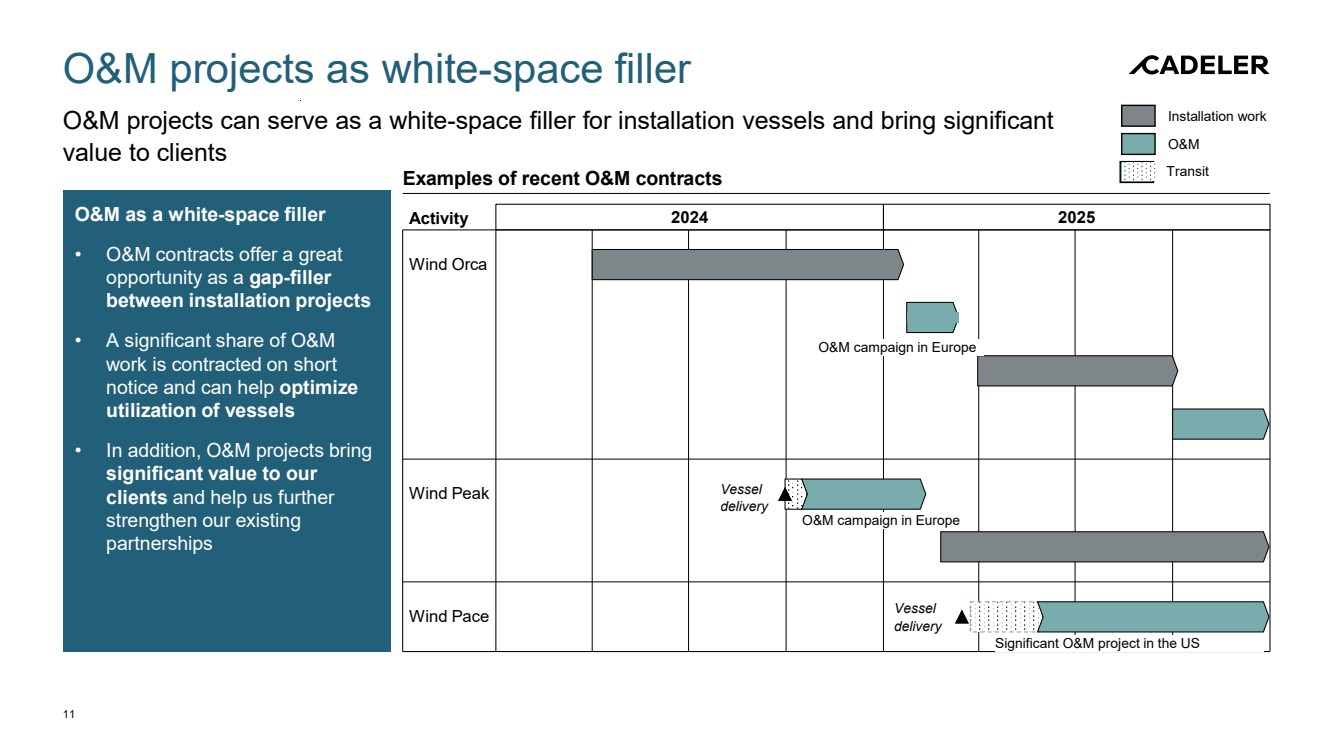
O&M projects as white-space filler O&M projects can serve as a white-space filler for installation vessels and bring significant value to clients 11 O&M as a white-space filler • O&M contracts offer a great opportunity as a gap-filler between installation projects • A significant share of O&M work is contracted on short notice and can help optimize utilization of vessels • In addition, O&M projects bring significant value to our clients and help us further strengthen our existing partnerships Examples of recent O&M contracts 2024 2025 Wind Orca Wind Peak Wind Pace Activity Significant O&M project in the US O&M campaign in Europe O&M campaign in Europe Installation work O&M Vessel delivery Vessel delivery Transit |
|
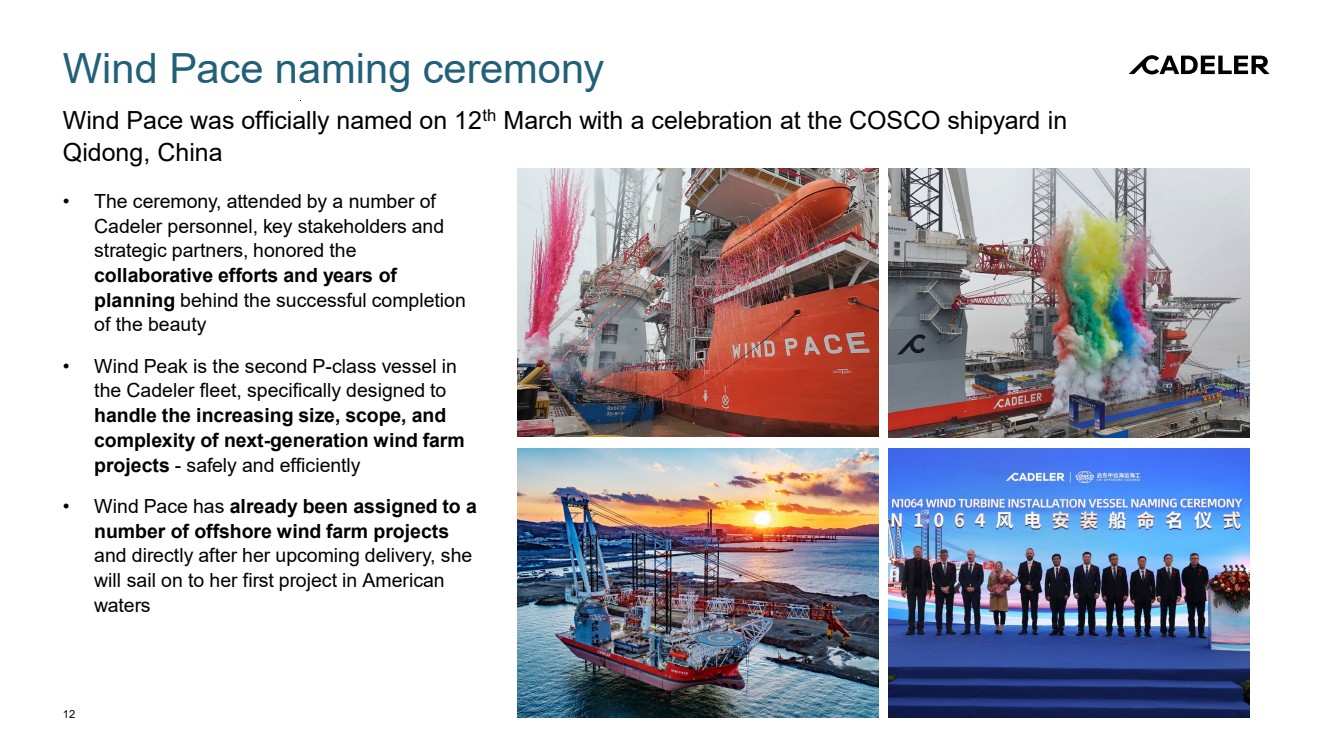
Wind Pace naming ceremony Wind Pace was officially named on 12th March with a celebration at the COSCO shipyard in Qidong, China 12 • The ceremony, attended by a number of Cadeler personnel, key stakeholders and strategic partners, honored the collaborative efforts and years of planning behind the successful completion of the beauty • Wind Peak is the second P-class vessel in the Cadeler fleet, specifically designed to handle the increasing size, scope, and complexity of next-generation wind farm projects - safely and efficiently • Wind Pace has already been assigned to a number of offshore wind farm projects and directly after her upcoming delivery, she will sail on to her first project in American waters |
|
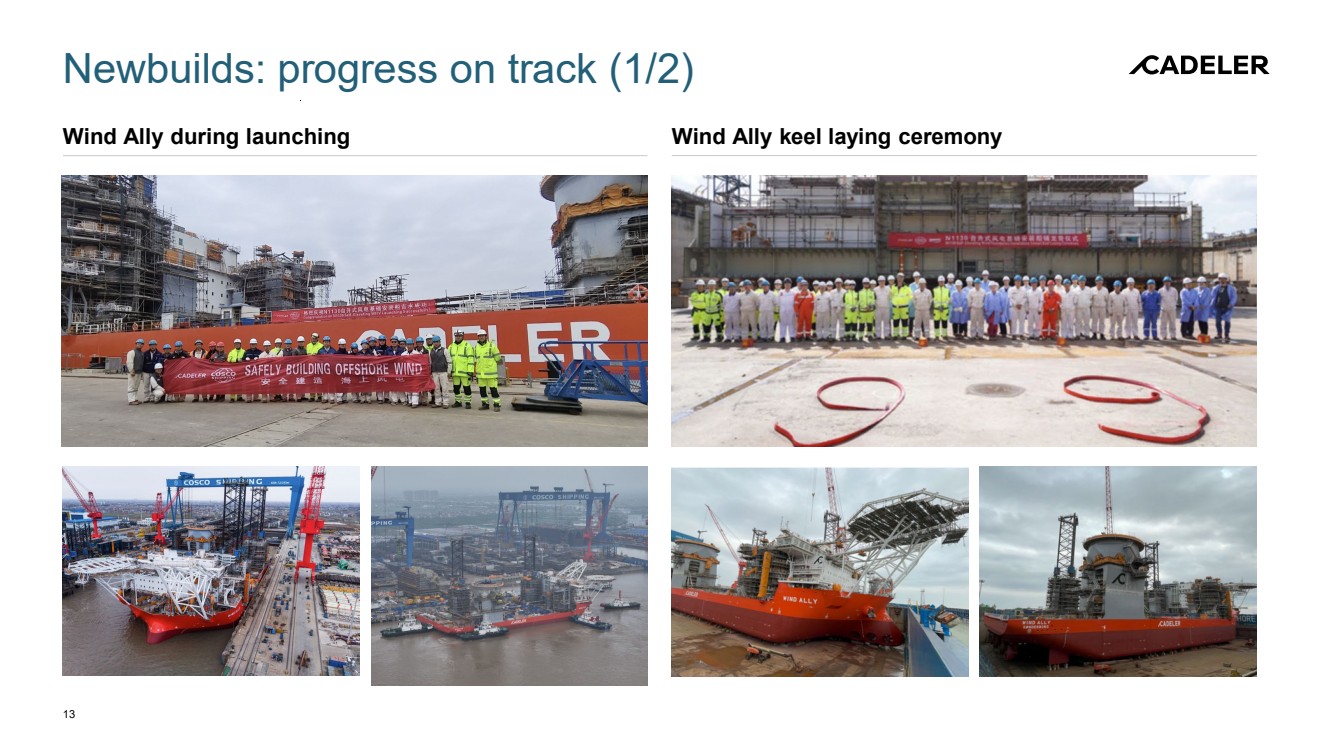
Newbuilds: progress on track (1/2) 13 Wind Ally during launching Wind Ally keel laying ceremony |
|
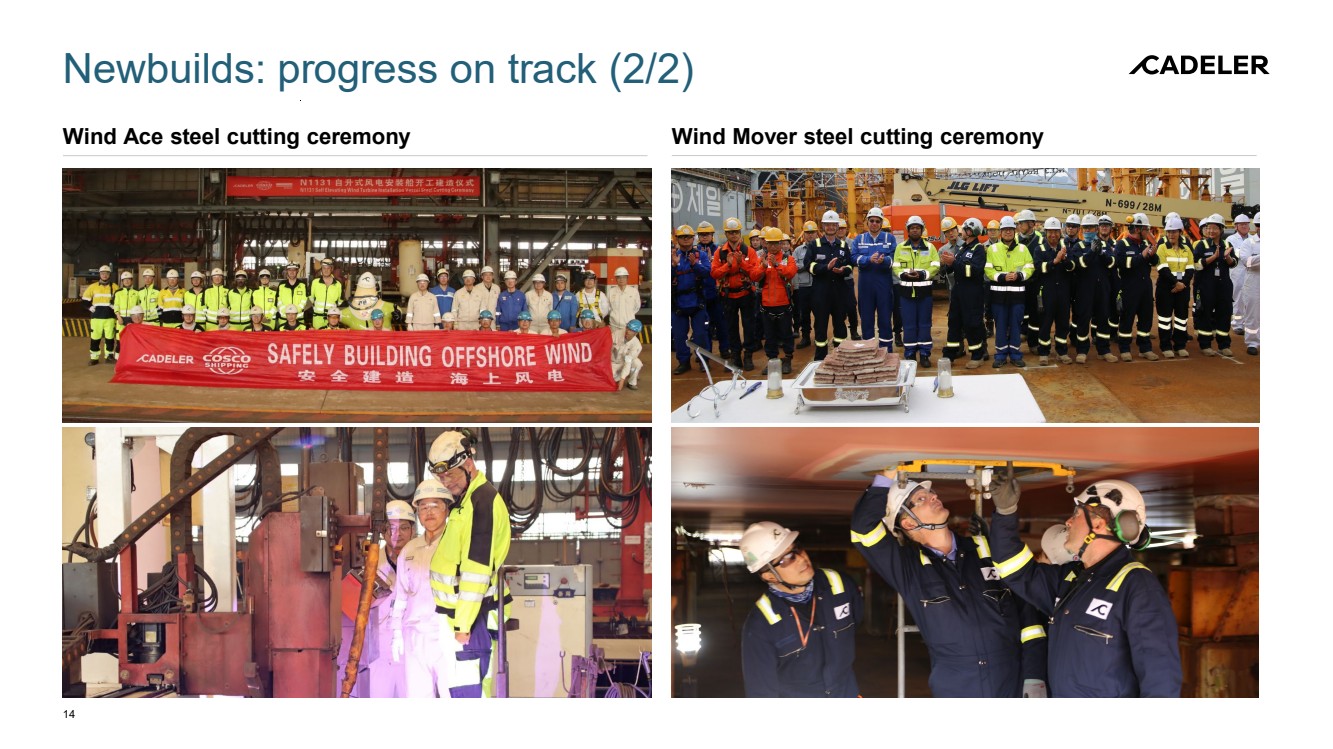
Newbuilds: progress on track (2/2) 14 Wind Ace steel cutting ceremony Wind Mover steel cutting ceremony |
|
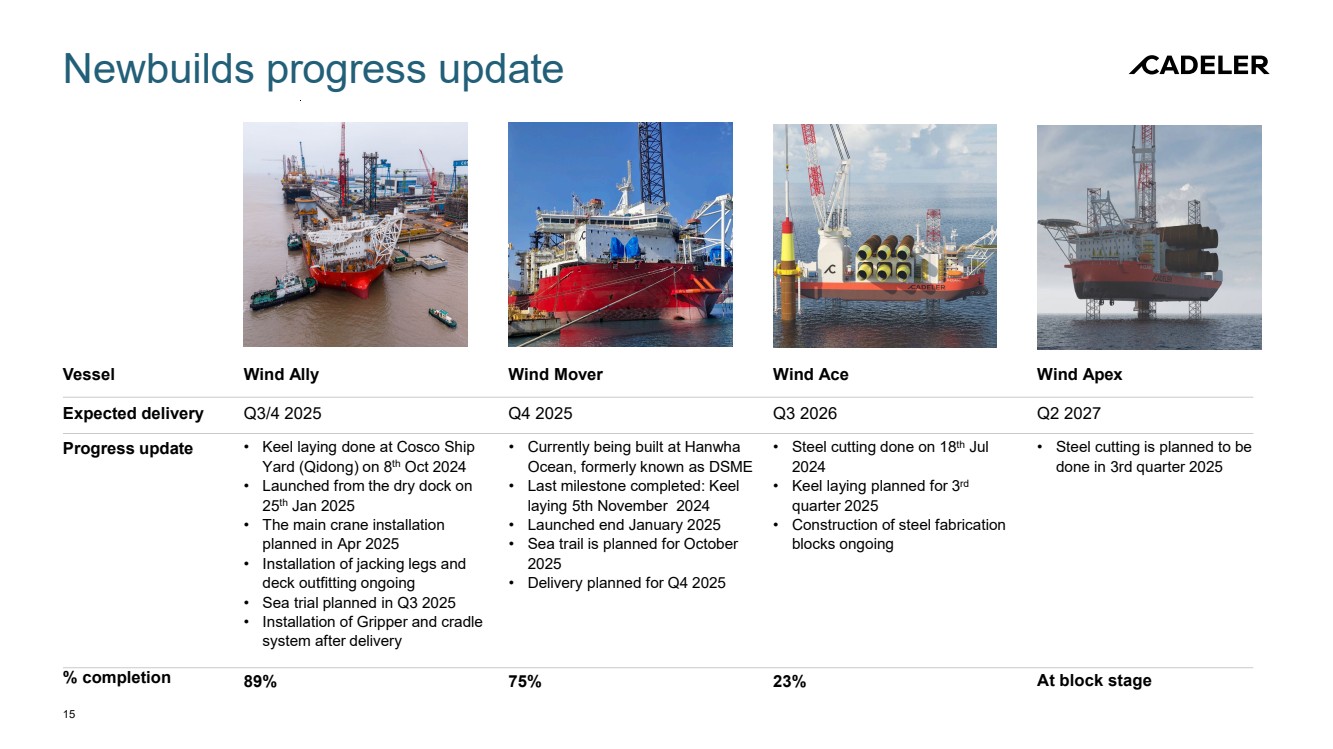
Newbuilds progress update 15 Vessel Wind Ally Progress update Expected delivery % completion Q3/4 2025 • Keel laying done at Cosco Ship Yard (Qidong) on 8th Oct 2024 • Launched from the dry dock on 25th Jan 2025 • The main crane installation planned in Apr 2025 • Installation of jacking legs and deck outfitting ongoing • Sea trial planned in Q3 2025 • Installation of Gripper and cradle system after delivery 89% • Steel cutting done on 18th Jul 2024 • Keel laying planned for 3rd quarter 2025 • Construction of steel fabrication blocks ongoing 23% Q3 2026 Wind Ace • Steel cutting is planned to be done in 3rd quarter 2025 Q2 2027 Wind Apex At block stage Wind Mover Q4 2025 • Currently being built at Hanwha Ocean, formerly known as DSME • Last milestone completed: Keel laying 5th November 2024 • Launched end January 2025 • Sea trail is planned for October 2025 • Delivery planned for Q4 2025 75% |
|
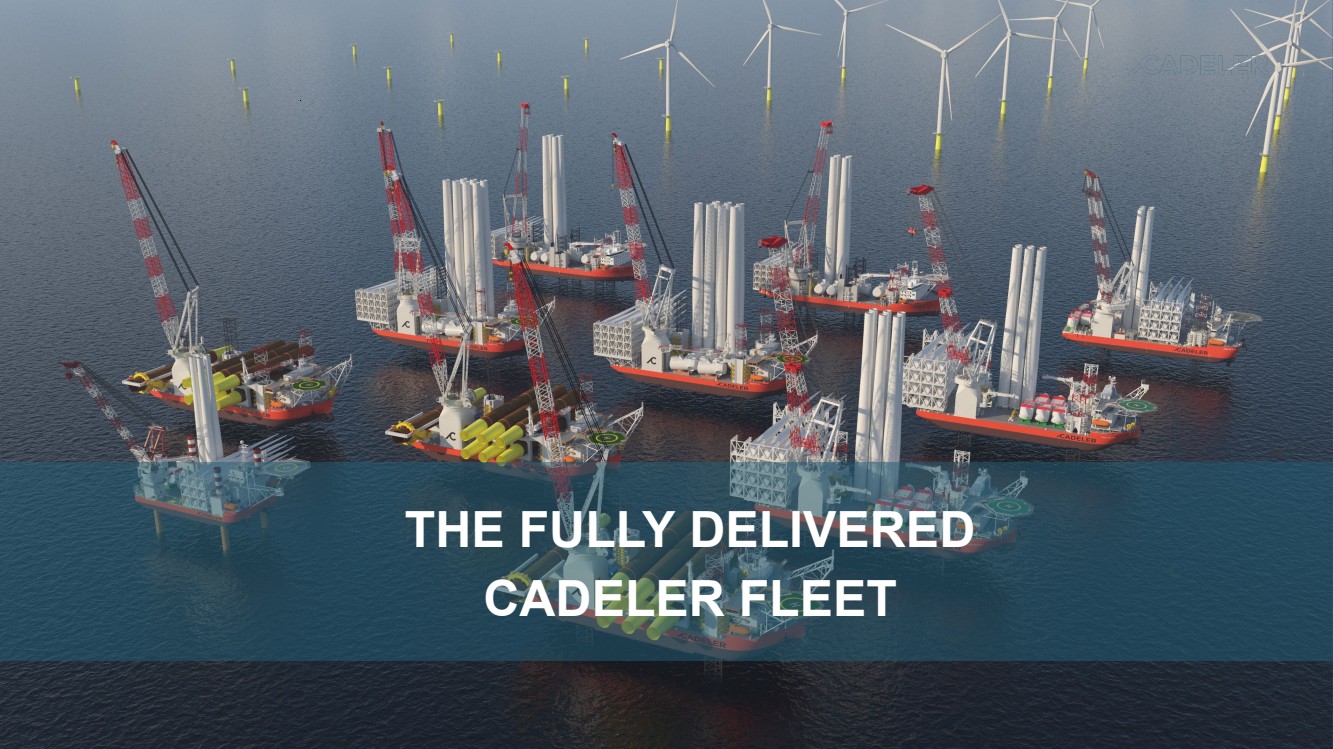
THE FULLY DELIVERED CADELER FLEET |
|
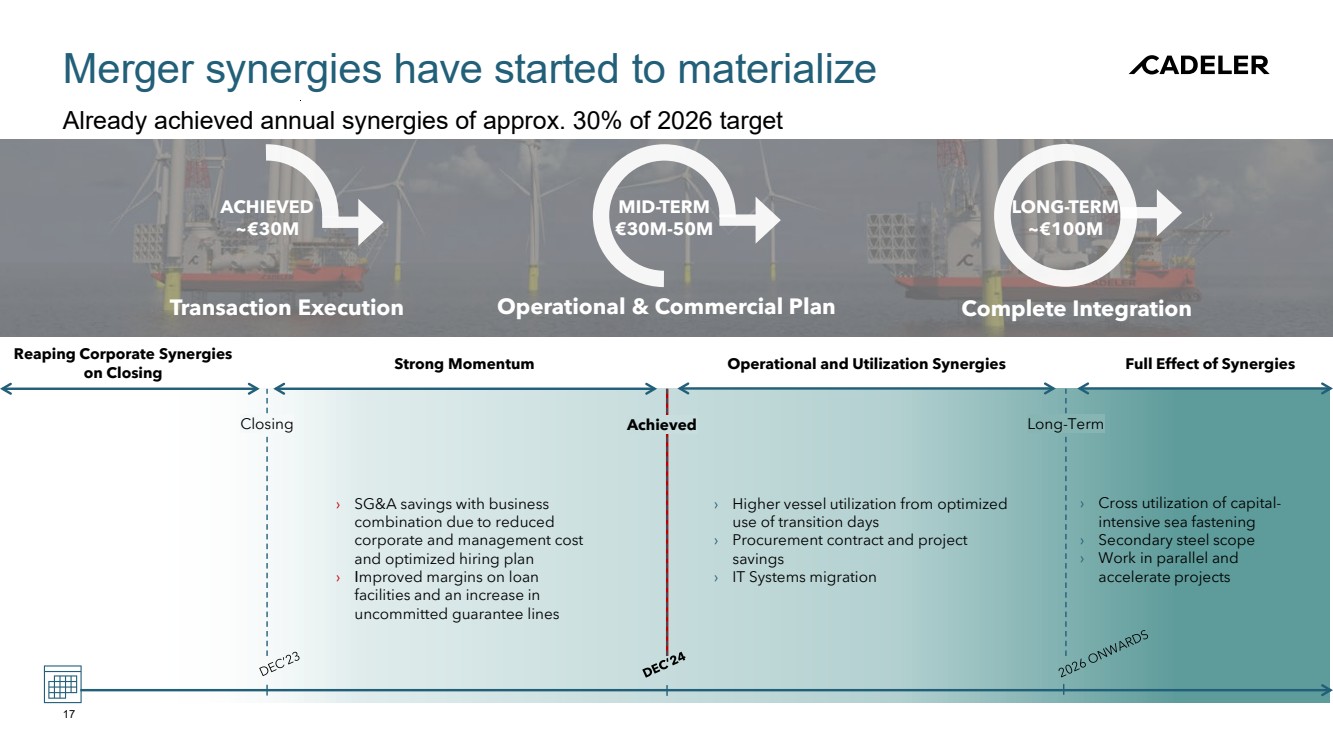
Merger synergies have started to materialize Already achieved annual synergies of approx. 30% of 2026 target 17 Transaction Execution ACHIEVED ~€30M Achieved Long-Term Reaping Corporate Synergies on Closing Full Effect of Synergies MID-TERM €30M-50M Operational & Commercial Plan LONG-TERM ~€100M Complete Integration Strong Momentum Operational and Utilization Synergies Closing › SG&A savings with business combination due to reduced corporate and management cost and optimized hiring plan › Improved margins on loan facilities and an increase in uncommitted guarantee lines › Higher vessel utilization from optimized use of transition days › Procurement contract and project savings › IT Systems migration › Cross utilization of capital-intensive sea fastening › Secondary steel scope › Work in parallel and accelerate projects |
|
Financial Results |
|
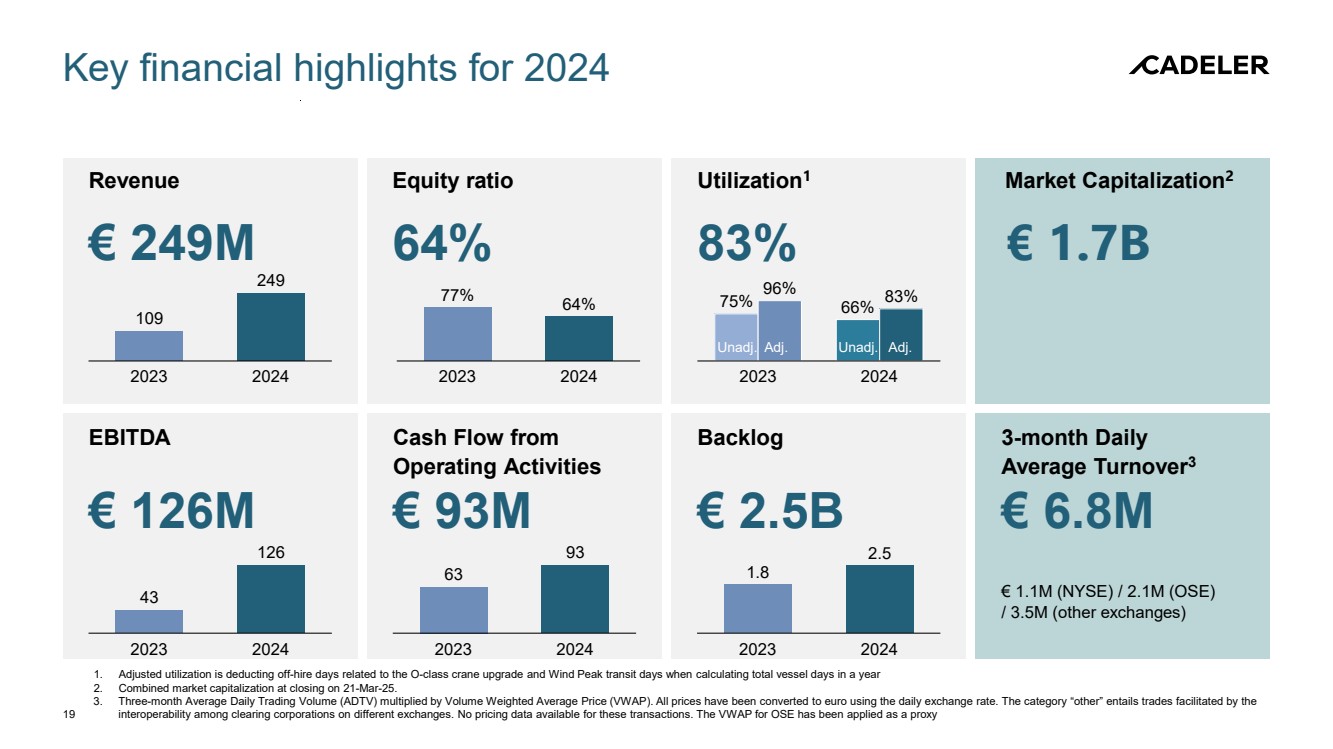
Key financial highlights for 2024 1. Adjusted utilization is deducting off-hire days related to the O-class crane upgrade and Wind Peak transit days when calculating total vessel days in a year 2. Combined market capitalization at closing on 21-Mar-25. Volume Weighted Average Price (VWAP). All prices have been converted to euro using the daily exchange rate. The category “other” entails trades facilitated by the interoperability among clearing corporations on different exchanges. No pricing data available for these transactions. The VWAP for OSE has been applied as a proxy 3. Three-month Average Daily Trading Volume (ADTV) multiplied by 19 Revenue € 249M 109 249 2023 2024 Equity ratio 64% 2023 2024 77% 64% Utilization1 83% Market Capitalization2 € 1.7B EBITDA € 126M 43 126 2023 2024 Cash Flow from Operating Activities € 93M 63 93 2023 2024 Backlog € 2.5B 2023 2024 1.8 2.5 3-month Daily Average Turnover3 € 6.8M € 1.1M (NYSE) / 2.1M (OSE) / 3.5M (other exchanges) 2023 2024 75% 96% 66% 83% Unadj. Adj. Unadj. Adj. |
|
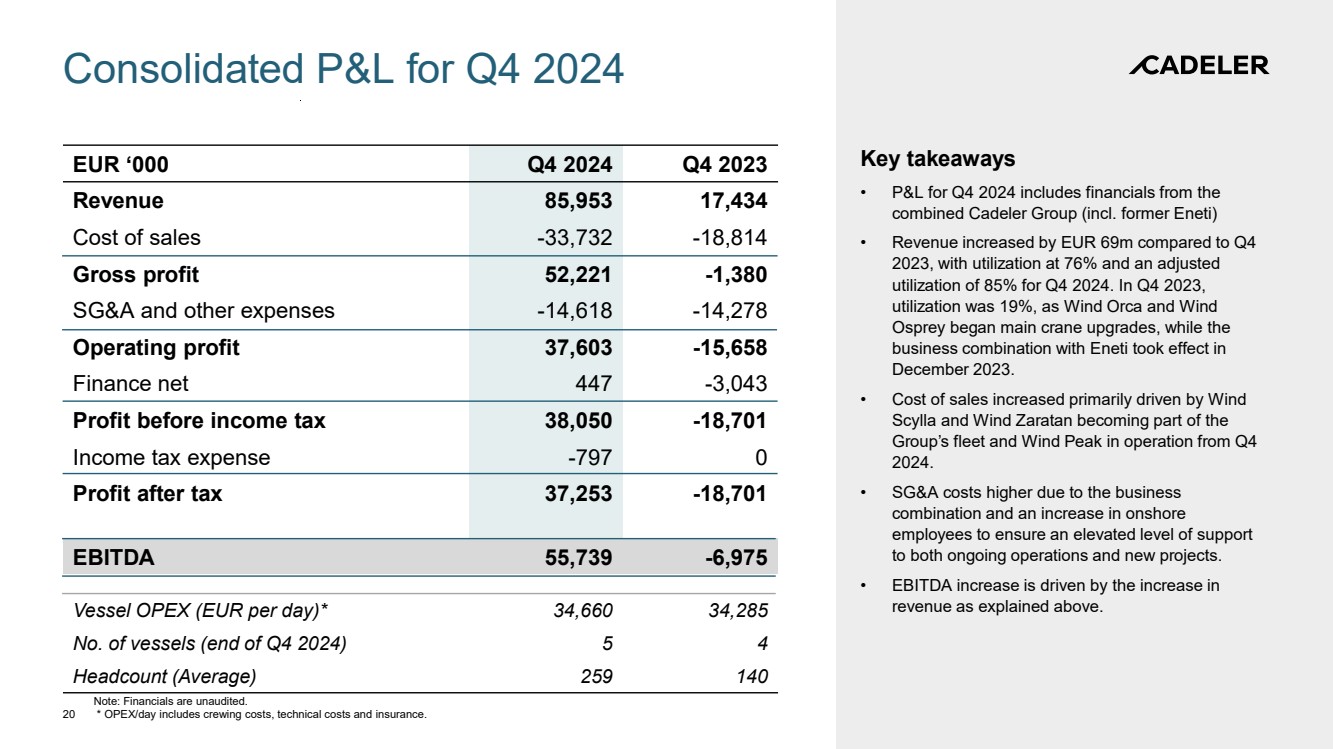
Consolidated P&L for Q4 2024 Key takeaways • P&L for Q4 2024 includes financials from the combined Cadeler Group (incl. former Eneti) • Revenue increased by EUR 69m compared to Q4 2023, with utilization at 76% and an adjusted utilization of 85% for Q4 2024. In Q4 2023, utilization was 19%, as Wind Orca and Wind Osprey began main crane upgrades, while the business combination with Eneti took effect in December 2023. • Cost of sales increased primarily driven by Wind Scylla and Wind Zaratan becoming part of the Group’s fleet and Wind Peak in operation from Q4 2024. • SG&A costs higher due to the business combination and an increase in onshore employees to ensure an elevated level of support to both ongoing operations and new projects. • EBITDA increase is driven by the increase in revenue as explained above. Note: Financials are unaudited. 20 * OPEX/day includes crewing costs, technical costs and insurance. EUR ‘000 Q4 2024 Q4 2023 Revenue 85,953 17,434 Cost of sales -33,732 -18,814 Gross profit 52,221 -1,380 SG&A and other expenses -14,618 -14,278 Operating profit 37,603 -15,658 Finance net 447 -3,043 Profit before income tax 38,050 -18,701 Income tax expense -797 0 Profit after tax 37,253 -18,701 EBITDA 55,739 -6,975 Vessel OPEX (EUR per day)* 34,660 34,285 No. of vessels (end of Q4 2024) 5 4 Headcount (Average) 259 140 |
|
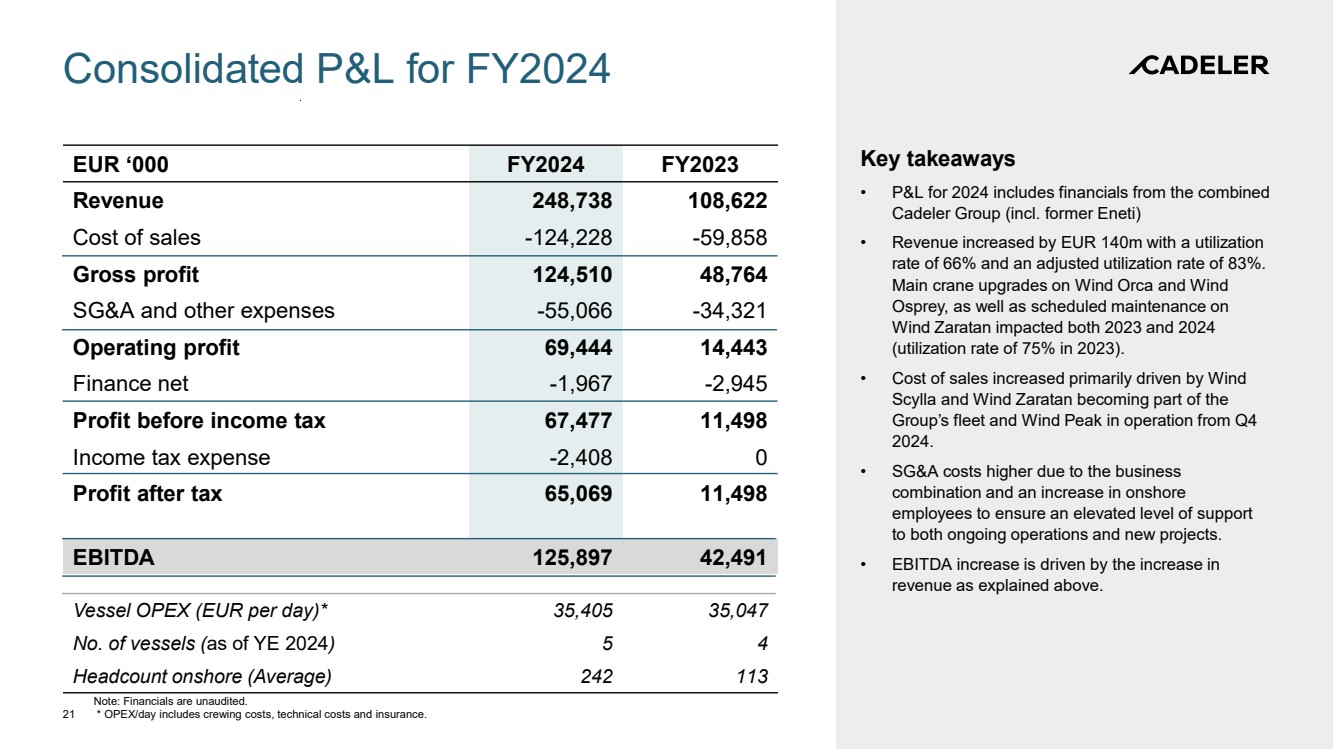
Consolidated P&L for FY2024 Key takeaways • P&L for 2024 includes financials from the combined Cadeler Group (incl. former Eneti) • Revenue increased by EUR 140m with a utilization rate of 66% and an adjusted utilization rate of 83%. Main crane upgrades on Wind Orca and Wind Osprey, as well as scheduled maintenance on Wind Zaratan impacted both 2023 and 2024 (utilization rate of 75% in 2023). • Cost of sales increased primarily driven by Wind Scylla and Wind Zaratan becoming part of the Group’s fleet and Wind Peak in operation from Q4 2024. • SG&A costs higher due to the business combination and an increase in onshore employees to ensure an elevated level of support to both ongoing operations and new projects. • EBITDA increase is driven by the increase in revenue as explained above. Note: Financials are unaudited. * OPEX/day includes crewing costs, technical costs and insurance. EUR ‘000 FY2024 FY2023 Revenue 248,738 108,622 Cost of sales -124,228 -59,858 Gross profit 124,510 48,764 SG&A and other expenses -55,066 -34,321 Operating profit 69,444 14,443 Finance net -1,967 -2,945 Profit before income tax 67,477 11,498 Income tax expense -2,408 0 Profit after tax 65,069 11,498 EBITDA 125,897 42,491 Vessel OPEX (EUR per day)* 35,405 35,047 No. of vessels (as of YE 2024) 5 4 Headcount onshore (Average) 242 113 21 |
|
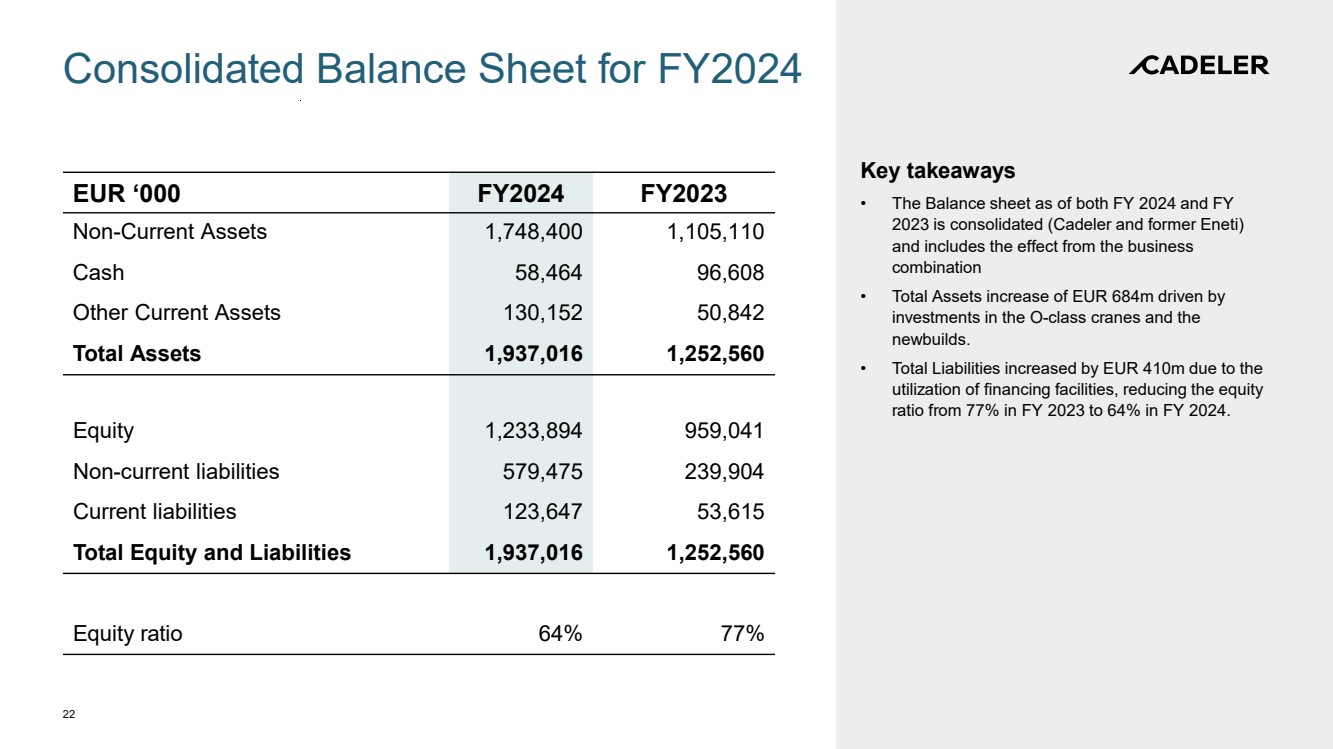
Consolidated Balance Sheet for FY2024 Key takeaways • The Balance sheet as of both FY 2024 and FY 2023 is consolidated (Cadeler and former Eneti) and includes the effect from the business combination • Total Assets increase of EUR 684m driven by investments in the O-class cranes and the newbuilds. • Total Liabilities increased by EUR 410m due to the utilization of financing facilities, reducing the equity ratio from 77% in FY 2023 to 64% in FY 2024. 22 EUR ‘000 FY2024 FY2023 Non-Current Assets 1,748,400 1,105,110 Cash 58,464 96,608 Other Current Assets 130,152 50,842 Total Assets 1,937,016 1,252,560 Equity 1,233,894 959,041 Non-current liabilities 579,475 239,904 Current liabilities 123,647 53,615 Total Equity and Liabilities 1,937,016 1,252,560 Equity ratio 64% 77% |
|
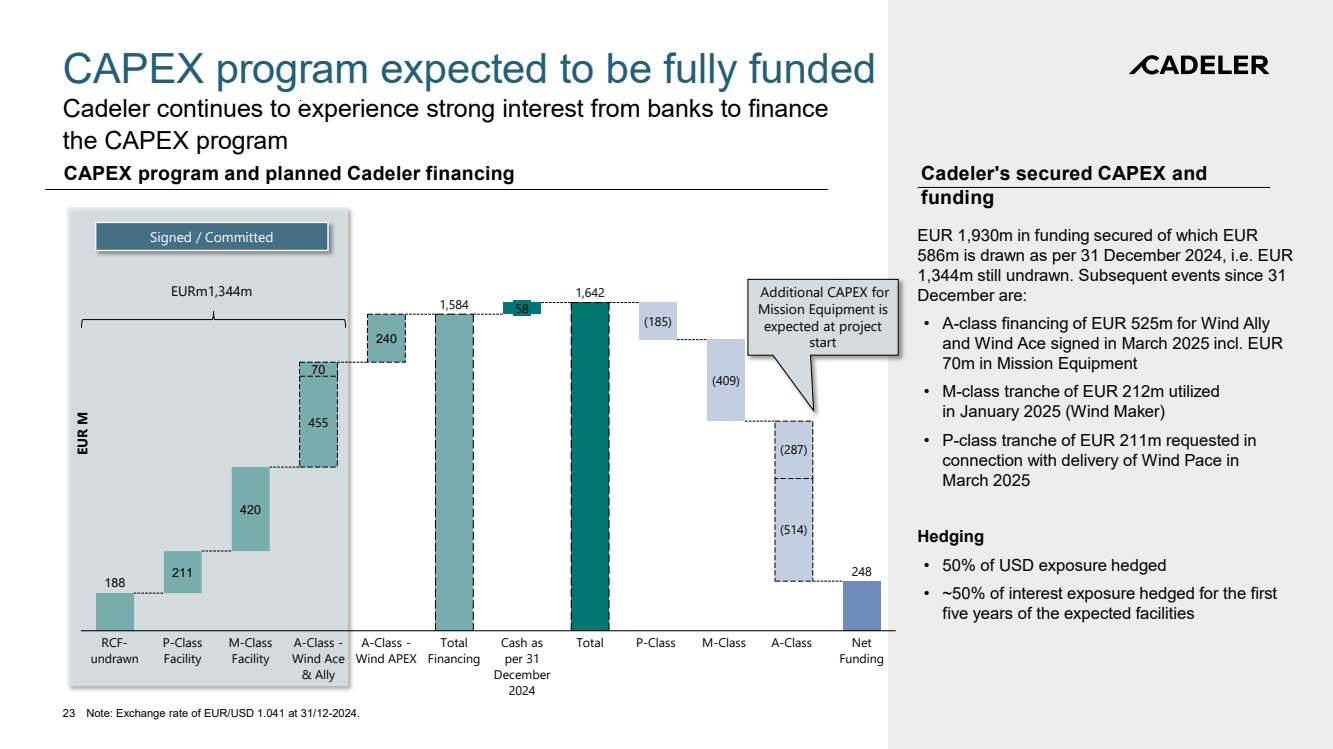
CAPEX program expected to be fully funded Cadeler continues to experience strong interest from banks to finance the CAPEX program 23 Note: Exchange rate of EUR/USD 1.041 at 31/12-2024. Cadeler's secured CAPEX and funding CAPEX program and planned Cadeler financing EUR 1,930m in funding secured of which EUR 586m is drawn as per 31 December 2024, i.e. EUR 1,344m still undrawn. Subsequent events since 31 December are: • A-class financing of EUR 525m for Wind Ally and Wind Ace signed in March 2025 incl. EUR 70m in Mission Equipment • M-class tranche of EUR 212m utilized in January 2025 (Wind Maker) • P-class tranche of EUR 211m requested in connection with delivery of Wind Pace in March 2025 Hedging • 50% of USD exposure hedged • ~50% of interest exposure hedged for the first five years of the expected facilities EUR M 188 211 248 420 455 240 70 P-Class Facility M-Class Facility (409) (287) P-Class (185) M-Class (514) A-Class Net Funding Cash as Total per 31 December 2024 58 Total Financing RCF-undrawn A-Class - Wind APEX A-Class - Wind Ace & Ally 1,584 1,642 Signed / Committed EURm1,344m Additional CAPEX for Mission Equipment is expected at project start |
|
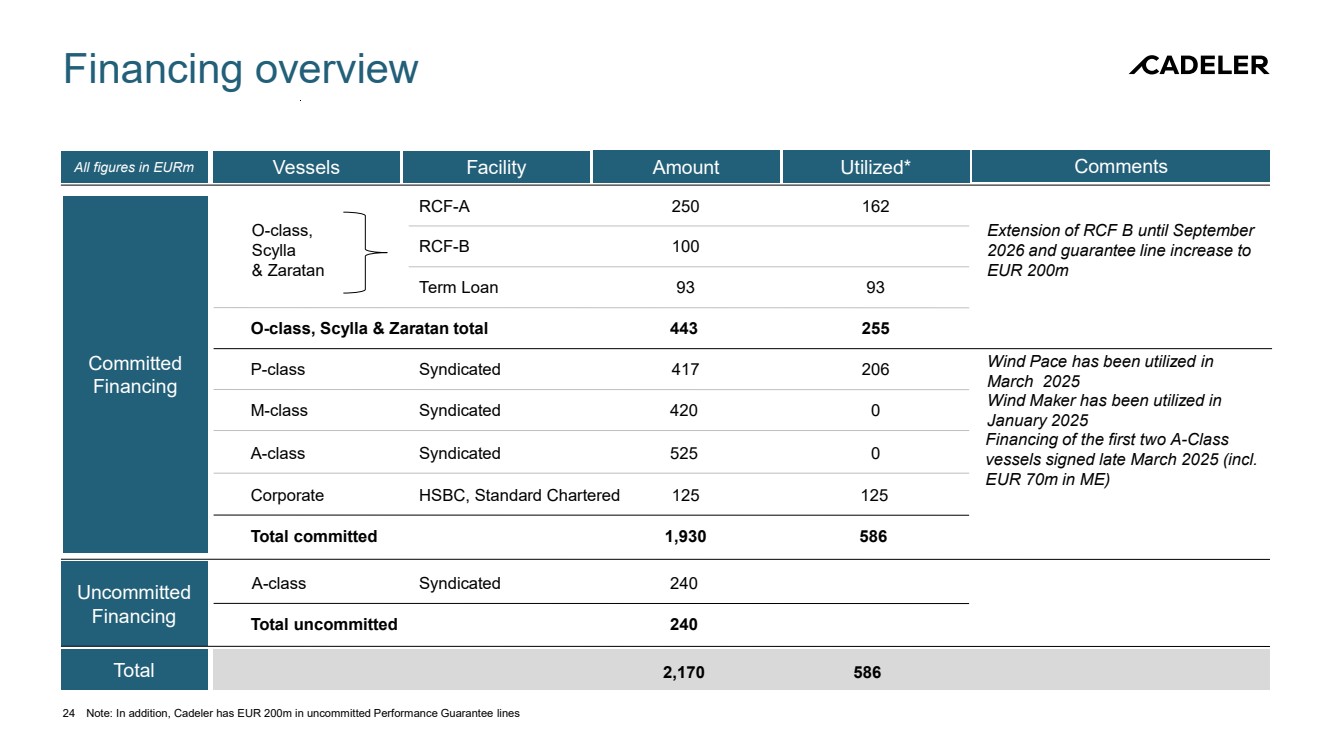
Financing overview Committed Financing Uncommitted Financing Vessels Extension of RCF B until September 2026 and guarantee line increase to EUR 200m Comments Wind Maker has been utilized in January 2025 Financing of the first two A-Class vessels signed late March 2025 (incl. EUR 70m in ME) All figures in EURm Total Wind Pace has been utilized in March 2025 Amount Total uncommitted 240 2,170 O-class, Scylla & Zaratan Facility RCF-B 100 Term Loan 93 93 A-class Syndicated 240 P-class Syndicated 417 206 M-class Syndicated 420 0 Utilized* 586 RCF-A 250 162 Corporate HSBC, Standard Chartered 125 125 O-class, Scylla & Zaratan total 443 255 Total committed 1,930 586 A-class Syndicated 525 0 24 Note: In addition, Cadeler has EUR 200m in uncommitted Performance Guarantee lines |
|
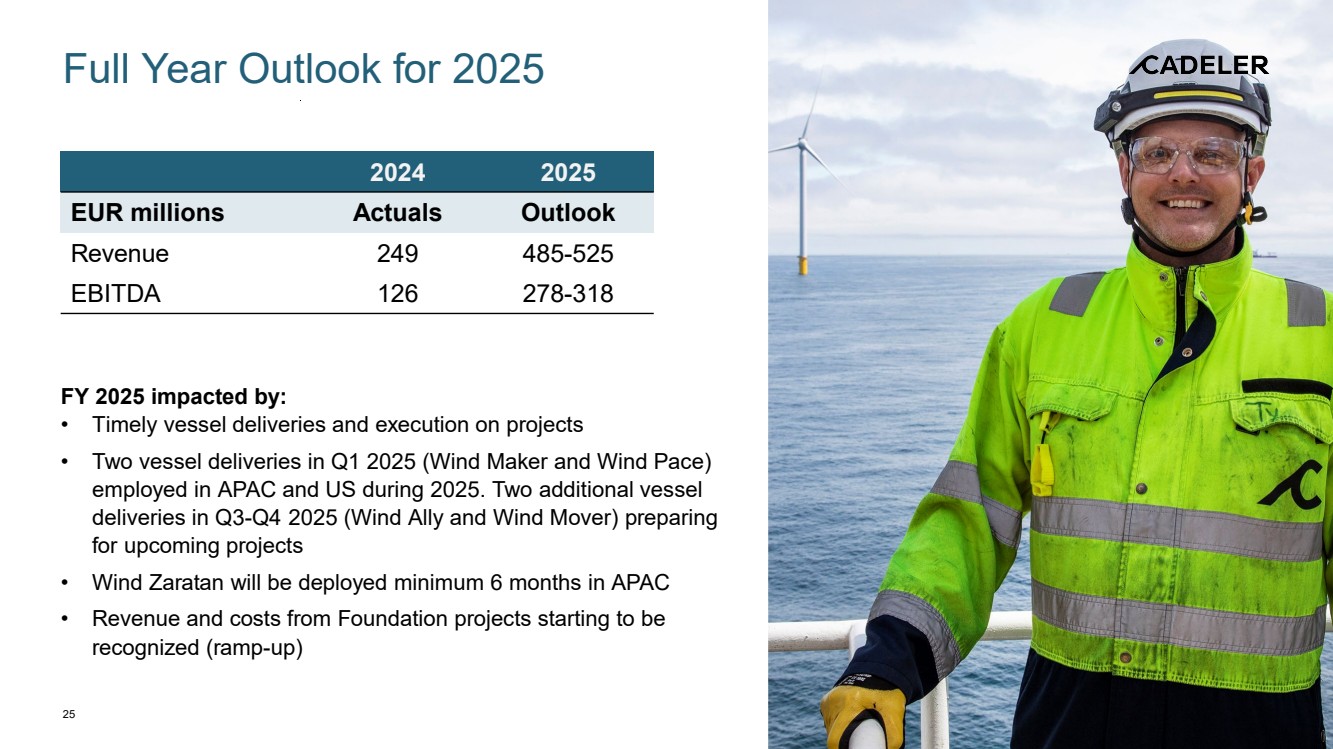
Full Year Outlook for 2025 FY 2025 impacted by: • Timely vessel deliveries and execution on projects • Two vessel deliveries in Q1 2025 (Wind Maker and Wind Pace) employed in APAC and US during 2025. Two additional vessel deliveries in Q3-Q4 2025 (Wind Ally and Wind Mover) preparing for upcoming projects • Wind Zaratan will be deployed minimum 6 months in APAC • Revenue and costs from Foundation projects starting to be recognized (ramp-up) 25 2024 2025 EUR millions Actuals Outlook Revenue 249 485-525 EBITDA 126 278-318 |
|
Sustainability Highlights |
|
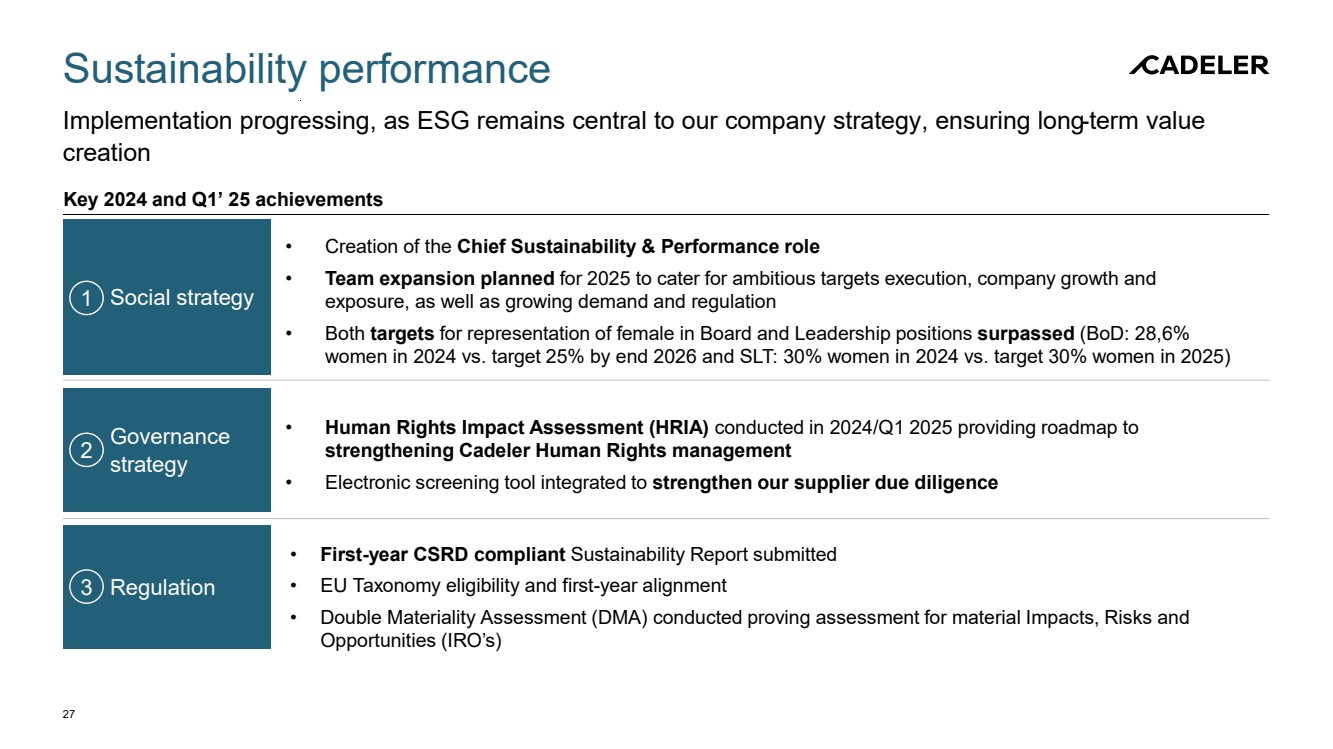
Sustainability performance Implementation progressing, as ESG remains central to our company strategy, ensuring long-term value creation 27 Key 2024 and Q1’ 25 achievements 1 Social strategy • Creation of the Chief Sustainability & Performance role • Team expansion planned for 2025 to cater for ambitious targets execution, company growth and exposure, as well as growing demand and regulation • Both targets for representation of female in Board and Leadership positions surpassed (BoD: 28,6% women in 2024 vs. target 25% by end 2026 and SLT: 30% women in 2024 vs. target 30% women in 2025) • Human Rights Impact Assessment (HRIA) conducted in 2024/Q1 2025 providing roadmap to strengthening Cadeler Human Rights management • Electronic screening tool integrated to strengthen our supplier due diligence • First-year CSRD compliant Sustainability Report submitted • EU Taxonomy eligibility and first-year alignment • Double Materiality Assessment (DMA) conducted proving assessment for material Impacts, Risks and Opportunities (IRO’s) Governance strategy Regulation 2 3 |
|
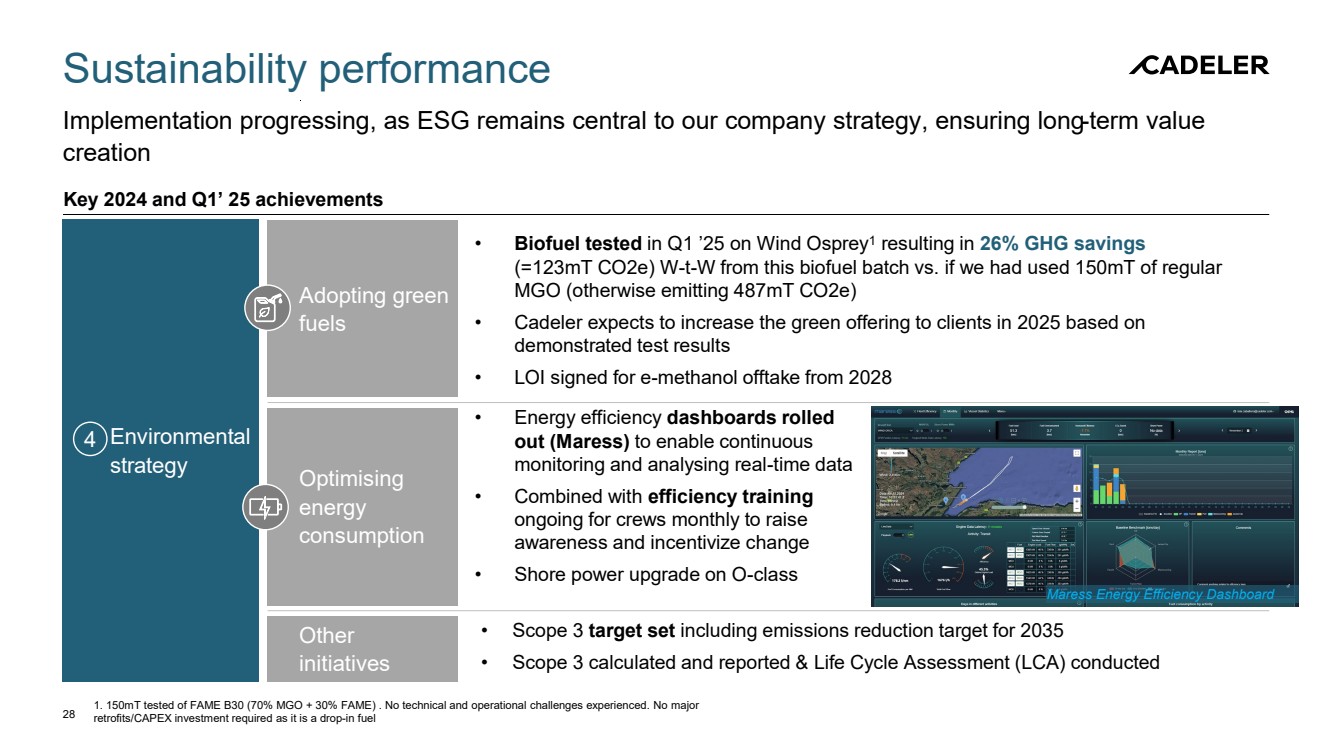
Sustainability performance Implementation progressing, as ESG remains central to our company strategy, ensuring long-term value creation 28 Key 2024 and Q1’ 25 achievements Environmental strategy 4 • Biofuel tested in Q1 ’25 on Wind Osprey1 resulting in 26% GHG savings (=123mT CO2e) W-t-W from this biofuel batch vs. if we had used 150mT of regular MGO (otherwise emitting 487mT CO2e) • Cadeler expects to increase the green offering to clients in 2025 based on demonstrated test results • LOI signed for e-methanol offtake from 2028 Maress Energy Efficiency Dashboard • Scope 3 target set including emissions reduction target for 2035 • Scope 3 calculated and reported & Life Cycle Assessment (LCA) conducted Adopting green fuels Optimising energy consumption Other initiatives 1. 150mT tested of FAME B30 (70% MGO + 30% FAME) . No technical and operational challenges experienced. No major retrofits/CAPEX investment required as it is a drop-in fuel • Energy efficiency dashboards rolled out (Maress) to enable continuous monitoring and analysing real-time data • Combined with efficiency training ongoing for crews monthly to raise awareness and incentivize change • Shore power upgrade on O-class |
|
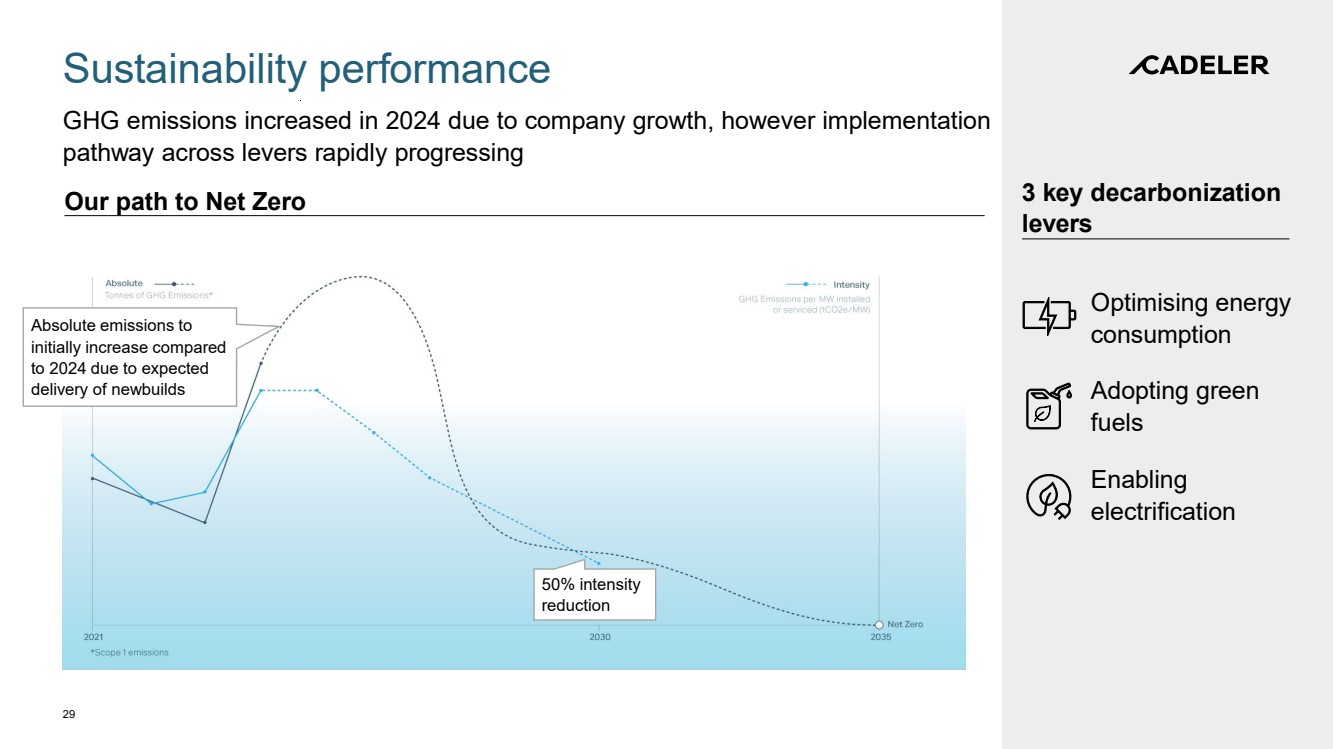
Sustainability performance GHG emissions increased in 2024 due to company growth, however implementation pathway across levers rapidly progressing Optimising energy consumption Adopting green fuels Enabling electrification 29 3 key decarbonization levers Our path to Net Zero Absolute emissions to initially increase compared to 2024 due to expected delivery of newbuilds 50% intensity reduction |
|
Continuing the growth journey |
|
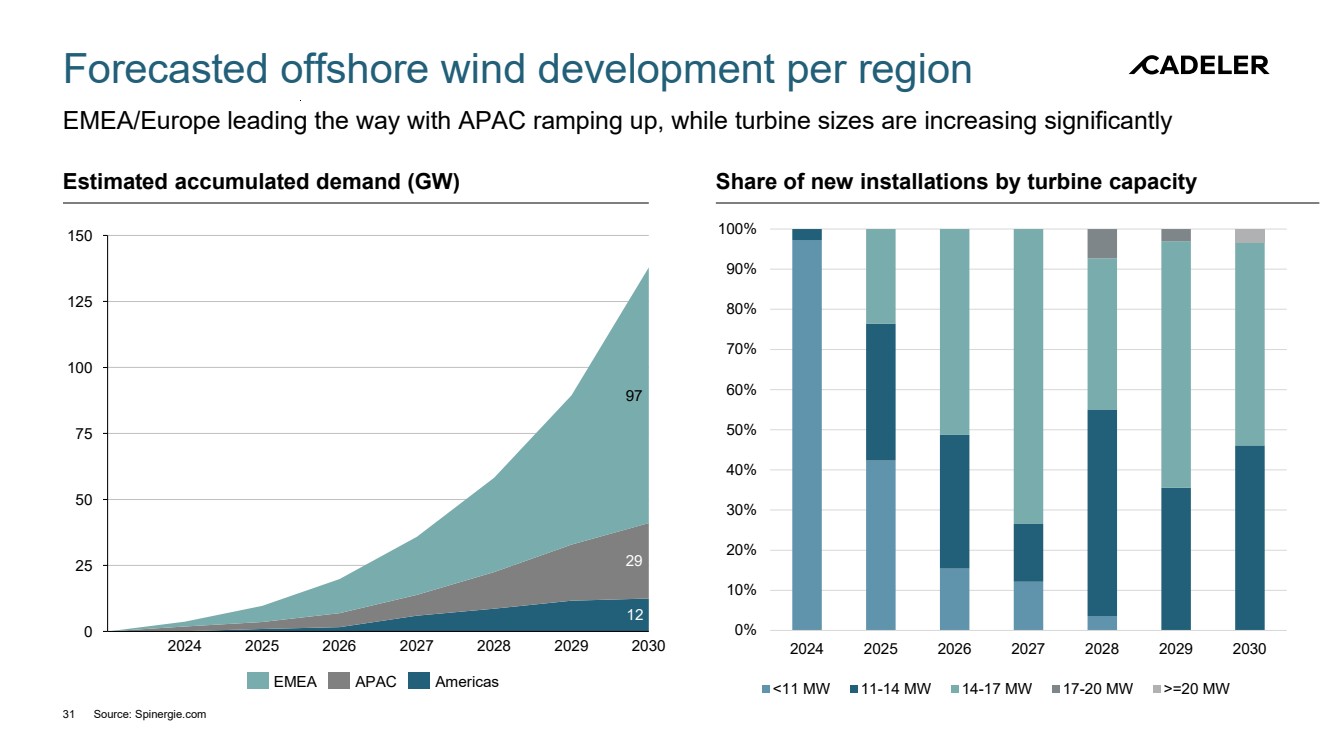
Forecasted offshore wind development per region EMEA/Europe leading the way with APAC ramping up, while turbine sizes are increasing significantly 31 0% 10% 20% 30% 40% 50% 60% 70% 80% 90% 100% 2024 2025 2026 2027 2028 2029 2030 <11 MW 11-14 MW 14-17 MW 17-20 MW >=20 MW Source: Spinergie.com 0 25 50 75 100 125 150 2024 2025 2026 2027 2028 2029 97 29 12 2030 EMEA APAC Americas Estimated accumulated demand (GW) Share of new installations by turbine capacity |
|
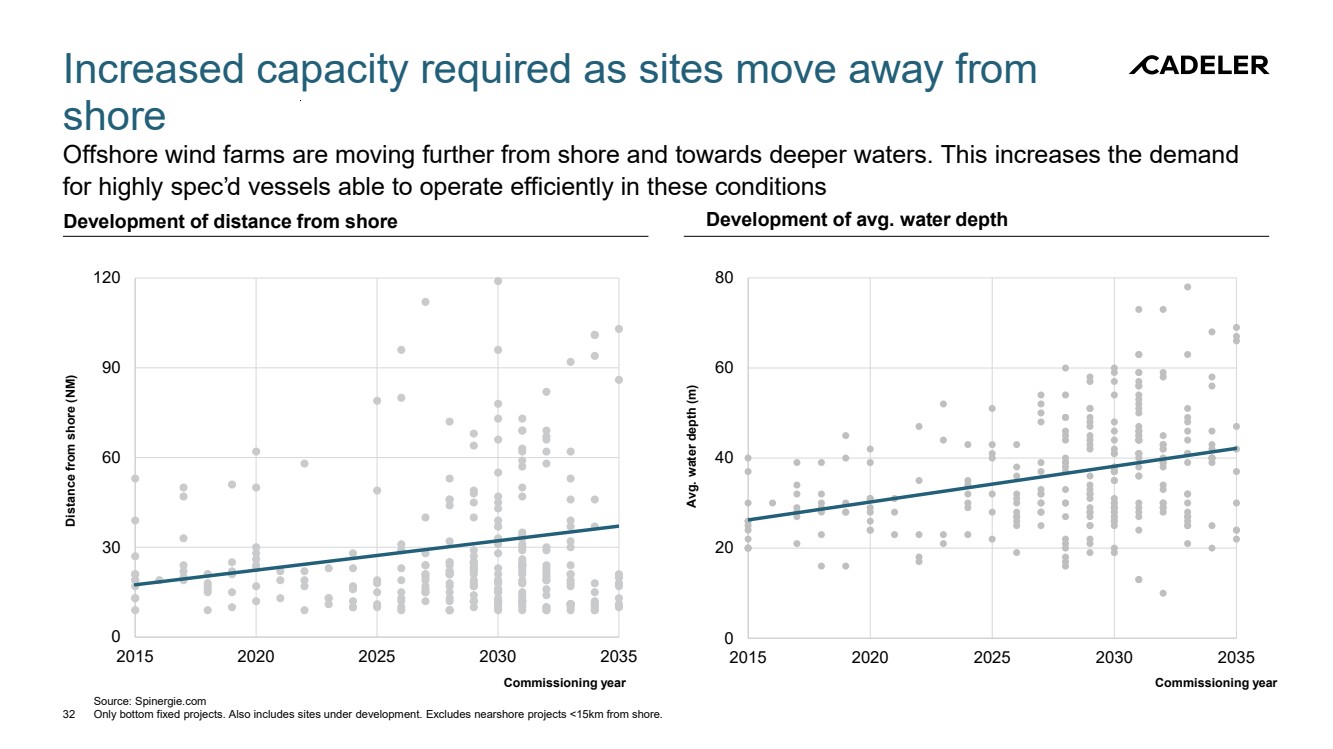
Increased capacity required as sites move away from shore Offshore wind farms are moving further from shore and towards deeper waters. This increases the demand for highly spec’d vessels able to operate efficiently in these conditions Source: Spinergie.com 32 Only bottom fixed projects. Also includes sites under development. Excludes nearshore projects <15km from shore. Distance from shore (NM) Commissioning year Avg. water depth (m) Development of distance from shore Development of avg. water depth 0 20 40 60 80 2015 2020 2025 2030 2035 0 30 60 90 120 2015 2020 2025 2030 2035 Commissioning year |
|
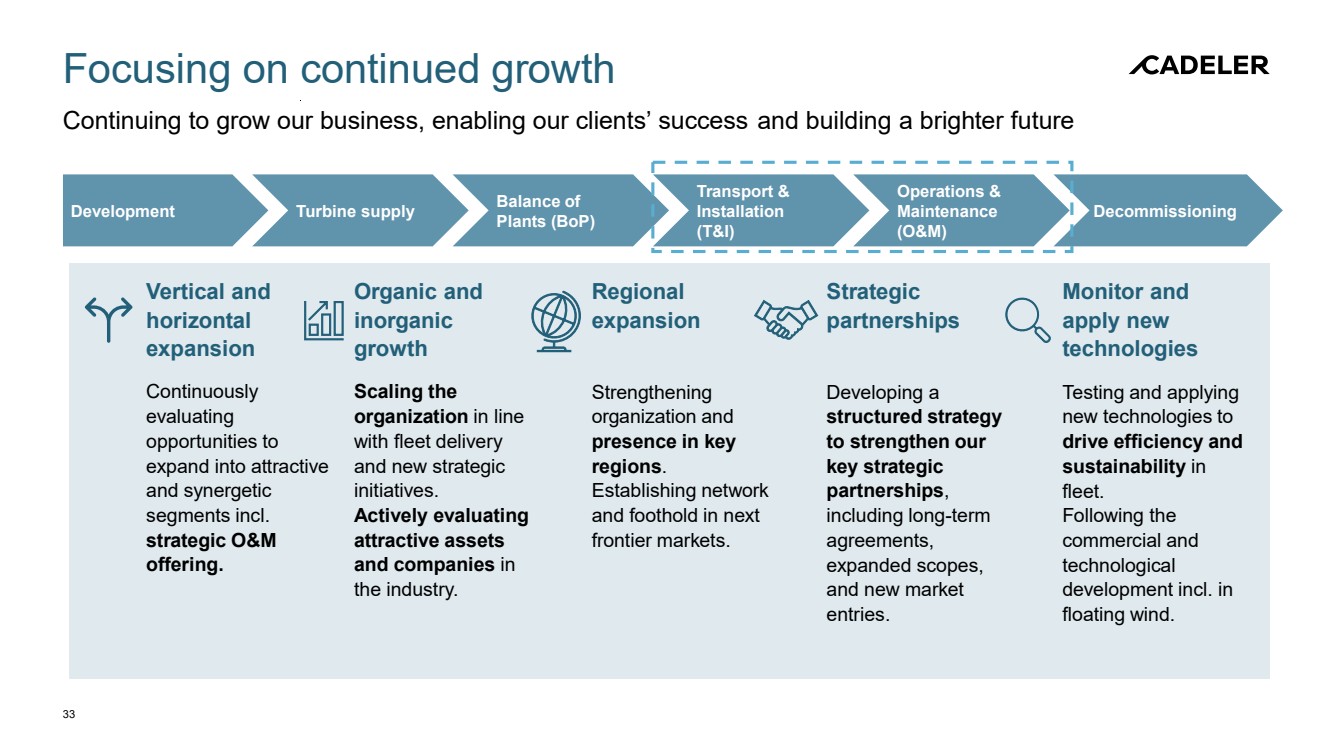
Focusing on continued growth Continuing to grow our business, enabling our clients’ success and building a brighter future 33 Development Turbine supply Balance of Plants (BoP) Transport & Installation (T&I) Operations & Maintenance (O&M) Decommissioning Vertical and horizontal expansion Organic and inorganic growth Regional expansion Strategic partnerships Monitor and apply new technologies Continuously evaluating opportunities to expand into attractive and synergetic segments incl. strategic O&M offering. Scaling the organization in line with fleet delivery and new strategic initiatives. Actively evaluating attractive assets and companies in the industry. Strengthening organization and presence in key regions. Establishing network and foothold in next frontier markets. Developing a structured strategy to strengthen our key strategic partnerships, including long-term agreements, expanded scopes, and new market entries. Testing and applying new technologies to drive efficiency and sustainability in fleet. Following the commercial and technological development incl. in floating wind. |
|
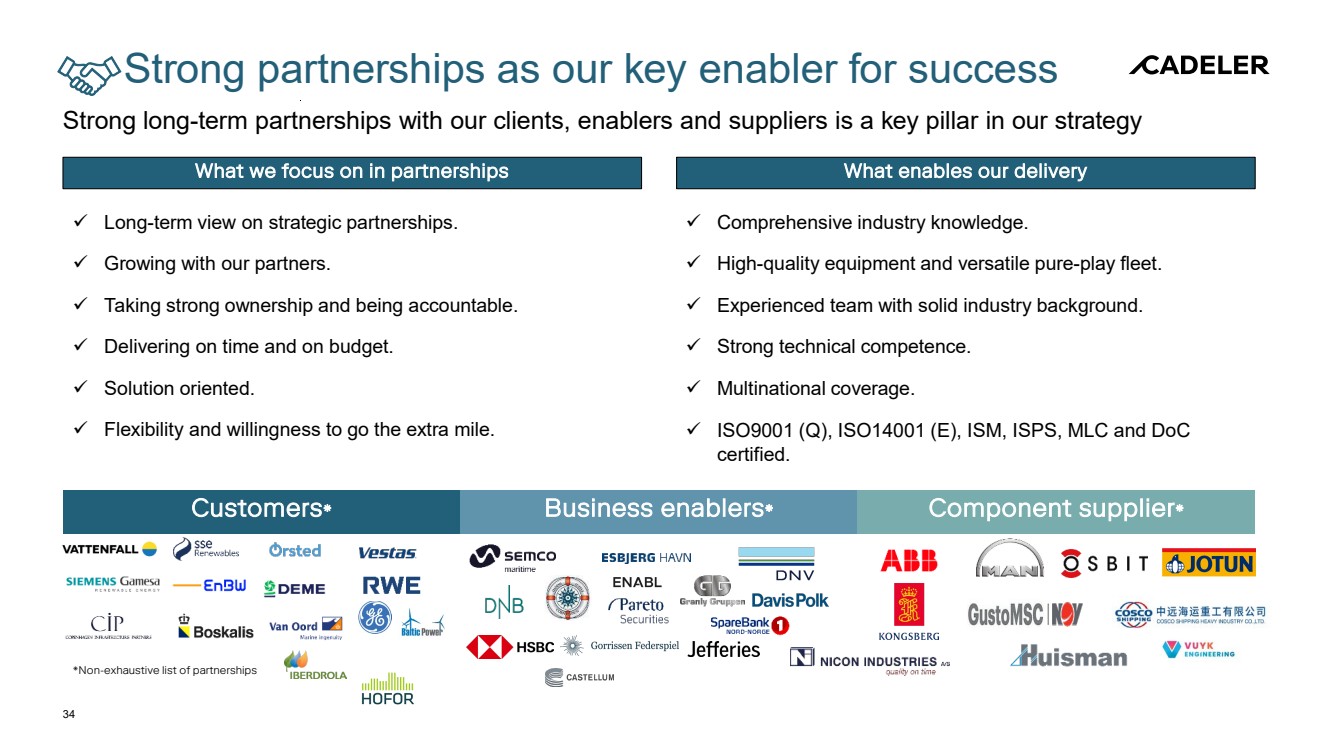
Customers* Business enablers* Component supplier* Strong partnerships as our key enabler for success Strong long-term partnerships with our clients, enablers and suppliers is a key pillar in our strategy *Non-exhaustive list of partnerships Long-term view on strategic partnerships. Growing with our partners. Taking strong ownership and being accountable. Delivering on time and on budget. Solution oriented. Flexibility and willingness to go the extra mile. Comprehensive industry knowledge. High-quality equipment and versatile pure-play fleet. Experienced team with solid industry background. Strong technical competence. Multinational coverage. ISO9001 (Q), ISO14001 (E), ISM, ISPS, MLC and DoC certified. What we focus on in partnerships What enables our delivery 34 |
|
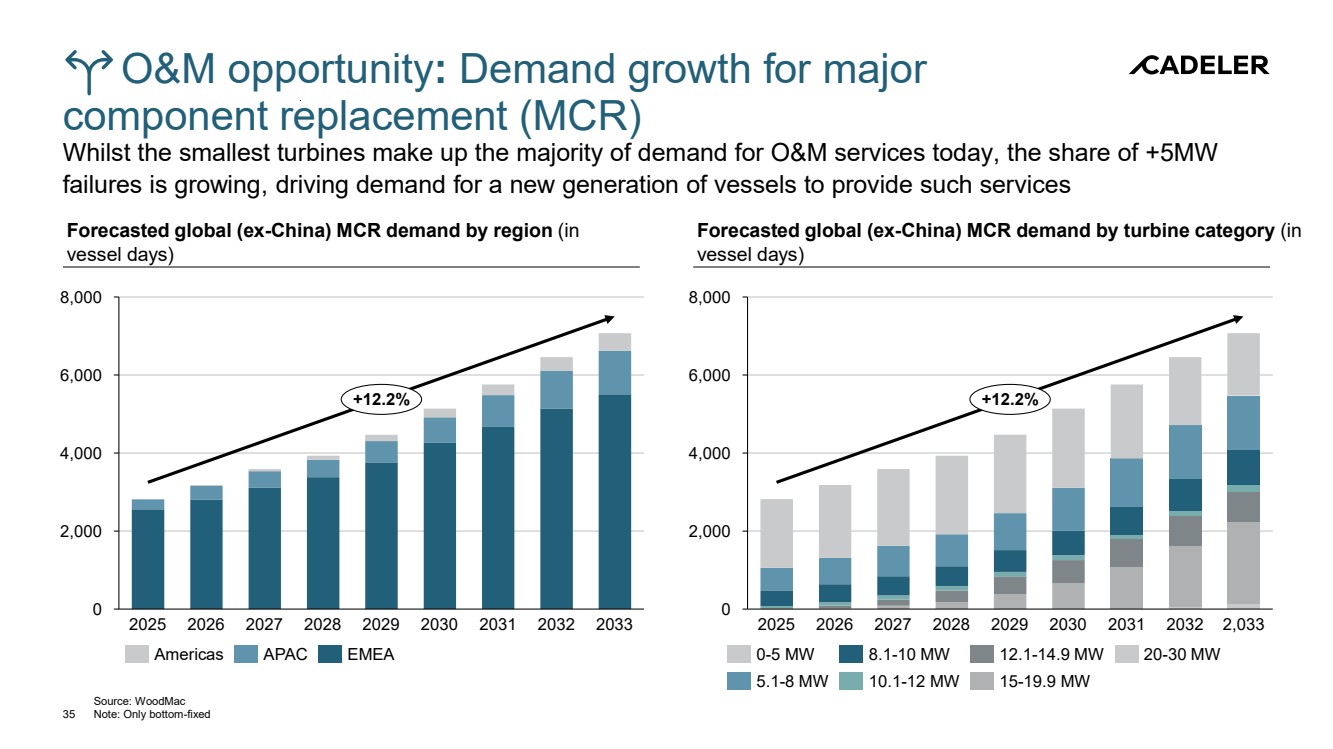
O&M opportunity: Demand growth for major component replacement (MCR) Whilst the smallest turbines make up the majority of demand for O&M services today, the share of +5MW failures is growing, driving demand for a new generation of vessels to provide such services Source: WoodMac 35 Note: Only bottom-fixed Forecasted global (ex-China) MCR demand by region (in vessel days) 0 2,000 4,000 6,000 8,000 2025 2026 2027 2028 2029 2030 2031 2032 2033 +12.2% Americas APAC EMEA 0 2,000 4,000 6,000 8,000 2025 2026 2027 2028 2029 2030 2031 2032 2,033 +12.2% 0-5 MW 5.1-8 MW 8.1-10 MW 10.1-12 MW 12.1-14.9 MW 15-19.9 MW 20-30 MW Forecasted global (ex-China) MCR demand by turbine category (in vessel days) |
|
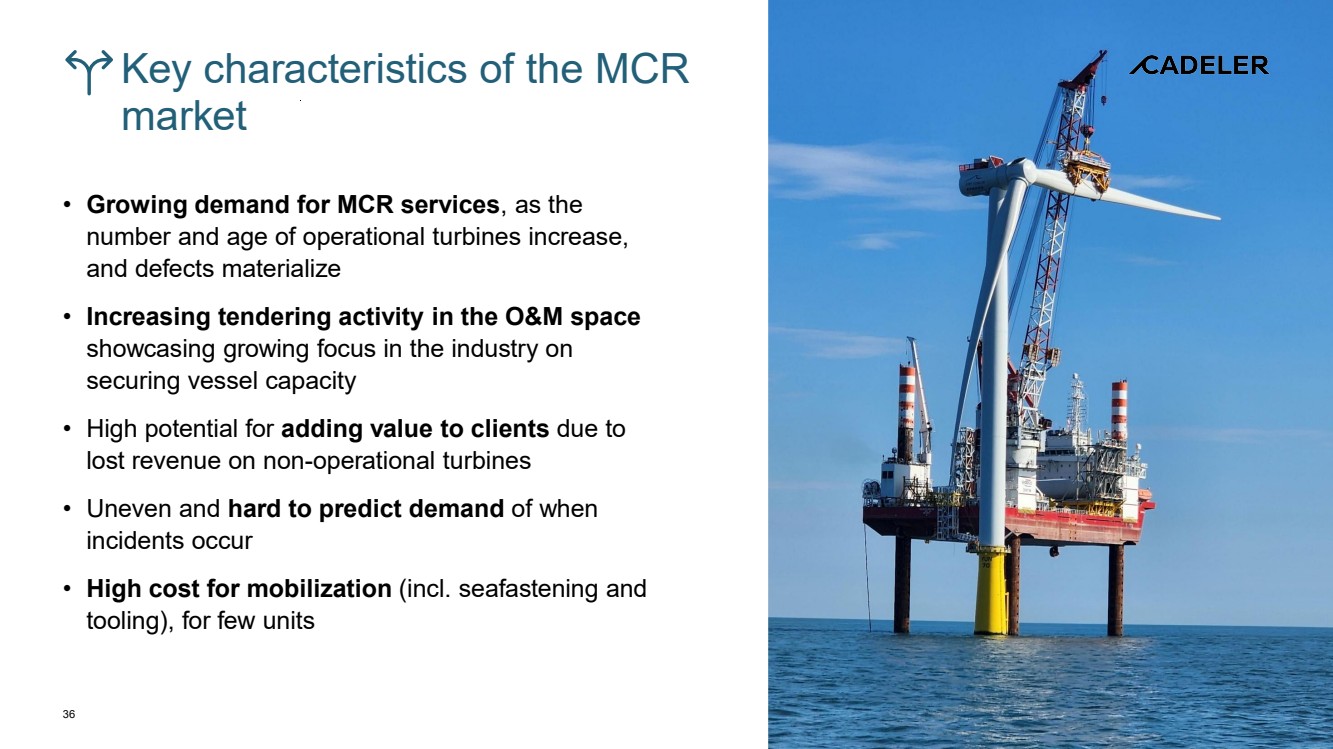
Key characteristics of the MCR market • Growing demand for MCR services, as the number and age of operational turbines increase, and defects materialize • Increasing tendering activity in the O&M space showcasing growing focus in the industry on securing vessel capacity • High potential for adding value to clients due to lost revenue on non-operational turbines • Uneven and hard to predict demand of when incidents occur • High cost for mobilization (incl. seafastening and tooling), for few units 36 |
|
Investment highlights 37 Largest, most capable and most versatile fleet in the industry. Strong complementarity in fleet enables cross-utilization, efficiency and project derisking. Highly experienced team with a proven track record, critical know-how and long-standing deep commercial relationships and contracts with the industry’s leading developers. Global growth platform with project experience and presence in all major offshore wind markets. Anticipated undersupply of capable WTG and FOU vessels from 2027 and onwards, due to significantly increasing market demand. Strong track record in the capital markets backed by a record high backlog (€2.5B) providing earnings € visibility. Key focus on being a good custodian of capital. |
|
Q & A |
|
Additional questions can be sent to investorrelations@cadeler.com Cadeler Kalvebod Brygge 43 DK–1560 Copenhagen Denmark +45 3246 3100 Follow us: |
