EXHIBIT 99.1
Published on November 20, 2025
| Third Quarter 2025 Earnings Release For the period 1 January to 30 September 2025 Cadeler A/S. Incorporated in Denmark. Registration Number (CVR no.): 3118 0503 Kalvebod Brygge 43, DK-1560 Copenhagen V, Denmark |
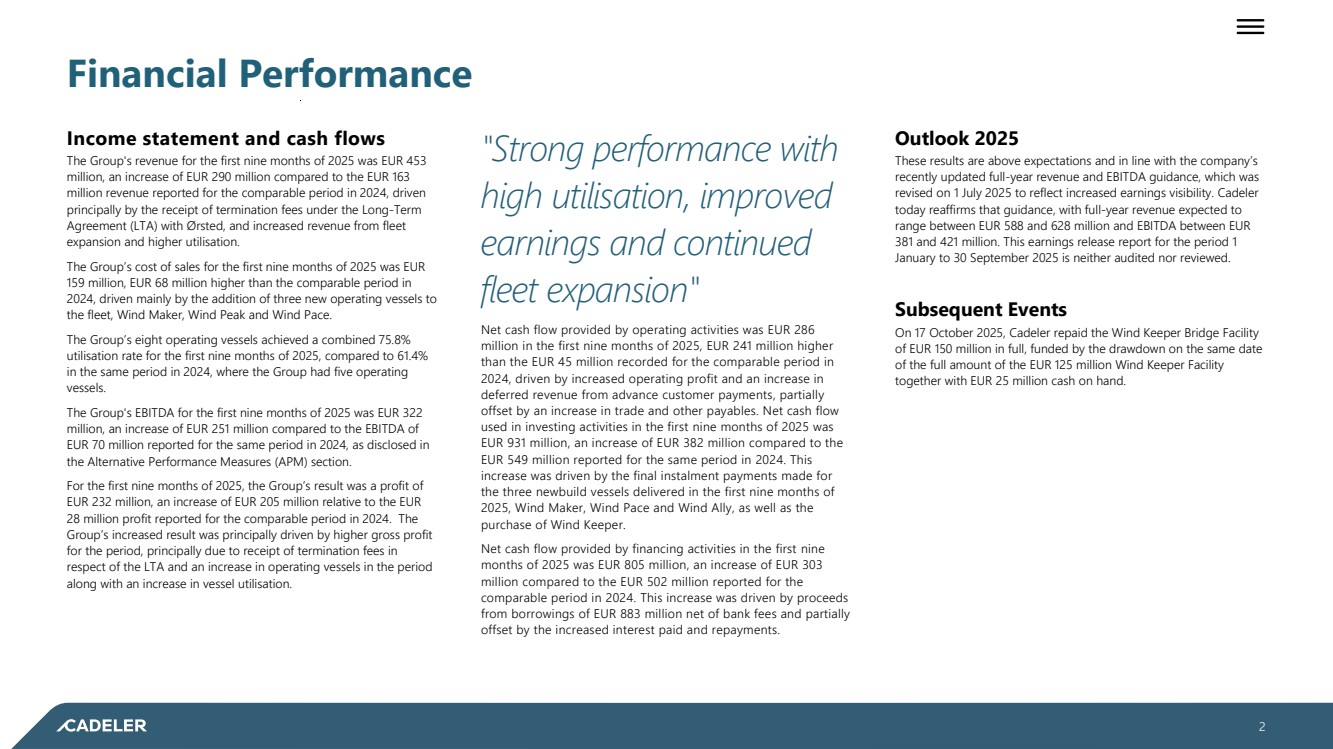
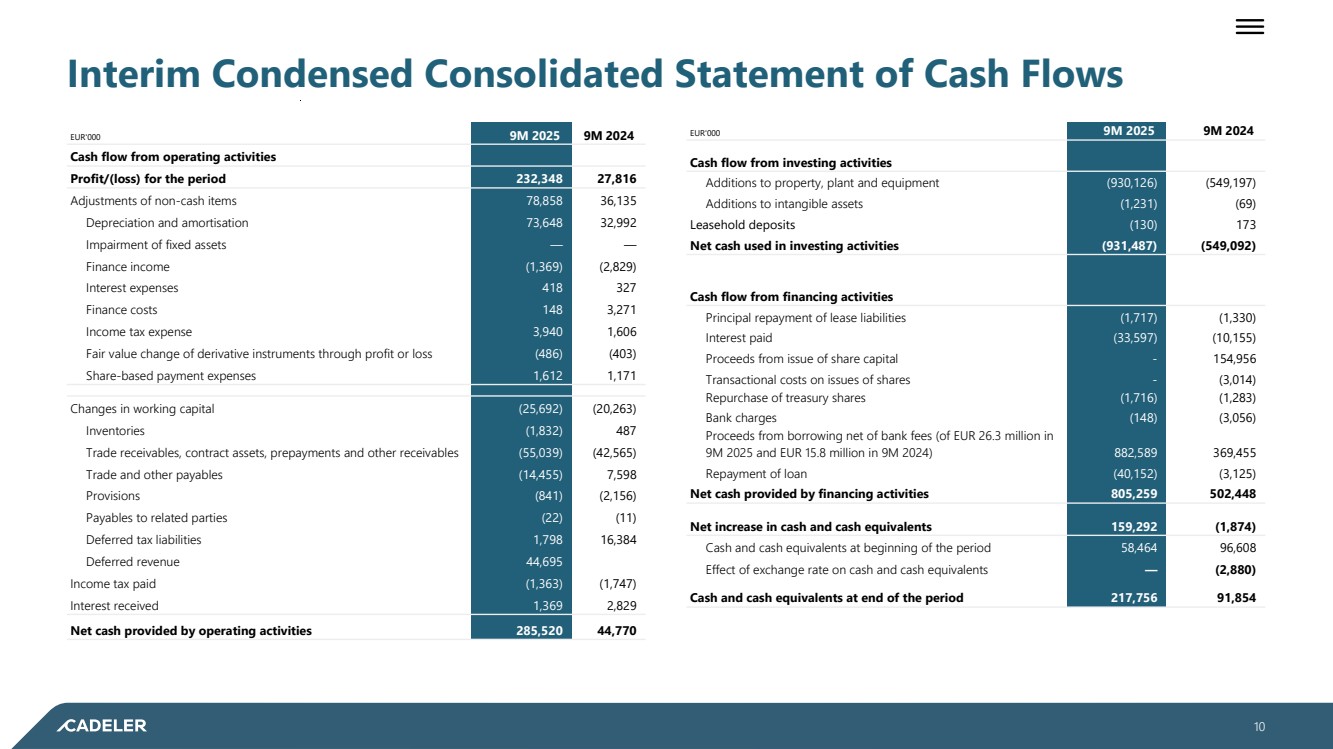
| Financial Performance Income statement and cash flows The Group's revenue for the first nine months of 2025 was EUR 453 million, an increase of EUR 290 million compared to the EUR 163 million revenue reported for the comparable period in 2024, driven principally by the receipt of termination fees under the Long-Term Agreement (LTA) with Ørsted, and increased revenue from fleet expansion and higher utilisation. The Group’s cost of sales for the first nine months of 2025 was EUR 159 million, EUR 68 million higher than the comparable period in 2024, driven mainly by the addition of three new operating vessels to the fleet, Wind Maker, Wind Peak and Wind Pace. The Group’s eight operating vessels achieved a combined 75.8% utilisation rate for the first nine months of 2025, compared to 61.4% in the same period in 2024, where the Group had five operating vessels. The Group's EBITDA for the first nine months of 2025 was EUR 322 million, an increase of EUR 251 million compared to the EBITDA of EUR 70 million reported for the same period in 2024, as disclosed in the Alternative Performance Measures (APM) section. For the first nine months of 2025, the Group’s result was a profit of EUR 232 million, an increase of EUR 205 million relative to the EUR 28 million profit reported for the comparable period in 2024. The Group’s increased result was principally driven by higher gross profit for the period, principally due to receipt of termination fees in respect of the LTA and an increase in operating vessels in the period along with an increase in vessel utilisation. Net cash flow provided by operating activities was EUR 286 million in the first nine months of 2025, EUR 241 million higher than the EUR 45 million recorded for the comparable period in 2024, driven by increased operating profit and an increase in deferred revenue from advance customer payments, partially offset by an increase in trade and other payables. Net cash flow used in investing activities in the first nine months of 2025 was EUR 931 million, an increase of EUR 382 million compared to the EUR 549 million reported for the same period in 2024. This increase was driven by the final instalment payments made for the three newbuild vessels delivered in the first nine months of 2025, Wind Maker, Wind Pace and Wind Ally, as well as the purchase of Wind Keeper. Net cash flow provided by financing activities in the first nine months of 2025 was EUR 805 million, an increase of EUR 303 million compared to the EUR 502 million reported for the comparable period in 2024. This increase was driven by proceeds from borrowings of EUR 883 million net of bank fees and partially offset by the increased interest paid and repayments. Outlook 2025 These results are above expectations and in line with the company’s recently updated full-year revenue and EBITDA guidance, which was revised on 1 July 2025 to reflect increased earnings visibility. Cadeler today reaffirms that guidance, with full-year revenue expected to range between EUR 588 and 628 million and EBITDA between EUR 381 and 421 million. This earnings release report for the period 1 January to 30 September 2025 is neither audited nor reviewed. Subsequent Events On 17 October 2025, Cadeler repaid the Wind Keeper Bridge Facility of EUR 150 million in full, funded by the drawdown on the same date of the full amount of the EUR 125 million Wind Keeper Facility together with EUR 25 million cash on hand. ________________ 2 "Strong performance with high utilisation, improved earnings and continued fleet expansion" |
| Financial Performance Continued from previous page Key Figures 9M 2025 9M 2024 EUR'000 Revenue 452,785 162,785 Gross profit 293,959 72,289 Operating profit 247,637 31,841 Net financials (9,713) (2,414) Profit for the period 232,348 27,816 Cash flow provided by operating activities 285,520 44,770 Cash flow used in investing activities (931,487) (549,092) Of which investment in property, plant and equipment (930,126) (549,197) Cash flow provided by financing activities 805,259 502,448 Net increase/(decrease) in cash and cash equivalents 159,292 (1,874) Share related key figures Earnings per share (EPS), EUR 0.66 0.08 Diluted earnings per share (diluted EPS), EUR 0.65 0.08 Operational metrics Contracted days (no. of days) 1,365 700 Utilisation (%) 75.8 % 61.4 % ________________ 3 |
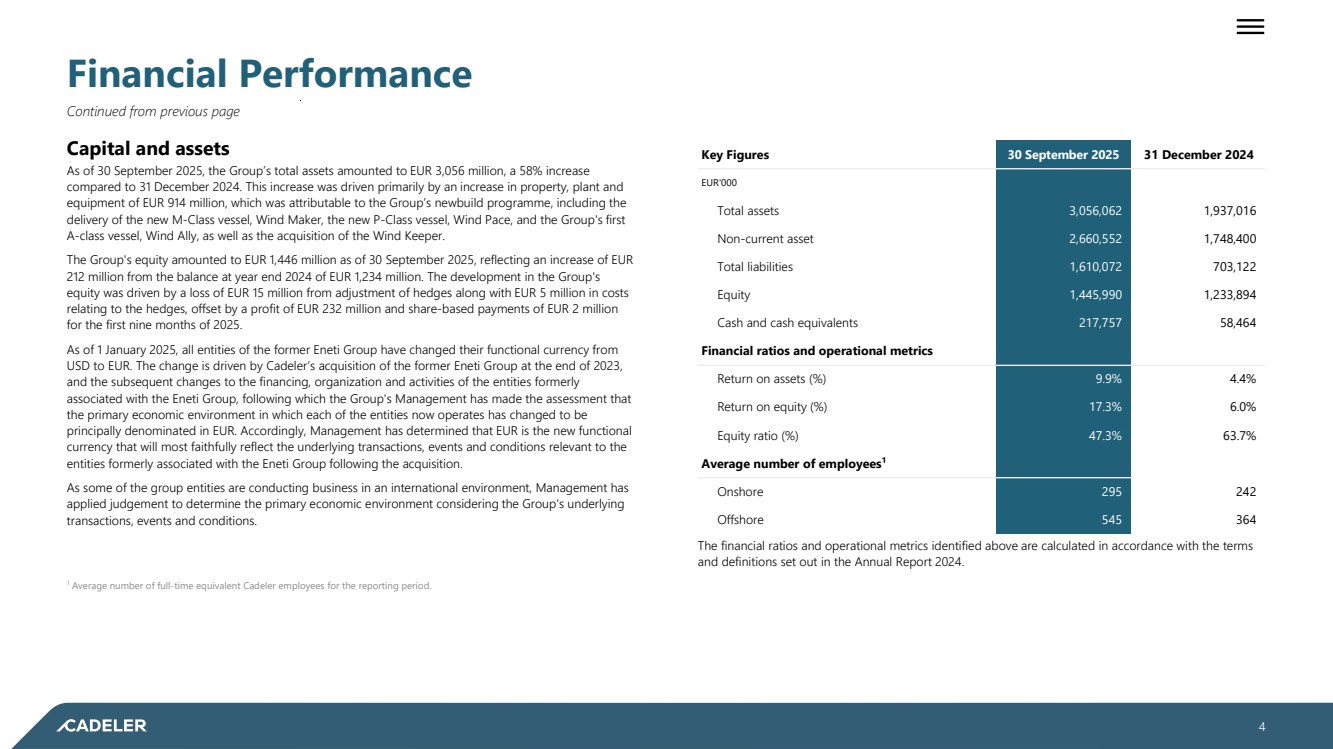
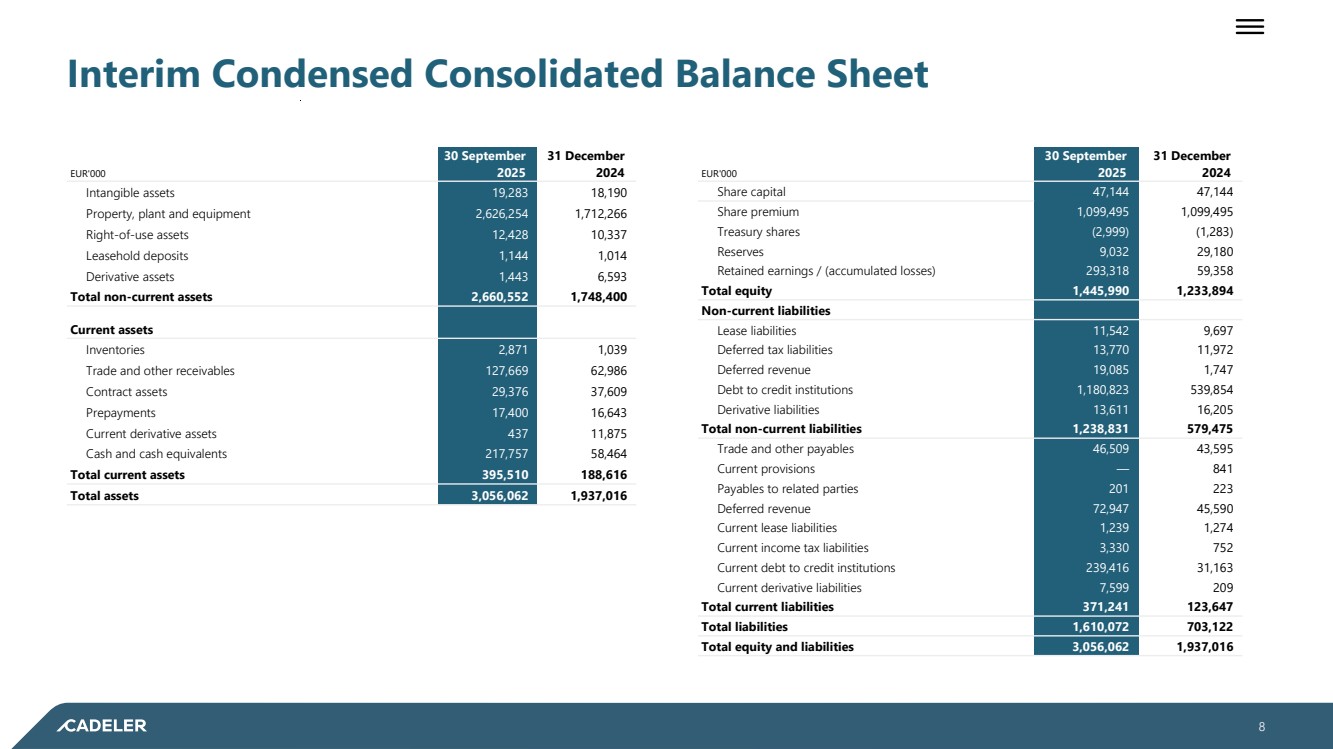
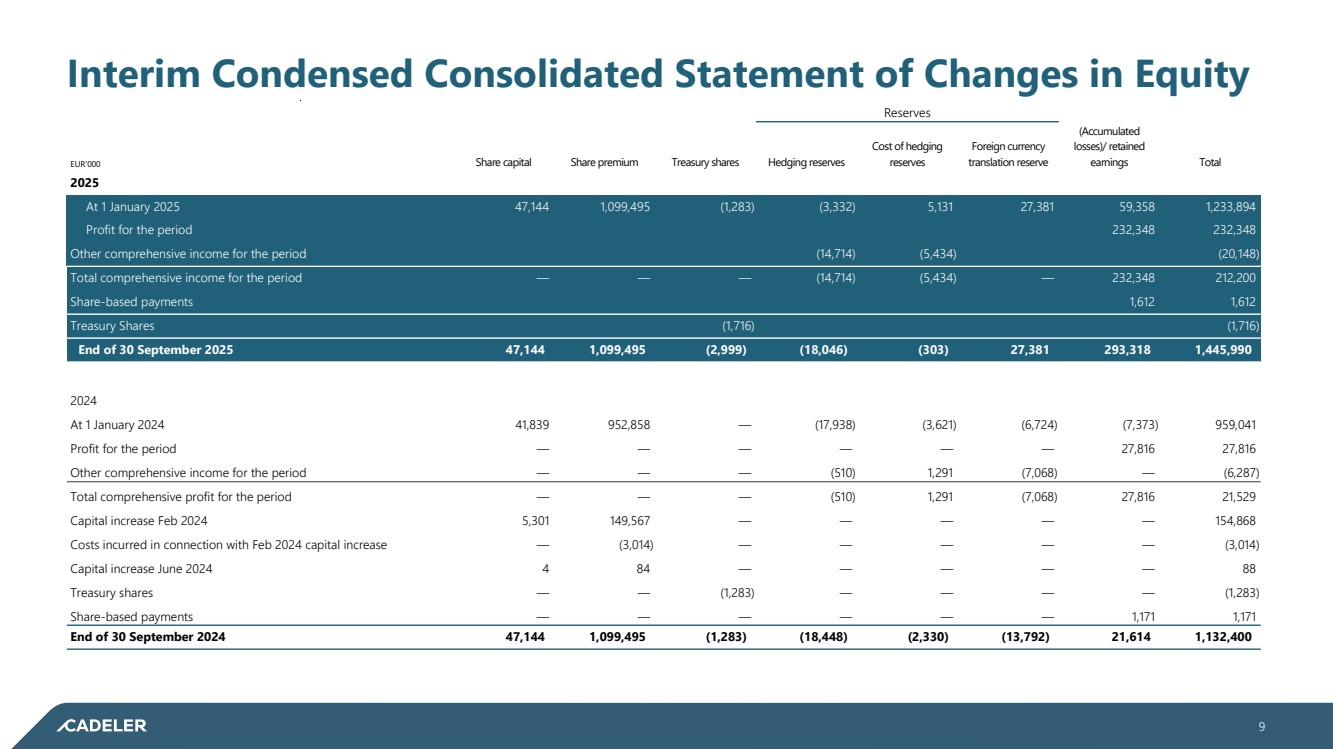
| Financial Performance Continued from previous page Capital and assets As of 30 September 2025, the Group’s total assets amounted to EUR 3,056 million, a 58% increase compared to 31 December 2024. This increase was driven primarily by an increase in property, plant and equipment of EUR 914 million, which was attributable to the Group’s newbuild programme, including the delivery of the new M-Class vessel, Wind Maker, the new P-Class vessel, Wind Pace, and the Group's first A-class vessel, Wind Ally, as well as the acquisition of the Wind Keeper. The Group's equity amounted to EUR 1,446 million as of 30 September 2025, reflecting an increase of EUR 212 million from the balance at year end 2024 of EUR 1,234 million. The development in the Group's equity was driven by a loss of EUR 15 million from adjustment of hedges along with EUR 5 million in costs relating to the hedges, offset by a profit of EUR 232 million and share-based payments of EUR 2 million for the first nine months of 2025. As of 1 January 2025, all entities of the former Eneti Group have changed their functional currency from USD to EUR. The change is driven by Cadeler’s acquisition of the former Eneti Group at the end of 2023, and the subsequent changes to the financing, organization and activities of the entities formerly associated with the Eneti Group, following which the Group's Management has made the assessment that the primary economic environment in which each of the entities now operates has changed to be principally denominated in EUR. Accordingly, Management has determined that EUR is the new functional currency that will most faithfully reflect the underlying transactions, events and conditions relevant to the entities formerly associated with the Eneti Group following the acquisition. As some of the group entities are conducting business in an international environment, Management has applied judgement to determine the primary economic environment considering the Group's underlying transactions, events and conditions. Key Figures 30 September 2025 31 December 2024 EUR'000 Total assets 3,056,062 1,937,016 Non-current asset 2,660,552 1,748,400 Total liabilities 1,610,072 703,122 Equity 1,445,990 1,233,894 Cash and cash equivalents 217,757 58,464 Financial ratios and operational metrics Return on assets (%) 9.9 % 4.4 % Return on equity (%) 17.3 % 6.0 % Equity ratio (%) 47.3 % 63.7 % Average number of employees¹ Onshore 295 242 Offshore 545 364 The financial ratios and operational metrics identified above are calculated in accordance with the terms and definitions set out in the Annual Report 2024. 1 Average number of full-time equivalent Cadeler employees for the reporting period. ________________ 4 |
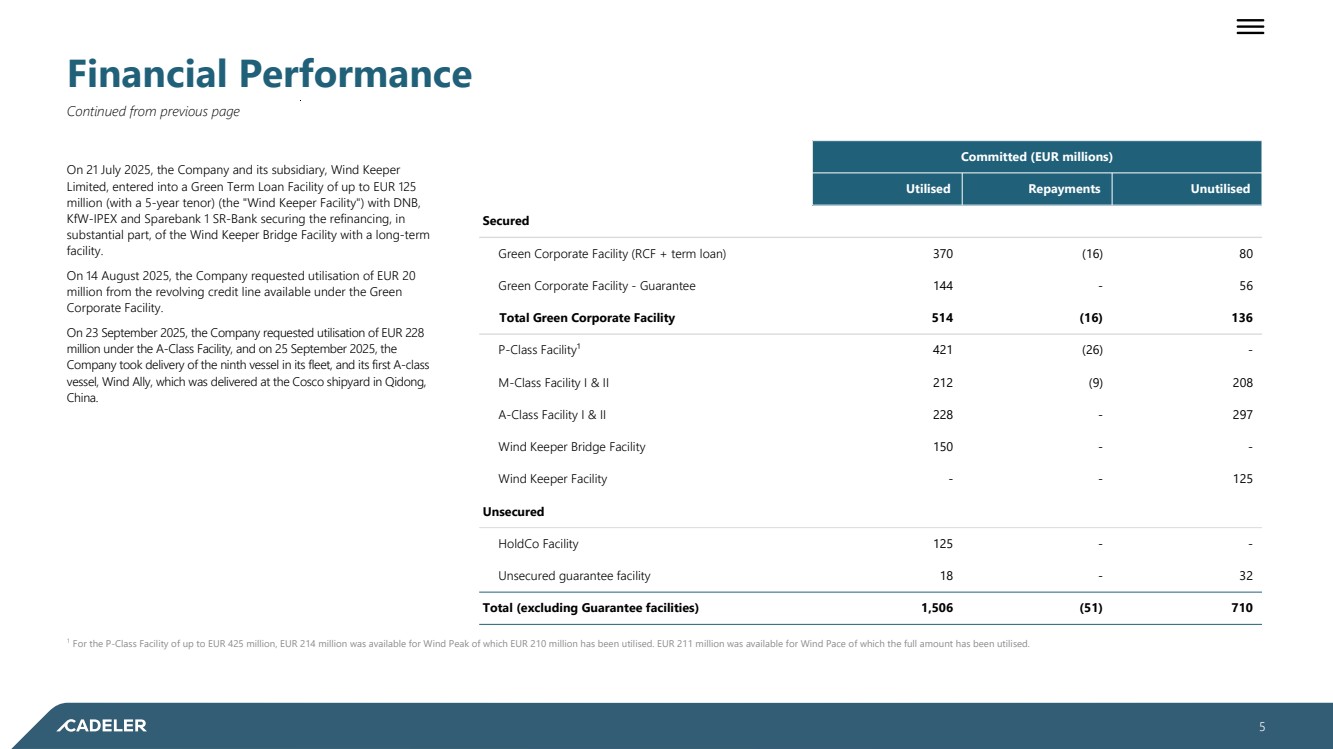
| Financial Performance Continued from previous page On 21 July 2025, the Company and its subsidiary, Wind Keeper Limited, entered into a Green Term Loan Facility of up to EUR 125 million (with a 5-year tenor) (the "Wind Keeper Facility") with DNB, KfW-IPEX and Sparebank 1 SR-Bank securing the refinancing, in substantial part, of the Wind Keeper Bridge Facility with a long-term facility. On 14 August 2025, the Company requested utilisation of EUR 20 million from the revolving credit line available under the Green Corporate Facility. On 23 September 2025, the Company requested utilisation of EUR 228 million under the A-Class Facility, and on 25 September 2025, the Company took delivery of the ninth vessel in its fleet, and its first A-class vessel, Wind Ally, which was delivered at the Cosco shipyard in Qidong, China. Committed (EUR millions) Utilised Repayments Unutilised Secured Green Corporate Facility (RCF + term loan) 370 (16) 80 Green Corporate Facility - Guarantee 144 - 56 Total Green Corporate Facility 514 (16) 136 P-Class Facility¹ 421 (26) - M-Class Facility I & II 212 (9) 208 A-Class Facility I & II 228 - 297 Wind Keeper Bridge Facility 150 - - Wind Keeper Facility - - 125 Unsecured HoldCo Facility 125 - - Unsecured guarantee facility 18 - 32 Total (excluding Guarantee facilities) 1,506 (51) 710 1 For the P-Class Facility of up to EUR 425 million, EUR 214 million was available for Wind Peak of which EUR 210 million has been utilised. EUR 211 million was available for Wind Pace of which the full amount has been utilised. ________________ 5 |
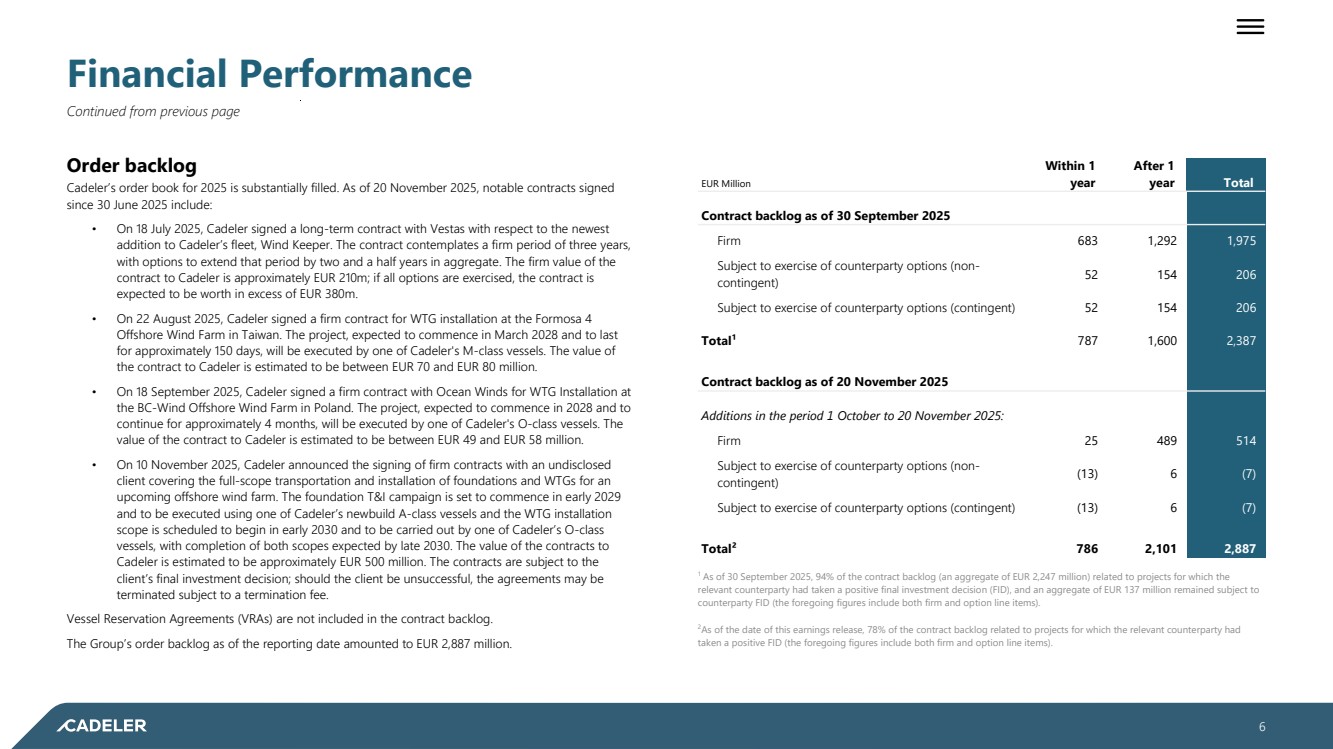
| Financial Performance Continued from previous page Order backlog Cadeler’s order book for 2025 is substantially filled. As of 20 November 2025, notable contracts signed since 30 June 2025 include: • On 18 July 2025, Cadeler signed a long-term contract with Vestas with respect to the newest addition to Cadeler’s fleet, Wind Keeper. The contract contemplates a firm period of three years, with options to extend that period by two and a half years in aggregate. The firm value of the contract to Cadeler is approximately EUR 210m; if all options are exercised, the contract is expected to be worth in excess of EUR 380m. • On 22 August 2025, Cadeler signed a firm contract for WTG installation at the Formosa 4 Offshore Wind Farm in Taiwan. The project, expected to commence in March 2028 and to last for approximately 150 days, will be executed by one of Cadeler's M-class vessels. The value of the contract to Cadeler is estimated to be between EUR 70 and EUR 80 million. • On 18 September 2025, Cadeler signed a firm contract with Ocean Winds for WTG Installation at the BC-Wind Offshore Wind Farm in Poland. The project, expected to commence in 2028 and to continue for approximately 4 months, will be executed by one of Cadeler's O-class vessels. The value of the contract to Cadeler is estimated to be between EUR 49 and EUR 58 million. • On 10 November 2025, Cadeler announced the signing of firm contracts with an undisclosed client covering the full-scope transportation and installation of foundations and WTGs for an upcoming offshore wind farm. The foundation T&I campaign is set to commence in early 2029 and to be executed using one of Cadeler’s newbuild A-class vessels and the WTG installation scope is scheduled to begin in early 2030 and to be carried out by one of Cadeler’s O-class vessels, with completion of both scopes expected by late 2030. The value of the contracts to Cadeler is estimated to be approximately EUR 500 million. The contracts are subject to the client’s final investment decision; should the client be unsuccessful, the agreements may be terminated subject to a termination fee. Vessel Reservation Agreements (VRAs) are not included in the contract backlog. The Group’s order backlog as of the reporting date amounted to EUR 2,887 million. EUR Million Within 1 year After 1 year Total Contract backlog as of 30 September 2025 Firm 683 1,292 1,975 Subject to exercise of counterparty options (non-contingent) 52 154 206 Subject to exercise of counterparty options (contingent) 52 154 206 Total¹ 787 1,600 2,387 Contract backlog as of 20 November 2025 Additions in the period 1 October to 20 November 2025: Firm 25 489 514 Subject to exercise of counterparty options (non-contingent) (13) 6 (7) Subject to exercise of counterparty options (contingent) (13) 6 (7) Total² 786 2,101 2,887 1 As of 30 September 2025, 94% of the contract backlog (an aggregate of EUR 2,247 million) related to projects for which the relevant counterparty had taken a positive final investment decision (FID), and an aggregate of EUR 137 million remained subject to counterparty FID (the foregoing figures include both firm and option line items). 2As of the date of this earnings release, 78% of the contract backlog related to projects for which the relevant counterparty had taken a positive FID (the foregoing figures include both firm and option line items). ________________ 6 |
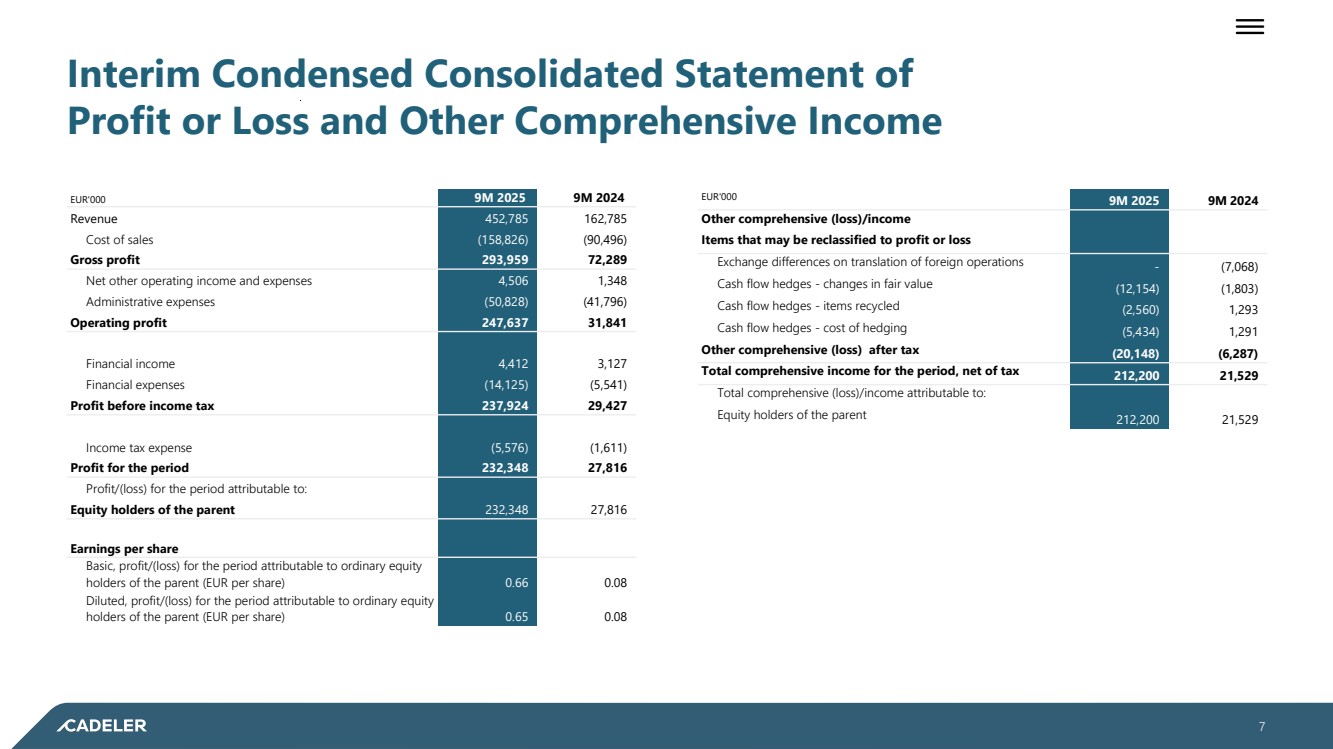
| Interim Condensed Consolidated Statement of Profit or Loss and Other Comprehensive Income EUR'000 9M 2025 9M 2024 Revenue 452,785 162,785 Cost of sales (158,826) (90,496) Gross profit 293,959 72,289 Net other operating income and expenses 4,506 1,348 Administrative expenses (50,828) (41,796) Operating profit 247,637 31,841 Financial income 4,412 3,127 Financial expenses (14,125) (5,541) Profit before income tax 237,924 29,427 Income tax expense (5,576) (1,611) Profit for the period 232,348 27,816 Profit/(loss) for the period attributable to: Equity holders of the parent 232,348 27,816 Earnings per share Basic, profit/(loss) for the period attributable to ordinary equity holders of the parent (EUR per share) 0.66 0.08 Diluted, profit/(loss) for the period attributable to ordinary equity holders of the parent (EUR per share) 0.65 0.08 EUR'000 9M 2025 9M 2024 Other comprehensive (loss)/income Items that may be reclassified to profit or loss Exchange differences on translation of foreign operations - (7,068) Cash flow hedges - changes in fair value (12,154) (1,803) Cash flow hedges - items recycled (2,560) 1,293 Cash flow hedges - cost of hedging (5,434) 1,291 Other comprehensive (loss) after tax (20,148) (6,287) Total comprehensive income for the period, net of tax 212,200 21,529 Total comprehensive (loss)/income attributable to: Equity holders of the parent 212,200 21,529 ________________ 7 |
| Interim Condensed Consolidated Balance Sheet EUR'000 30 September 2025 31 December 2024 Intangible assets 19,283 18,190 Property, plant and equipment 2,626,254 1,712,266 Right-of-use assets 12,428 10,337 Leasehold deposits 1,144 1,014 Derivative assets 1,443 6,593 Total non-current assets 2,660,552 1,748,400 Current assets Inventories 2,871 1,039 Trade and other receivables 127,669 62,986 Contract assets 29,376 37,609 Prepayments 17,400 16,643 Current derivative assets 437 11,875 Cash and cash equivalents 217,757 58,464 Total current assets 395,510 188,616 Total assets 3,056,062 1,937,016 EUR'000 30 September 2025 31 December 2024 Share capital 47,144 47,144 Share premium 1,099,495 1,099,495 Treasury shares (2,999) (1,283) Reserves 9,032 29,180 Retained earnings / (accumulated losses) 293,318 59,358 Total equity 1,445,990 1,233,894 Non-current liabilities Lease liabilities 11,542 9,697 Deferred tax liabilities 13,770 11,972 Deferred revenue 19,085 1,747 Debt to credit institutions 1,180,823 539,854 Derivative liabilities 13,611 16,205 Total non-current liabilities 1,238,831 579,475 Trade and other payables 46,509 43,595 Current provisions — 841 Payables to related parties 201 223 Deferred revenue 72,947 45,590 Current lease liabilities 1,239 1,274 Current income tax liabilities 3,330 752 Current debt to credit institutions 239,416 31,163 Current derivative liabilities 7,599 209 Total current liabilities 371,241 123,647 Total liabilities 1,610,072 703,122 Total equity and liabilities 3,056,062 1,937,016 ________________ 8 |
| Interim Condensed Consolidated Statement of Changes in Equity Reserves EUR'000 Share capital Share premium Treasury shares Hedging reserves Cost of hedging reserves Foreign currency translation reserve (Accumulated losses)/ retained earnings Total 2025 At 1 January 2025 47,144 1,099,495 (1,283) (3,332) 5,131 27,381 59,358 1,233,894 Profit for the period 232,348 232,348 Other comprehensive income for the period (14,714) (5,434) (20,148) Total comprehensive income for the period — — — (14,714) (5,434) — 232,348 212,200 Share-based payments 1,612 1,612 Treasury Shares (1,716) (1,716) End of 30 September 2025 47,144 1,099,495 (2,999) (18,046) (303) 27,381 293,318 1,445,990 2024 At 1 January 2024 41,839 952,858 — (17,938) (3,621) (6,724) (7,373) 959,041 Profit for the period — — — — — — 27,816 27,816 Other comprehensive income for the period — — — (510) 1,291 (7,068) — (6,287) Total comprehensive profit for the period — — — (510) 1,291 (7,068) 27,816 21,529 Capital increase Feb 2024 5,301 149,567 — — — — — 154,868 Costs incurred in connection with Feb 2024 capital increase — (3,014) — — — — — (3,014) Capital increase June 2024 4 84 — — — — — 88 Treasury shares — — (1,283) — — — — (1,283) Share-based payments — — — — — — 1,171 1,171 End of 30 September 2024 47,144 1,099,495 (1,283) (18,448) (2,330) (13,792) 21,614 1,132,400 ________________ 9 |
| Interim Condensed Consolidated Statement of Cash Flows EUR'000 9M 2025 9M 2024 Cash flow from operating activities Profit/(loss) for the period 232,348 27,816 Adjustments of non-cash items 78,858 36,135 Depreciation and amortisation 73,648 32,992 Impairment of fixed assets — — Finance income (1,369) (2,829) Interest expenses 418 327 Finance costs 148 3,271 Income tax expense 3,940 1,606 Fair value change of derivative instruments through profit or loss (486) (403) Share-based payment expenses 1,612 1,171 Changes in working capital (25,692) (20,263) Inventories (1,832) 487 Trade receivables, contract assets, prepayments and other receivables (55,039) (42,565) Trade and other payables (14,455) 7,598 Provisions (841) (2,156) Payables to related parties (22) (11) Deferred tax liabilities 1,798 16,384 Deferred revenue 44,695 Income tax paid (1,363) (1,747) Interest received 1,369 2,829 Net cash provided by operating activities 285,520 44,770 EUR'000 9M 2025 9M 2024 Cash flow from investing activities Additions to property, plant and equipment (930,126) (549,197) Additions to intangible assets (1,231) (69) Leasehold deposits (130) 173 Net cash used in investing activities (931,487) (549,092) Cash flow from financing activities Principal repayment of lease liabilities (1,717) (1,330) Interest paid (33,597) (10,155) Proceeds from issue of share capital - 154,956 Transactional costs on issues of shares - (3,014) Repurchase of treasury shares (1,716) (1,283) Bank charges (148) (3,056) Proceeds from borrowing net of bank fees (of EUR 26.3 million in 9M 2025 and EUR 15.8 million in 9M 2024) 882,589 369,455 Repayment of loan (40,152) (3,125) Net cash provided by financing activities 805,259 502,448 Net increase in cash and cash equivalents 159,292 (1,874) Cash and cash equivalents at beginning of the period 58,464 96,608 Effect of exchange rate on cash and cash equivalents — (2,880) Cash and cash equivalents at end of the period 217,756 91,854 ________________ 10 |
| Forward-Looking Statements The annual report, as referred to in this document, and this earnings release, contain certain forward-looking statements relating to the business, financial performance, and results of the Company and/or the industry in which it operates. Forward-looking statements concern future circumstances and results and other statements that are not historical facts, sometimes identified by the words “believes”, expects”, "predicts", "in-tends", "projects", "plans", "estimates", "aims", "foresees", "anticipates", "targets", and similar expressions. The forward-looking statements contained in the annual report and this earnings release, including assumptions, opinions and views of the Company or cited from third party sources are solely opinions and forecasts which are subject to risks, uncertainties and other factors that may cause actual events to differ materially from any anticipated development. Such factors may for example include a change in the price of raw materials. None of the Company or any of its parent or subsidiaries undertakings or any such person's officers or employees provides any assurance that the assumptions underlying such forward-looking statements are free from errors nor does any of them accept any responsibility for the future accuracy of the opinions expressed in the annual report or the actual occurrence of the forecasted developments. The Company assumes no obligation, except as required by law, to update any forward-looking statements or to conform these forward-looking statements to its actual results. The annual report and this earnings release may contain information obtained from third parties. You are advised that such third-party information has not been prepared specifically for inclusion in the annual report or this earnings release and the Company has not undertaken any independent investigation to confirm the accuracy or completeness of such information. Several other factors could cause the actual results, performance or achievements of the Company to be materially different from any future results, performance or achievements that may be expressed or implied by statements and information in the annual report or this earnings release. Should any risks or uncertainties materialise, or should underlying assumptions prove incorrect, actual results may vary materially from those described in the annual report or this earnings release. No representation or warranty (express or implied) is made as to, and no reliance should be placed on, any information, including projections, estimates, targets and opinions, contained herein, and no liability whatsoever is accepted as to any errors, omissions or misstatements contained herein, and, accordingly, neither the Company, not any of its subsidiaries or shareholders or any officers, directors, board members or employees accept any liability whatsoever arising directly or indirectly from the use of the annual report or this earnings release. ________________ 11 |
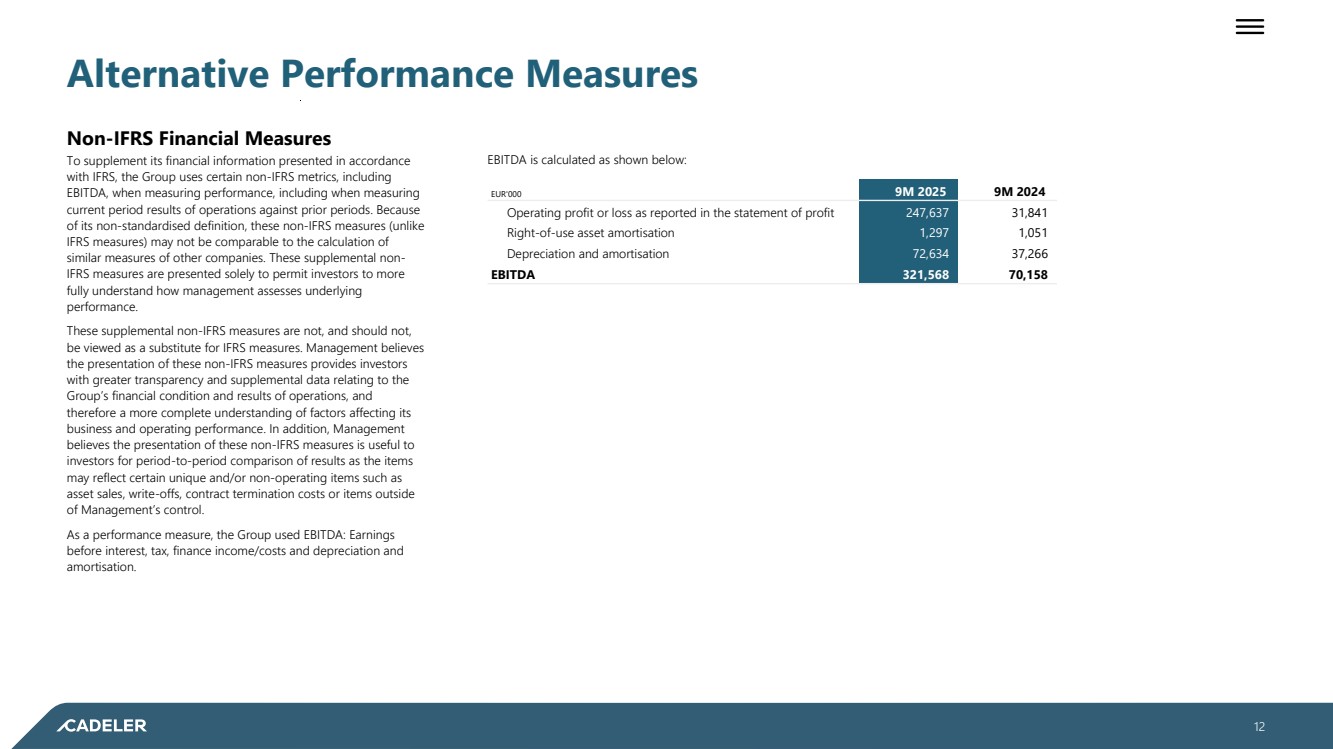
| Alternative Performance Measures Non-IFRS Financial Measures To supplement its financial information presented in accordance with IFRS, the Group uses certain non-IFRS metrics, including EBITDA, when measuring performance, including when measuring current period results of operations against prior periods. Because of its non-standardised definition, these non-IFRS measures (unlike IFRS measures) may not be comparable to the calculation of similar measures of other companies. These supplemental non-IFRS measures are presented solely to permit investors to more fully understand how management assesses underlying performance. These supplemental non-IFRS measures are not, and should not, be viewed as a substitute for IFRS measures. Management believes the presentation of these non-IFRS measures provides investors with greater transparency and supplemental data relating to the Group’s financial condition and results of operations, and therefore a more complete understanding of factors affecting its business and operating performance. In addition, Management believes the presentation of these non-IFRS measures is useful to investors for period-to-period comparison of results as the items may reflect certain unique and/or non-operating items such as asset sales, write-offs, contract termination costs or items outside of Management’s control. As a performance measure, the Group used EBITDA: Earnings before interest, tax, finance income/costs and depreciation and amortisation. EBITDA is calculated as shown below: EUR'000 9M 2025 9M 2024 Operating profit or loss as reported in the statement of profit 247,637 31,841 Right-of-use asset amortisation 1,297 1,051 Depreciation and amortisation 72,634 37,266 EBITDA 321,568 70,158 ________________ 12 |
| ________________ 13 Kalvebod Brygge 43 DK–1560 Copenhagen V Denmark +45 3246 3100 www.cadeler.com |