EXHIBIT 99.1
Published on November 20, 2025
| Investor Presentation Q3 2025 1 July – 30 September 2025 Cadeler A/S. Incorporated in Denmark. Registration Number (CVR no.): 3118 0503 Kalvebod Brygge 43, DK-1560 Copenhagen V, Denmark |

| Disclaimer | 2 This presentation (this “Presentation") has been prepared by Cadeler A/S (the “Company") exclusively for information purposes and may not be reproduced or redistributed, in whole or in part, by any other person. Forward-looking statements This Presentation contains certain forward-looking statements within the meaning of Section 27A of the U.S. Securities Act of 1933 and Section 21E of the U.S. Exchange Act of 1934, each as amended. All statements other than statements of historical fact included in this Presentation are forward-looking statements, including those regarding future guidance, such as those related to anticipated revenue, EBITDA and Adjusted EBITDA. Forward looking statements involve risks, uncertainties and assumptions, and actual results may differ materially from any future results expressed or implied by such forward-looking statements. Words such as "anticipate," "believe ," "continue," "could,“ "estimate," "expect," "intend," "may," "might,“ “forecast”, “on track,” "plan," “possible,” “potential,” “predict,” "project," "should," "would," "shall," “target,” "will" and similar expressions are intended to assist in identifying forward looking statements. Although the Company believes that the expectations reflected in such forward-looking statements are reasonable, there can be no assurance that such expectations will prove to be correct. All forward-looking statements included in this Presentation speak only as of the date of this Presentation and the Company undertakes no obligation to revise or update any forward-looking statement for any reason, except as required by law. Risks and uncertainties include, but are not limited to, those detailed in the Company’s most recent annual report on Form 20-F and in its other filings with the U.S. Securities and Exchange Commission. You should consider these risks and uncertainties when evaluating the Company and its prospects. None of the Company or any of its parent or subsidiary undertakings or any of such persons’ directors, officers or employees provides any assurance that the assumptions reflected in the forward-looking statements included in this Presentation are free from error nor does any of them accept any responsibility for the future accuracy of the opinions expressed in this Presentation or the actual occurrence of the forecasted developments. Non-IFRS performance measures This Presentation includes certain Non-IFRS performance measures, including EBITDA, Adjusted EBITDA, and contract backlog. Such Non-IFRS performance measures are presented herein as the Company believes that such measures provide investors with additional useful information and a means of understanding how the Company’s management evaluates the Company’s operating performance. Such performance measures should not, however, be considered in isolation from, as substitutes for, or as superior to financial measures prepared in accordance with IFRS. Moreover, other companies may define Non-IFRS measures differently, which limits the usefulness of these measures for the purpose of any comparison with such other companies. Industry and market data Information contained in this Presentation concerning the Company’s industry and the market in which it operates, including general expectations about its industry, market position, market opportunity and market size, is based on data from various sources including internal data and estimates as well as third party sources such as independent industry publications, government publications, and reports by market research firms or other published independent sources. You are cautioned not to give undue weight to such information. You are further advised that any third-party information referred to in this Presentation has not been prepared specifically for inclusion in this Presentation and while the Company believes such information to be generally reliable, it has not undertaken any independent investigation to confirm the accuracy or completeness of such information or to verify that more recent information is not available. |
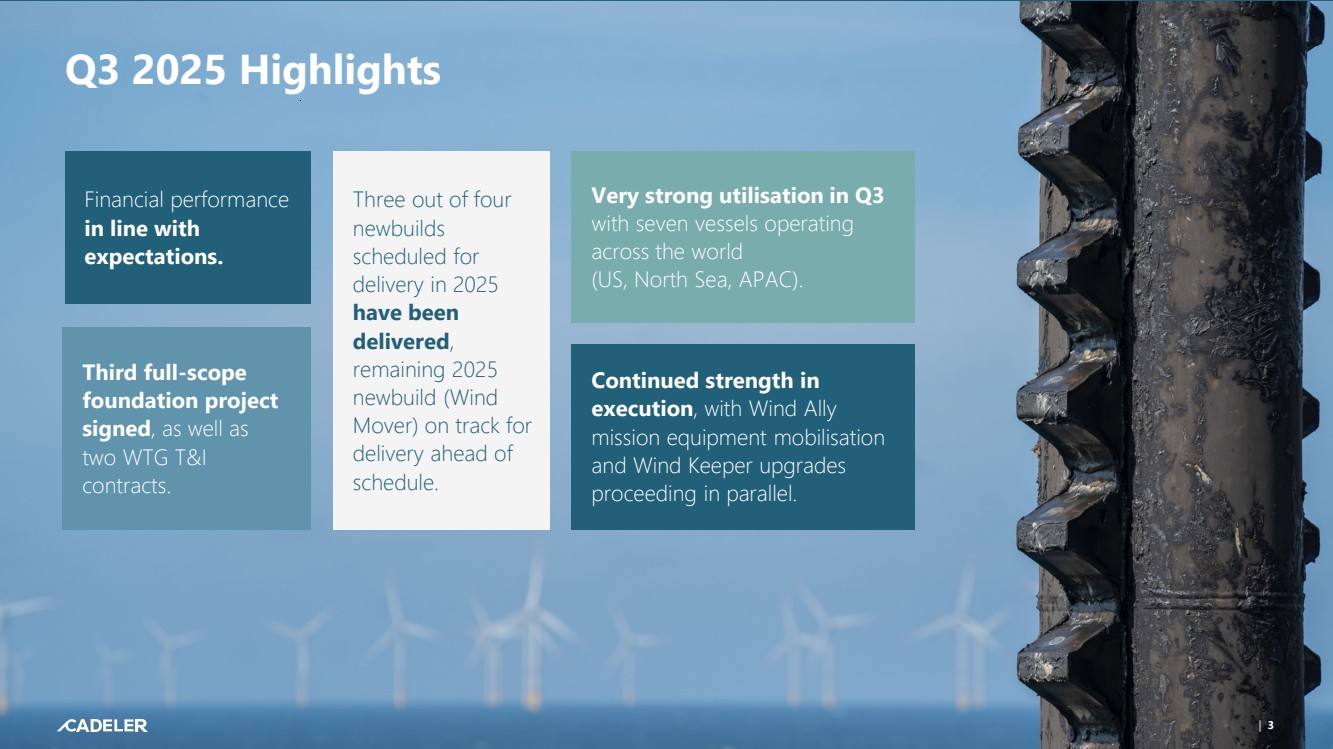
| aa Q3 2025 Highlights Financial performance in line with expectations. Three out of four newbuilds scheduled for delivery in 2025 have been delivered, remaining 2025 newbuild (Wind Mover) on track for delivery ahead of schedule. Very strong utilisation in Q3 with seven vessels operating across the world (US, North Sea, APAC). Continued strength in execution, with Wind Ally mission equipment mobilisation and Wind Keeper upgrades proceeding in parallel. | 3 Third full-scope foundation project signed, as well as two WTG T&I contracts. |
| Commercial highlights Q3 2025 | 4 |
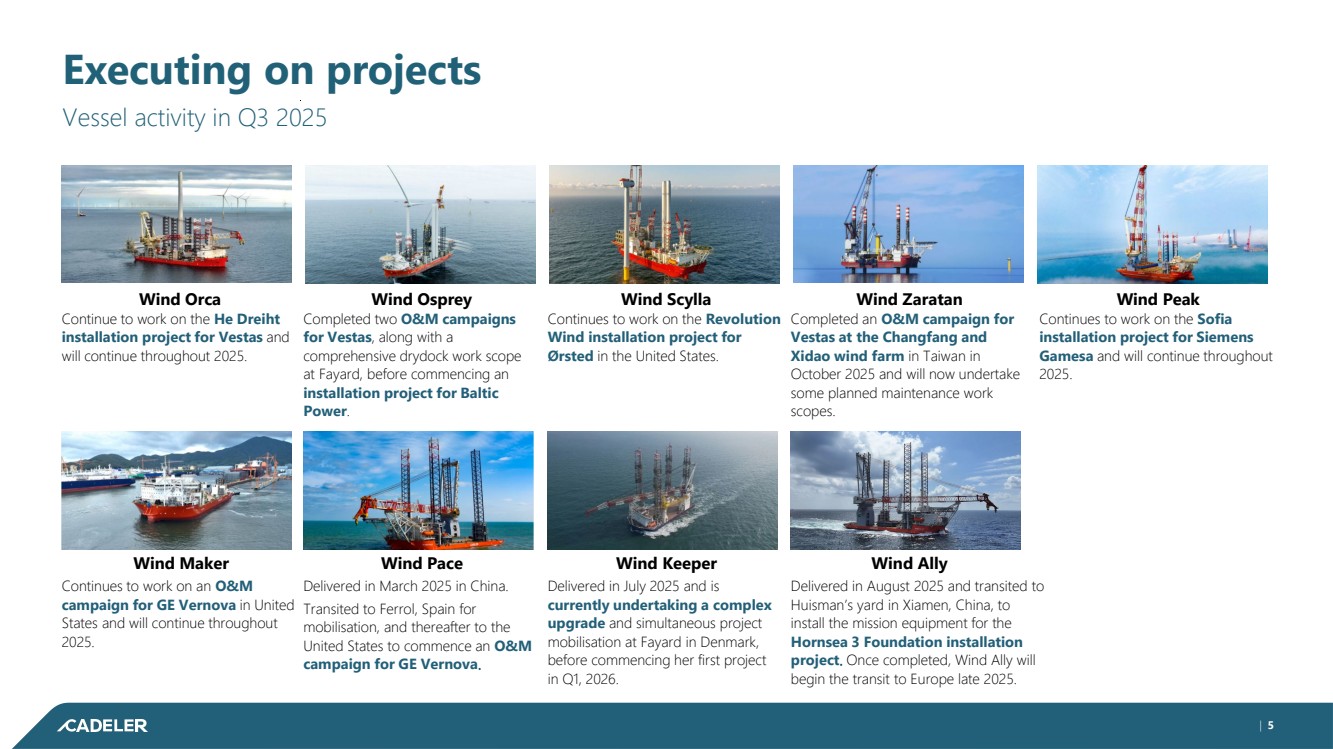
| Executing on projects Vessel activity in Q3 2025 Wind Orca Wind Osprey Wind Scylla Wind Zaratan Continue to work on the He Dreiht installation project for Vestas and will continue throughout 2025. Completed two O&M campaigns for Vestas, along with a comprehensive drydock work scope at Fayard, before commencing an installation project for Baltic Power. Continues to work on the Revolution Wind installation project for Ørsted in the United States. Completed an O&M campaign for Vestas at the Changfang and Xidao wind farm in Taiwan in October 2025 and will now undertake some planned maintenance work scopes. Wind Peak Wind Maker Wind Pace Delivered in March 2025 in China. Transited to Ferrol, Spain for mobilisation, and thereafter to the United States to commence an O&M campaign for GE Vernova. Wind Keeper Delivered in July 2025 and is currently undertaking a complex upgrade and simultaneous project mobilisation at Fayard in Denmark, before commencing her first project in Q1, 2026. Continues to work on an O&M campaign for GE Vernova in United States and will continue throughout 2025. Continues to work on the Sofia installation project for Siemens Gamesa and will continue throughout 2025. Wind Ally Delivered in August 2025 and transited to Huisman’s yard in Xiamen, China, to install the mission equipment for the Hornsea 3 Foundation installation project. Once completed, Wind Ally will begin the transit to Europe late 2025. | 5 |
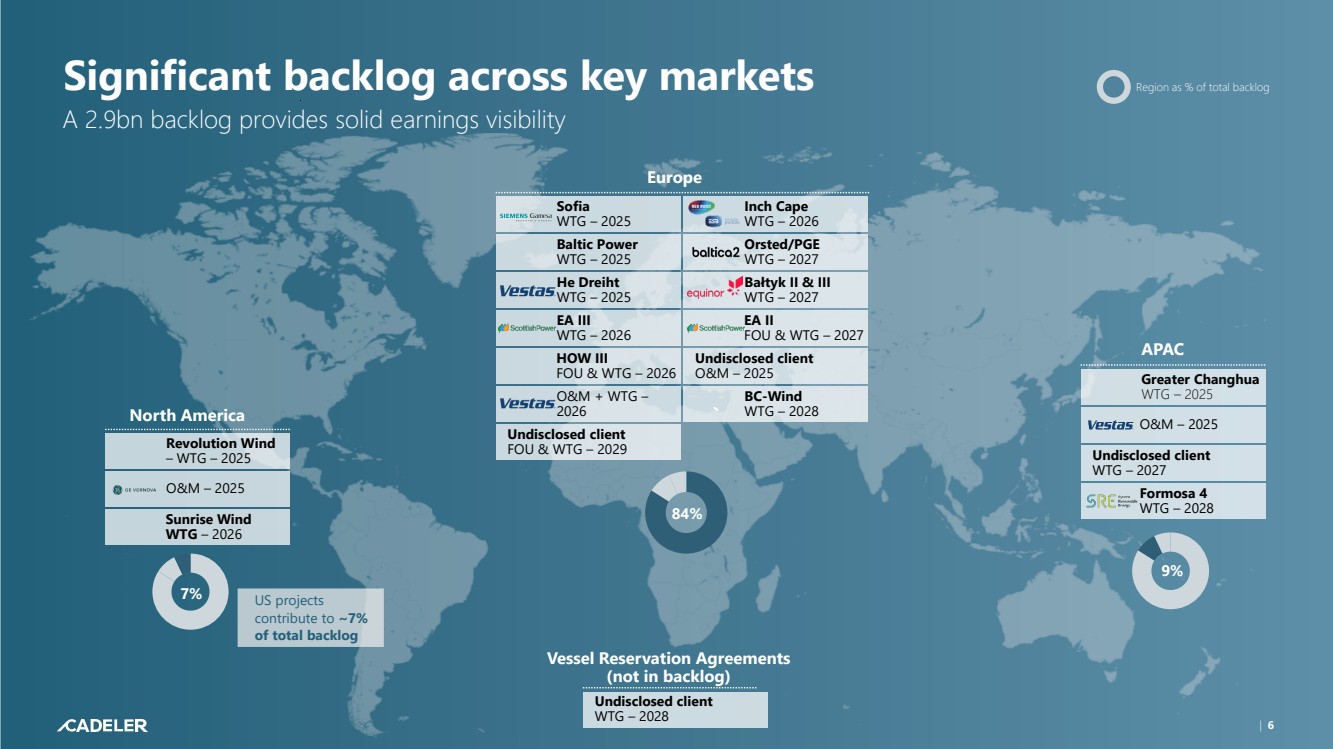
| Significant backlog across key markets A 2.9bn backlog provides solid earnings visibility Europe APAC Undisclosed client WTG – 2027 North America Revolution Wind – WTG – 2025 He Dreiht WTG – 2025 Baltic Power WTG – 2025 Sofia WTG – 2025 EA III WTG – 2026 HOW III FOU & WTG – 2026 Orsted/PGE WTG – 2027 Inch Cape WTG – 2026 EA II FOU & WTG – 2027 Bałtyk II & III WTG – 2027 Greater Changhua WTG – 2025 O&M – 2025 Sunrise Wind WTG – 2026 Undisclosed client O&M – 2025 O&M – 2025 O&M + WTG – 2026 Formosa 4 WTG – 2028 US projects contribute to ~7% of total backlog BC-Wind WTG – 2028 Undisclosed client FOU & WTG – 2029 Vessel Reservation Agreements (not in backlog) Undisclosed client WTG – 2028 Region as % of total backlog | 6 84% 9% 7% |
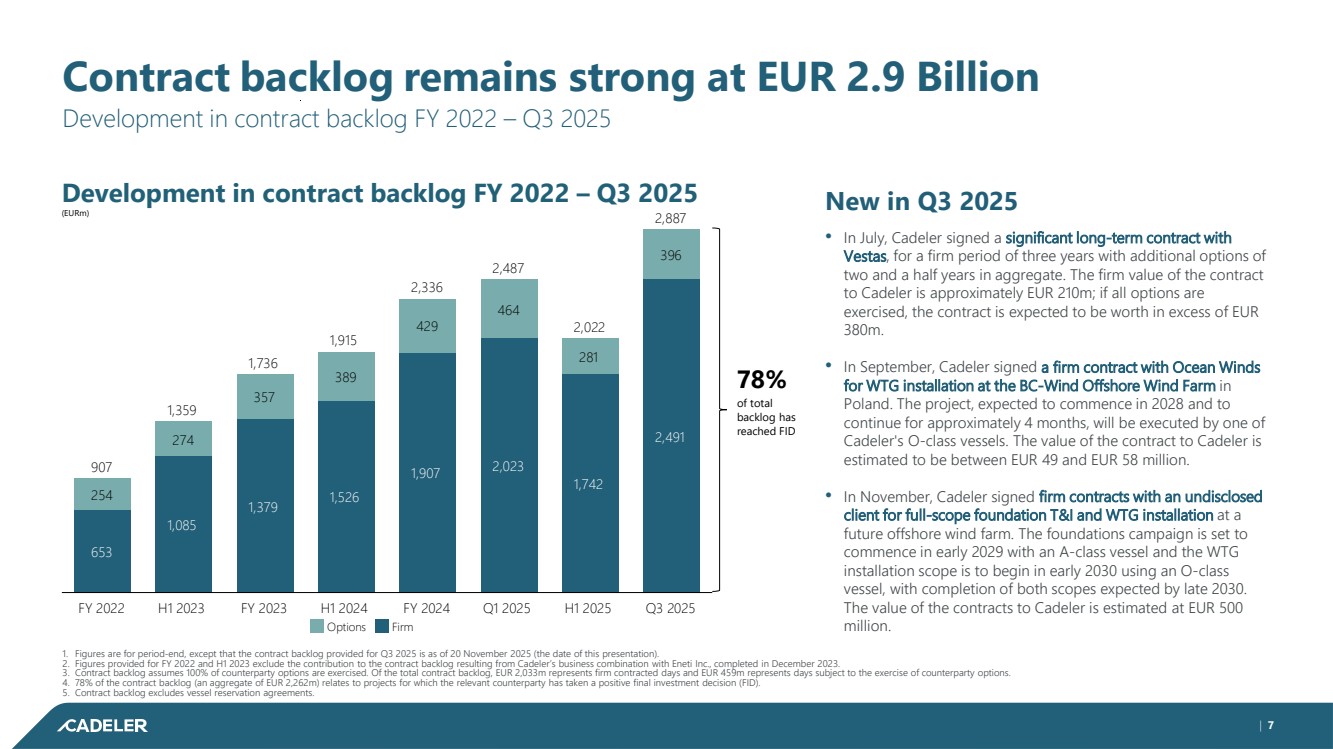
| Contract backlog remains strong at EUR 2.9 Billion Development in contract backlog FY 2022 – Q3 2025 | 7 1. Figures are for period-end, except that the contract backlog provided for Q3 2025 is as of 20 November 2025 (the date of this presentation). 2. Figures provided for FY 2022 and H1 2023 exclude the contribution to the contract backlog resulting from Cadeler’s business combination with Eneti Inc., completed in December 2023. 3. Contract backlog assumes 100% of counterparty options are exercised. Of the total contract backlog, EUR 2,033m represents firm contracted days and EUR 459m represents days subject to the exercise of counterparty options. 4. 78% of the contract backlog (an aggregate of EUR 2,262m) relates to projects for which the relevant counterparty has taken a positive final investment decision (FID). 5. Contract backlog excludes vessel reservation agreements. New in Q3 2025 • In July, Cadeler signed a significant long-term contract with Vestas, for a firm period of three years with additional options of two and a half years in aggregate. The firm value of the contract to Cadeler is approximately EUR 210m; if all options are exercised, the contract is expected to be worth in excess of EUR 380m. • In September, Cadeler signed a firm contract with Ocean Winds for WTG installation at the BC-Wind Offshore Wind Farm in Poland. The project, expected to commence in 2028 and to continue for approximately 4 months, will be executed by one of Cadeler's O-class vessels. The value of the contract to Cadeler is estimated to be between EUR 49 and EUR 58 million. • In November, Cadeler signed firm contracts with an undisclosed client for full-scope foundation T&I and WTG installation at a future offshore wind farm. The foundations campaign is set to commence in early 2029 with an A-class vessel and the WTG installation scope is to begin in early 2030 using an O-class vessel, with completion of both scopes expected by late 2030. The value of the contracts to Cadeler is estimated at EUR 500 million. Development in contract backlog FY 2022 – Q3 2025 (EURm) FY 2022 H1 2023 FY 2023 H1 2024 FY 2024 Q1 2025 H1 2025 Q3 2025 907 1,359 1,736 1,915 2,336 2,487 2,022 2,887 396 653 254 1,085 274 1,379 357 1,526 389 1,907 429 2,023 464 1,742 281 2,491 78% of total backlog has reached FID Options Firm | 7 |
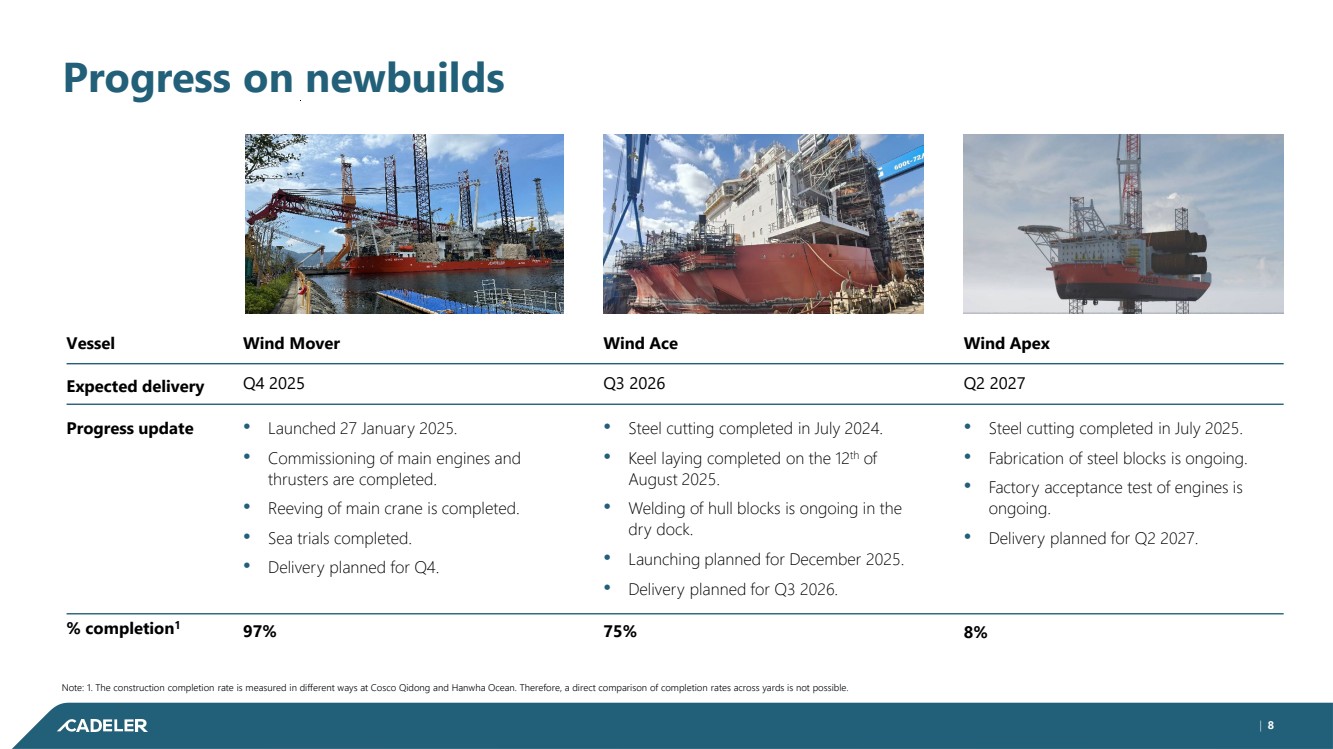
| Progress on newbuilds | 8 Vessel Progress update Expected delivery % completion1 • Steel cutting completed in July 2024. • Keel laying completed on the 12th of August 2025. • Welding of hull blocks is ongoing in the dry dock. • Launching planned for December 2025. • Delivery planned for Q3 2026. 75% Q3 2026 Wind Ace • Steel cutting completed in July 2025. • Fabrication of steel blocks is ongoing. • Factory acceptance test of engines is ongoing. • Delivery planned for Q2 2027. Q2 2027 Wind Apex 8% Wind Mover Q4 2025 • Launched 27 January 2025. • Commissioning of main engines and thrusters are completed. • Reeving of main crane is completed. • Sea trials completed. • Delivery planned for Q4. 97% Note: 1. The construction completion rate is measured in different ways at Cosco Qidong and Hanwha Ocean. Therefore, a direct comparison of completion rates across yards is not possible. | 8 |
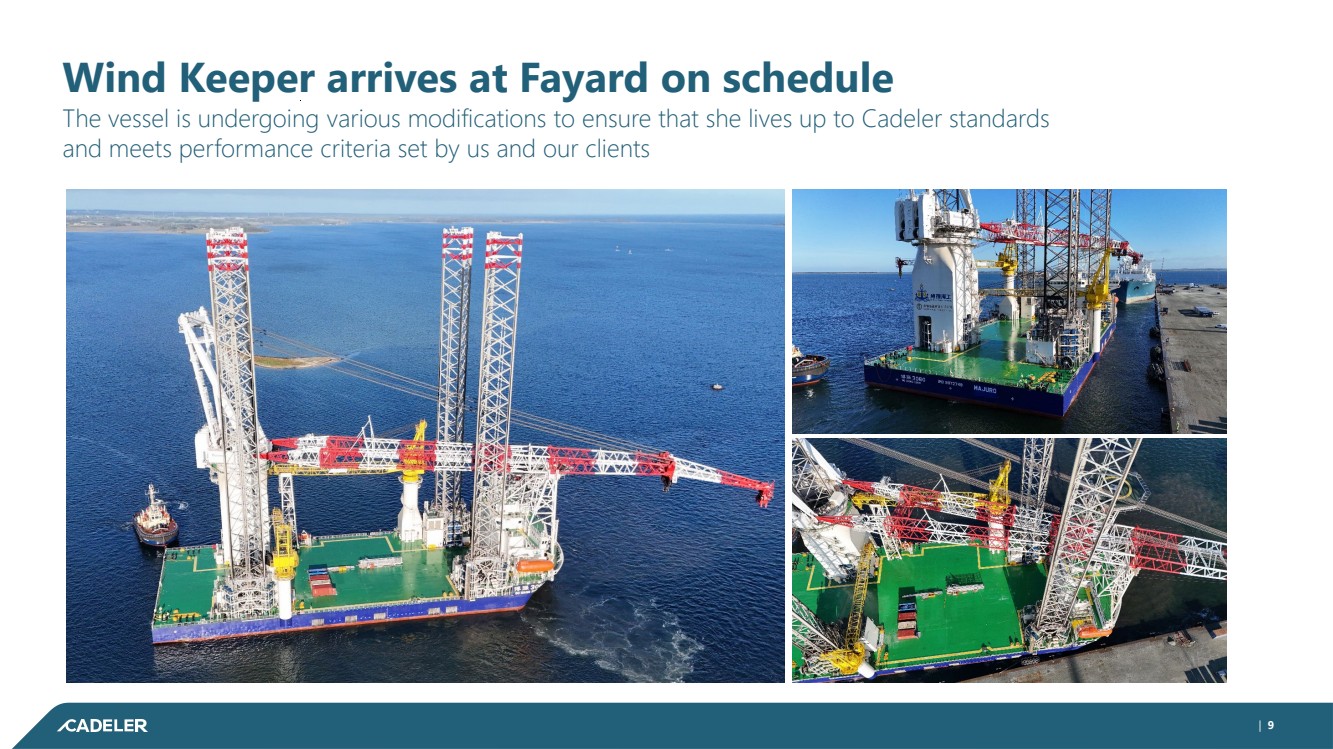
| Wind Keeper arrives at Fayard on schedule The vessel is undergoing various modifications to ensure that she lives up to Cadeler standards and meets performance criteria set by us and our clients | 9 |
| Financial highlights Q3 2025 | 10 |
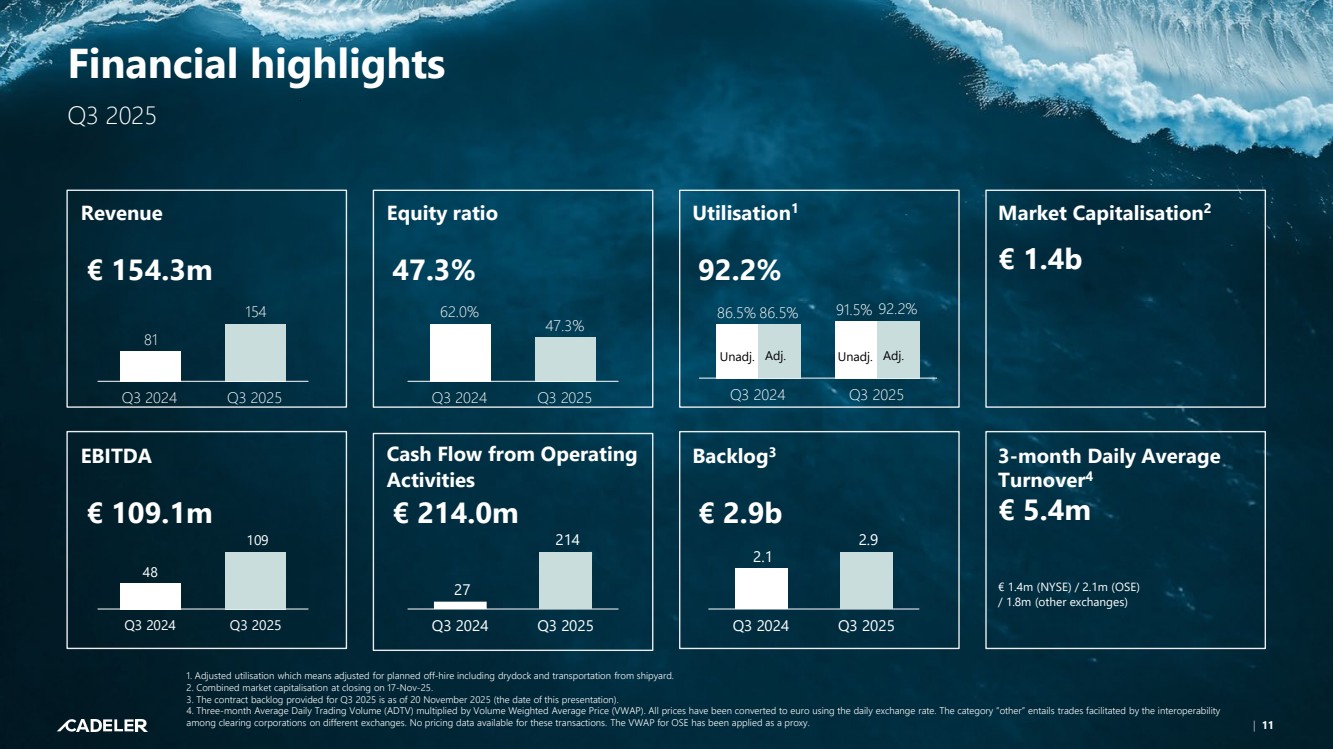
| Financial highlights Q3 2025 Market Capitalisation Revenue 2 Equity ratio Utilisation1 3-month Daily Average Turnover4 EBITDA Cash Flow from Operating Activities Backlog3 € 1.4b € 5.4m € 1.4m (NYSE) / 2.1m (OSE) / 1.8m (other exchanges) 1. Adjusted utilisation which means adjusted for planned off-hire including drydock and transportation from shipyard. 2. Combined market capitalisation at closing on 17-Nov-25. 3. The contract backlog provided for Q3 2025 is as of 20 November 2025 (the date of this presentation). 4. Three-month Average Daily Trading Volume (ADTV) multiplied by Volume Weighted Average Price (VWAP). All prices have been converted to euro using the daily exchange rate. The category “other” entails trades facilitated by the interoperability among clearing corporations on different exchanges. No pricing data available for these transactions. The VWAP for OSE has been applied as a proxy. € 154.3m 47.3% 92.2% Q3 2024 Q3 2025 86.5% 86.5% 91.5% 92.2% Unadj. Adj. € 109.1m Q3 2024 Q3 2025 48 109 € 214.0m Q3 2024 Q3 2025 27 214 Q3 2024 Q3 2025 2.1 2.9 € 2.9b Q3 2024 Q3 2025 62.0% 47.3% Q3 2024 Q3 2025 81 154 Unadj. Adj. | 11 |
| Key takeaways • Revenue increased by EUR 74 m compared to Q3 2024, with both utilisation and adjusted utilisation at 92% in Q3 2025 (up from 86% in Q3 2024). • Since utilisation for the comparable periods is equal, the revenue increase is mainly due to addition of three vessels in operation: Wind Maker, Wind Peak and Wind Pace. • Cost of sales increased primarily driven by newly delivered vessels Wind Peak, Wind Maker and Wind Pace becoming part of the Group’s fleet and not yet delivered in Q3 2024**. • SG&A costs higher due to increase in onshore staff. Many of which related to more vessels on water and their needed support to both ongoing operations and new projects. • EBITDA increase is driven by the increase in revenue as explained above. | 12 Note: Financials are unaudited. * OPEX/day based on crewing costs, technical costs and insurance. ** Wind Peak was delivered mid Q3 2024. Consolidated P&L for Q3 2025 EUR ‘000 Revenue Cost of sales Gross profit SG&A and other expenses Operating profit Finance net Profit before income tax Income tax expense Profit after tax EBITDA Vessel OPEX (EUR per day)* No. of vessels Q3 2025 154,250 (58,592) 95,658 (15,975) 79,683 (12,884) 66,799 (2,184) 64,615 109,052 38,398 8 Q3 2024 80,567 (33,098) 47,469 (14,265) 33,204 (5,047) 28,157 (494) 27,663 48,431 35,927 5 |

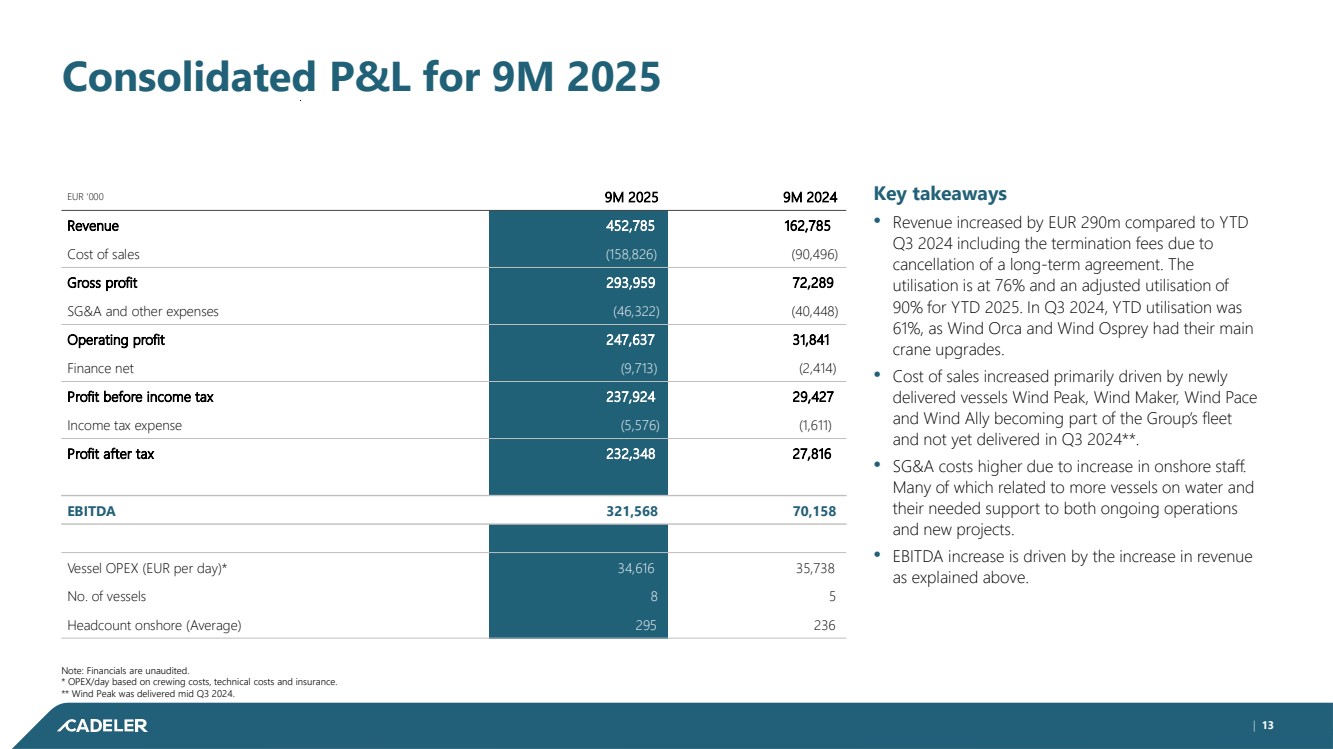
| Consolidated P&L for 9M 2025 Key takeaways • Revenue increased by EUR 290m compared to YTD Q3 2024 including the termination fees due to cancellation of a long-term agreement. The utilisation is at 76% and an adjusted utilisation of 90% for YTD 2025. In Q3 2024, YTD utilisation was 61%, as Wind Orca and Wind Osprey had their main crane upgrades. • Cost of sales increased primarily driven by newly delivered vessels Wind Peak, Wind Maker, Wind Pace and Wind Ally becoming part of the Group’s fleet and not yet delivered in Q3 2024**. • SG&A costs higher due to increase in onshore staff. Many of which related to more vessels on water and their needed support to both ongoing operations and new projects. • EBITDA increase is driven by the increase in revenue as explained above. | 13 Note: Financials are unaudited. * OPEX/day based on crewing costs, technical costs and insurance. ** Wind Peak was delivered mid Q3 2024. EUR ‘000 Revenue Cost of sales Gross profit SG&A and other expenses Operating profit Finance net Profit before income tax Income tax expense Profit after tax EBITDA Vessel OPEX (EUR per day)* No. of vessels Headcount onshore (Average) 9M 2025 452,785 (158,826) 293,959 (46,322) 247,637 (9,713) 237,924 (5,576) 232,348 321,568 34,616 8 295 9M 2024 162,785 (90,496) 72,289 (40,448) 31,841 (2,414) 29,427 (1,611) 27,816 70,158 35,738 5 236 |
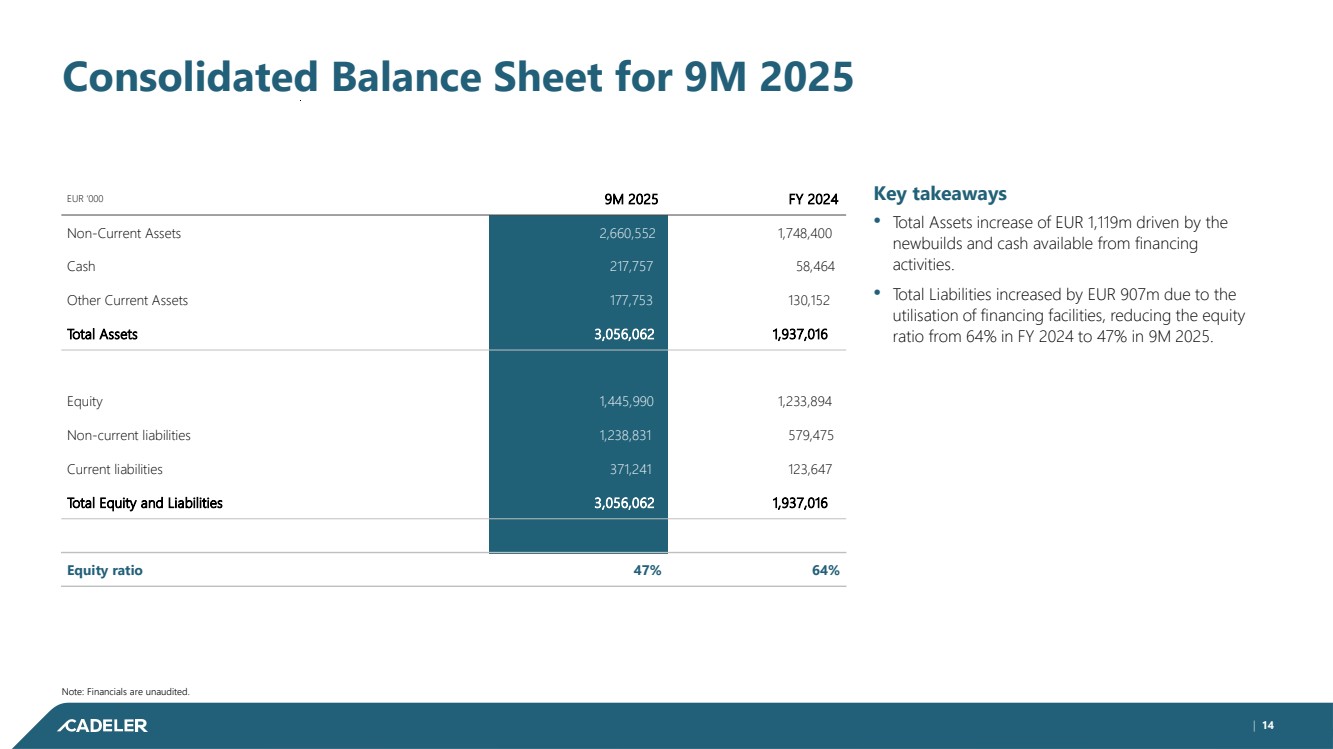
| Key takeaways • Total Assets increase of EUR 1,119m driven by the newbuilds and cash available from financing activities. • Total Liabilities increased by EUR 907m due to the utilisation of financing facilities, reducing the equity ratio from 64% in FY 2024 to 47% in 9M 2025. | 14 Note: Financials are unaudited. Consolidated Balance Sheet for 9M 2025 EUR ‘000 Non-Current Assets Cash Other Current Assets Total Assets Equity Non-current liabilities Current liabilities Total Equity and Liabilities Equity ratio 9M 2025 2,660,552 217,757 177,753 3,056,062 1,445,990 1,238,831 371,241 3,056,062 47% FY 2024 1,748,400 58,464 130,152 1,937,016 1,233,894 579,475 123,647 1,937,016 64% |
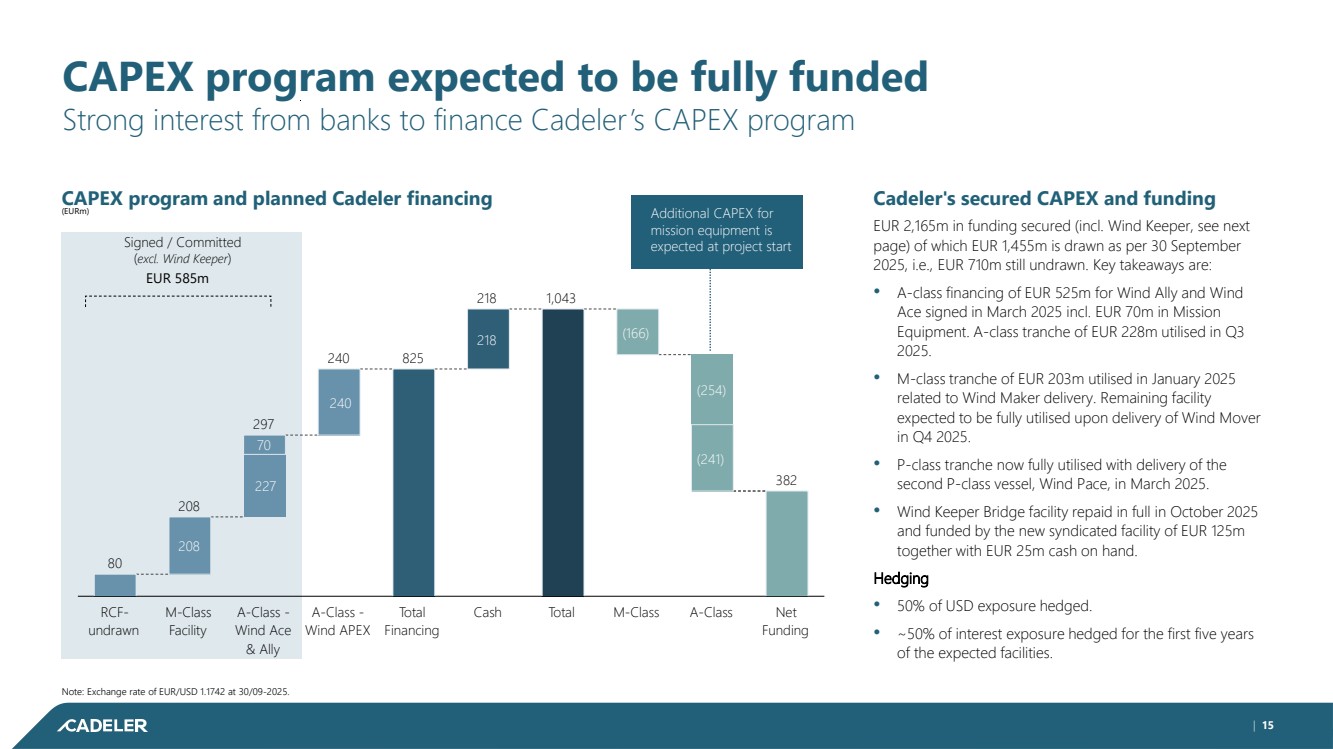
| | 15 CAPEX program expected to be fully funded Strong interest from banks to finance Cadeler’s CAPEX program Cadeler's secured CAPEX and funding EUR 2,165m in funding secured (incl. Wind Keeper, see next page) of which EUR 1,455m is drawn as per 30 September 2025, i.e., EUR 710m still undrawn. Key takeaways are: • A-class financing of EUR 525m for Wind Ally and Wind Ace signed in March 2025 incl. EUR 70m in Mission Equipment. A-class tranche of EUR 228m utilised in Q3 2025. • M-class tranche of EUR 203m utilised in January 2025 related to Wind Maker delivery. Remaining facility expected to be fully utilised upon delivery of Wind Mover in Q4 2025. • P-class tranche now fully utilised with delivery of the second P-class vessel, Wind Pace, in March 2025. • Wind Keeper Bridge facility repaid in full in October 2025 and funded by the new syndicated facility of EUR 125m together with EUR 25m cash on hand. Hedging • 50% of USD exposure hedged. • ~50% of interest exposure hedged for the first five years of the expected facilities. CAPEX program and planned Cadeler financing (EURm) Note: Exchange rate of EUR/USD 1.1742 at 30/09-2025. Signed / Committed (excl. Wind Keeper) M-Class Cash Total A-Class Facility M-Class Net Funding RCF-undrawn Total Financing A-Class - Wind Ace & Ally A-Class - Wind APEX 80 208 297 240 825 218 1,043 382 208 227 70 240 218 (166) (254) (241) EUR 585m Additional CAPEX for mission equipment is expected at project start |
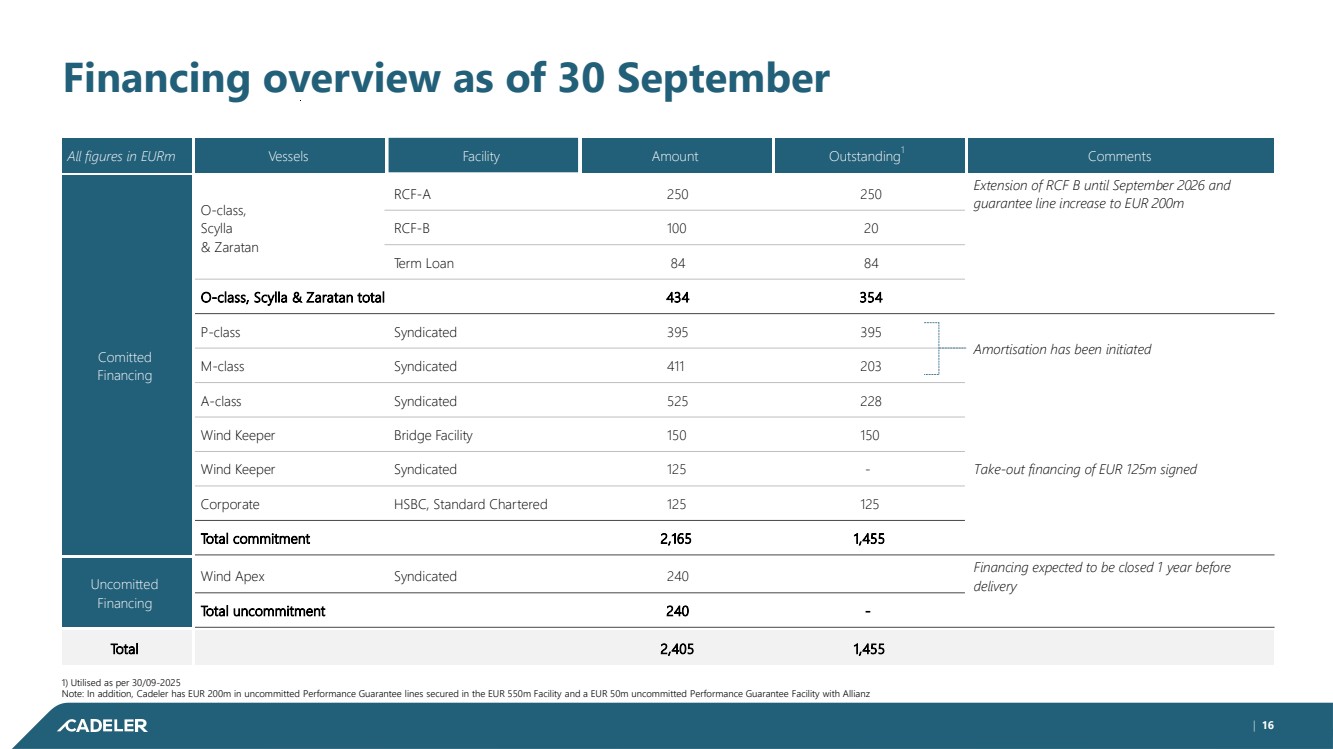
| | 16 Financing overview as of 30 September 1) Utilised as per 30/09-2025 Note: In addition, Cadeler has EUR 200m in uncommitted Performance Guarantee lines secured in the EUR 550m Facility and a EUR 50m uncommitted Performance Guarantee Facility with Allianz All figures in EURm Comitted Financing Uncomitted Financing Total Vessels O-class, Scylla & Zaratan O-class, Scylla & Zaratan total P-class M-class A-class Wind Keeper Wind Keeper Corporate Total commitment Wind Apex Total uncommitment Facility RCF-A RCF-B Term Loan Syndicated Syndicated Syndicated Bridge Facility Syndicated HSBC, Standard Chartered Syndicated Amount 250 100 84 434 395 411 525 150 125 125 2,165 240 240 2,405 Outstanding1 250 20 84 354 395 203 228 150 - 125 1,455 - 1,455 Comments Extension of RCF B until September 2026 and guarantee line increase to EUR 200m Amortisation has been initiated Take-out financing of EUR 125m signed Financing expected to be closed 1 year before delivery |
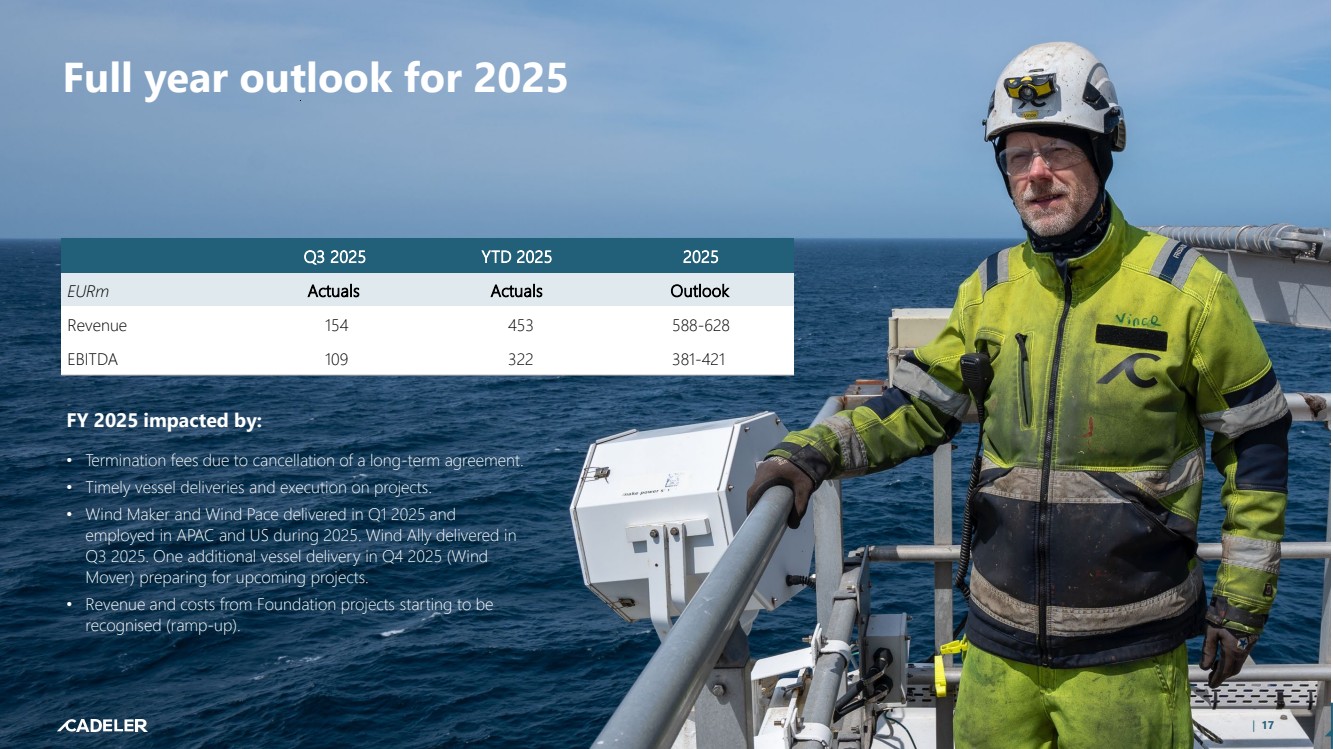
| Full year outlook for 2025 FY 2025 impacted by: • Termination fees due to cancellation of a long-term agreement. • Timely vessel deliveries and execution on projects. • Wind Maker and Wind Pace delivered in Q1 2025 and employed in APAC and US during 2025. Wind Ally delivered in Q3 2025. One additional vessel delivery in Q4 2025 (Wind Mover) preparing for upcoming projects. • Revenue and costs from Foundation projects starting to be recognised (ramp-up). EURm Revenue EBITDA Q3 2025 Actuals 154 109 YTD 2025 Actuals 453 322 2025 Outlook 588-628 381-421 | 17 |
| Commercial outlook | 18 |
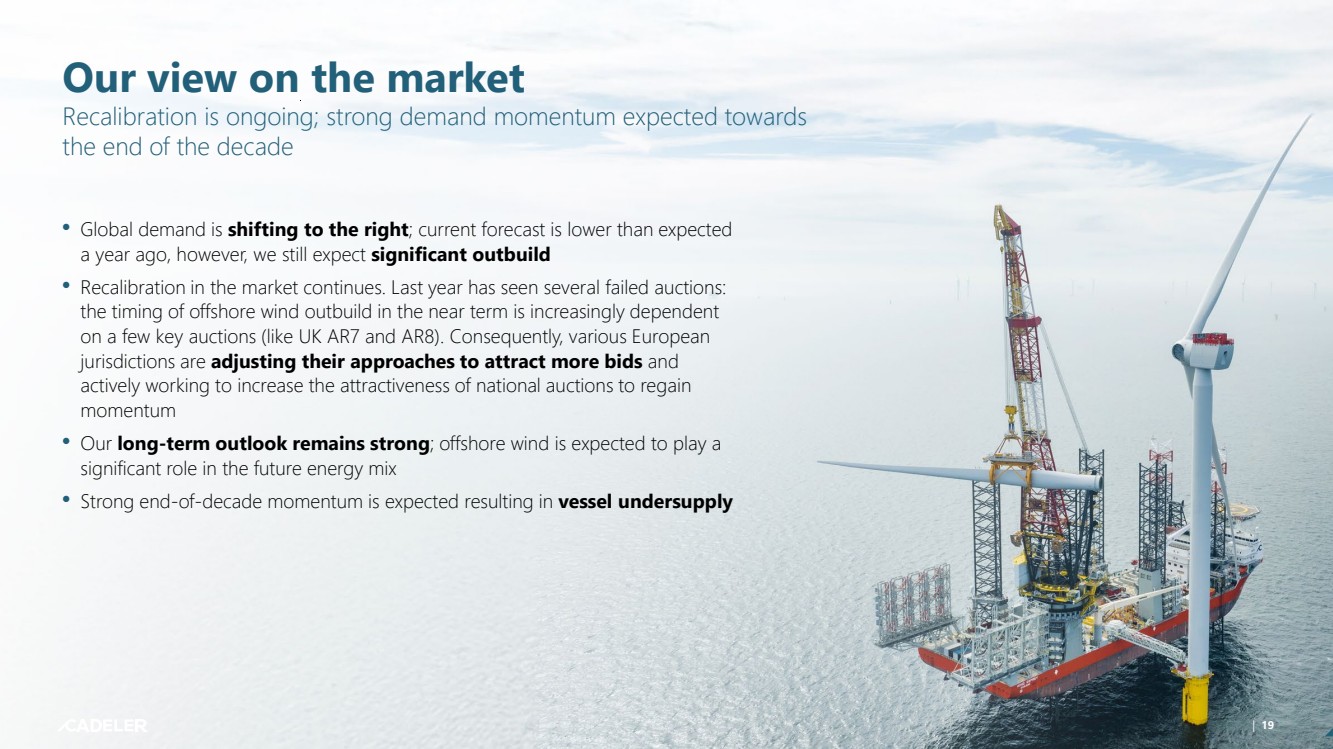
| Our view on the market Recalibration is ongoing; strong demand momentum expected towards the end of the decade • Global demand is shifting to the right; current forecast is lower than expected a year ago, however, we still expect significant outbuild • Recalibration in the market continues. Last year has seen several failed auctions: the timing of offshore wind outbuild in the near term is increasingly dependent on a few key auctions (like UK AR7 and AR8). Consequently, various European jurisdictions are adjusting their approaches to attract more bids and actively working to increase the attractiveness of national auctions to regain momentum • Our long-term outlook remains strong; offshore wind is expected to play a significant role in the future energy mix • Strong end-of-decade momentum is expected resulting in vessel undersupply | 19 |
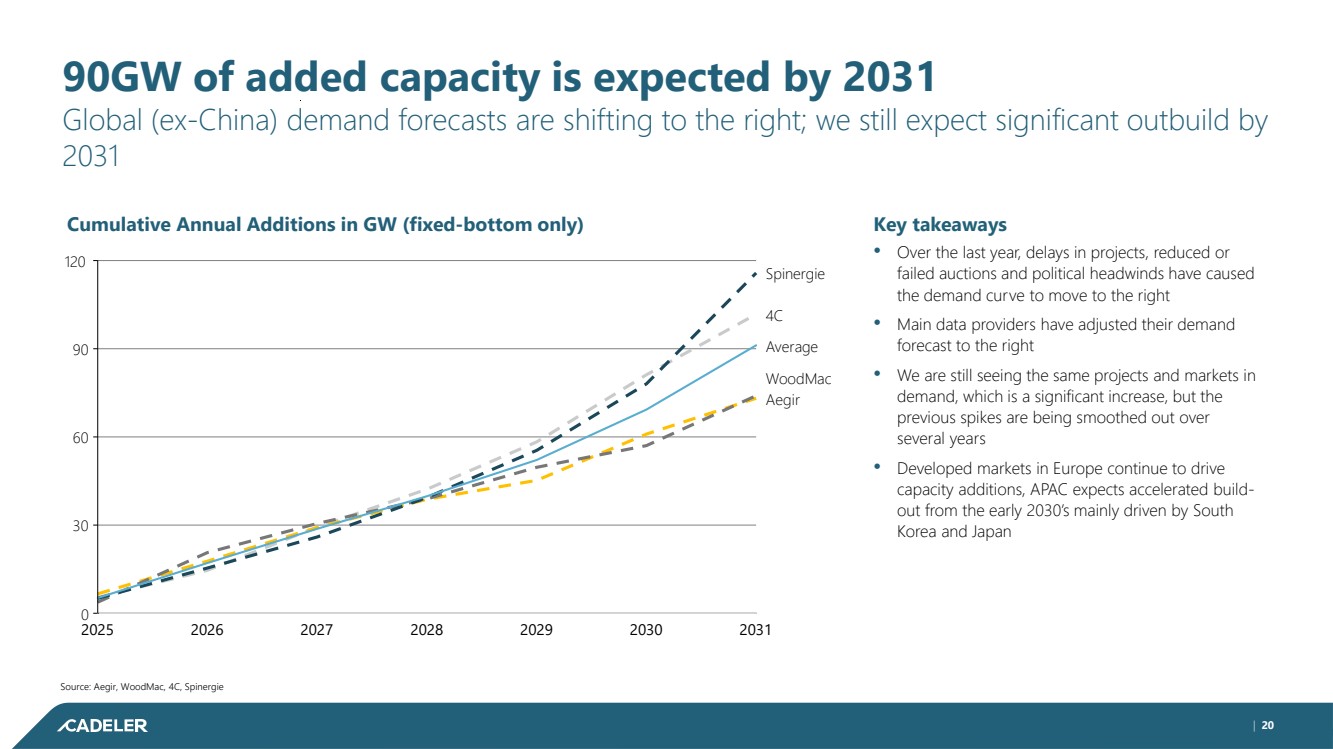
| | 20 90GW of added capacity is expected by 2031 Global (ex-China) demand forecasts are shifting to the right; we still expect significant outbuild by 2031 Cumulative Annual Additions in GW (fixed-bottom only) Key takeaways • Over the last year, delays in projects, reduced or failed auctions and political headwinds have caused the demand curve to move to the right • Main data providers have adjusted their demand forecast to the right • We are still seeing the same projects and markets in demand, which is a significant increase, but the previous spikes are being smoothed out over several years • Developed markets in Europe continue to drive capacity additions, APAC expects accelerated build-out from the early 2030’s mainly driven by South Korea and Japan Source: Aegir, WoodMac, 4C, Spinergie Aegir WoodMac Average 4C Spinergie 0 30 60 90 120 2025 2026 2027 2028 2029 2030 2031 |
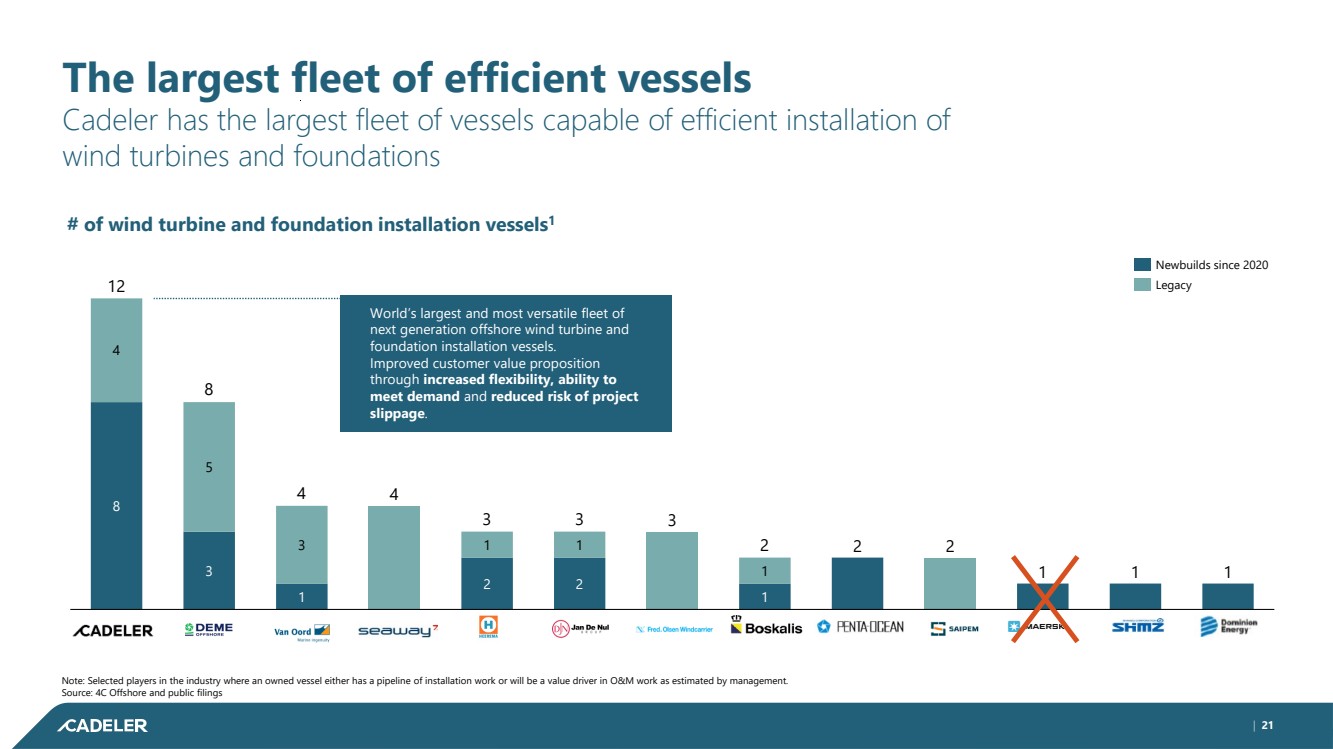
| | 21 The largest fleet of efficient vessels Cadeler has the largest fleet of vessels capable of efficient installation of wind turbines and foundations Note: Selected players in the industry where an owned vessel either has a pipeline of installation work or will be a value driver in O&M work as estimated by management. Source: 4C Offshore and public filings # of wind turbine and foundation installation vessels1 8 3 1 4 2 2 3 1 2 2 1 1 1 4 5 3 1 1 1 Maersk 12 8 4 3 3 2 Newbuilds since 2020 Legacy World’s largest and most versatile fleet of next generation offshore wind turbine and foundation installation vessels. Improved customer value proposition through increased flexibility, ability to meet demand and reduced risk of project slippage. |
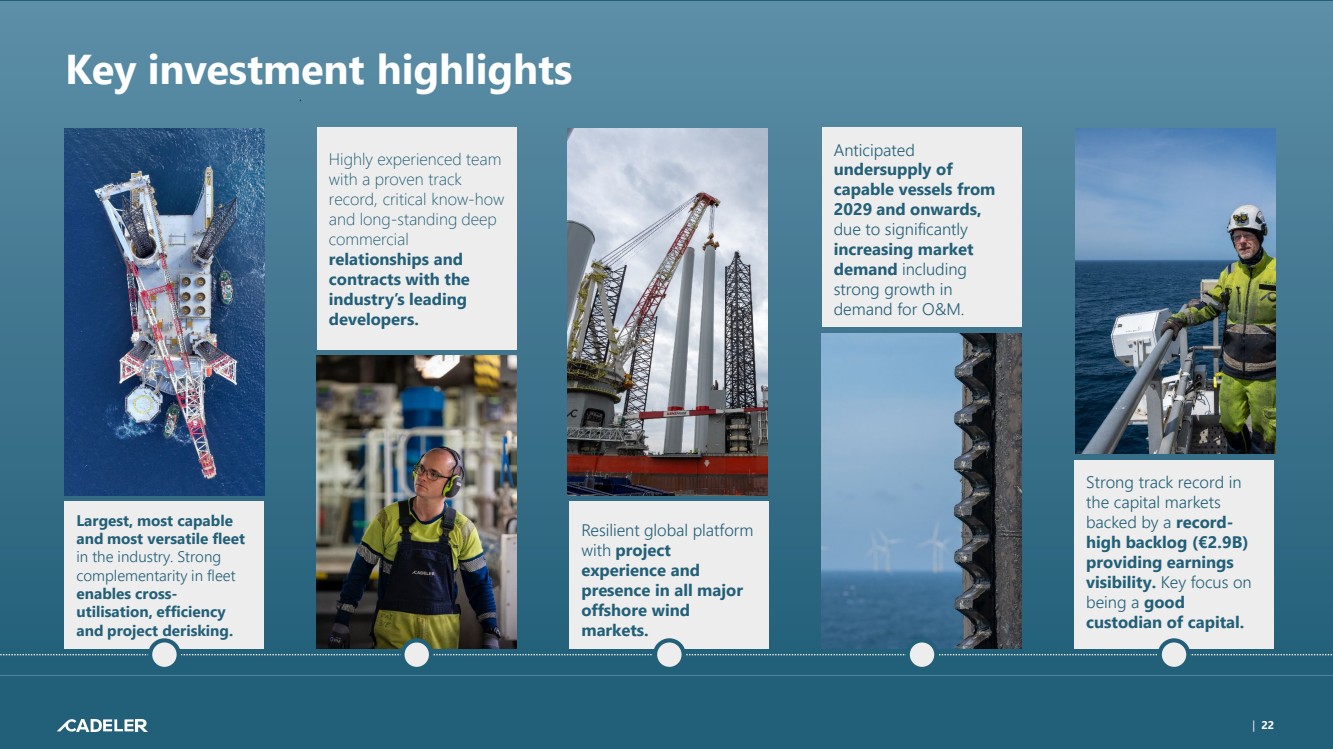
| aa Key investment highlights Largest, most capable and most versatile fleet in the industry. Strong complementarity in fleet enables cross-utilisation, efficiency and project derisking. Highly experienced team with a proven track record, critical know-how and long-standing deep commercial relationships and contracts with the industry’s leading developers. Resilient global platform with project experience and presence in all major offshore wind markets. Anticipated undersupply of capable vessels from 2029 and onwards, due to significantly increasing market demand including strong growth in demand for O&M. Strong track record in the capital markets backed by a record-high backlog (€2.9B) providing earnings visibility. Key focus on being a good custodian of capital. | 22 |
| Kalvebod Brygge 43 DK–1560 Copenhagen Denmark +45 3246 3100 Follow us on: Questions can be sent to investorrelations@cadeler.com |
