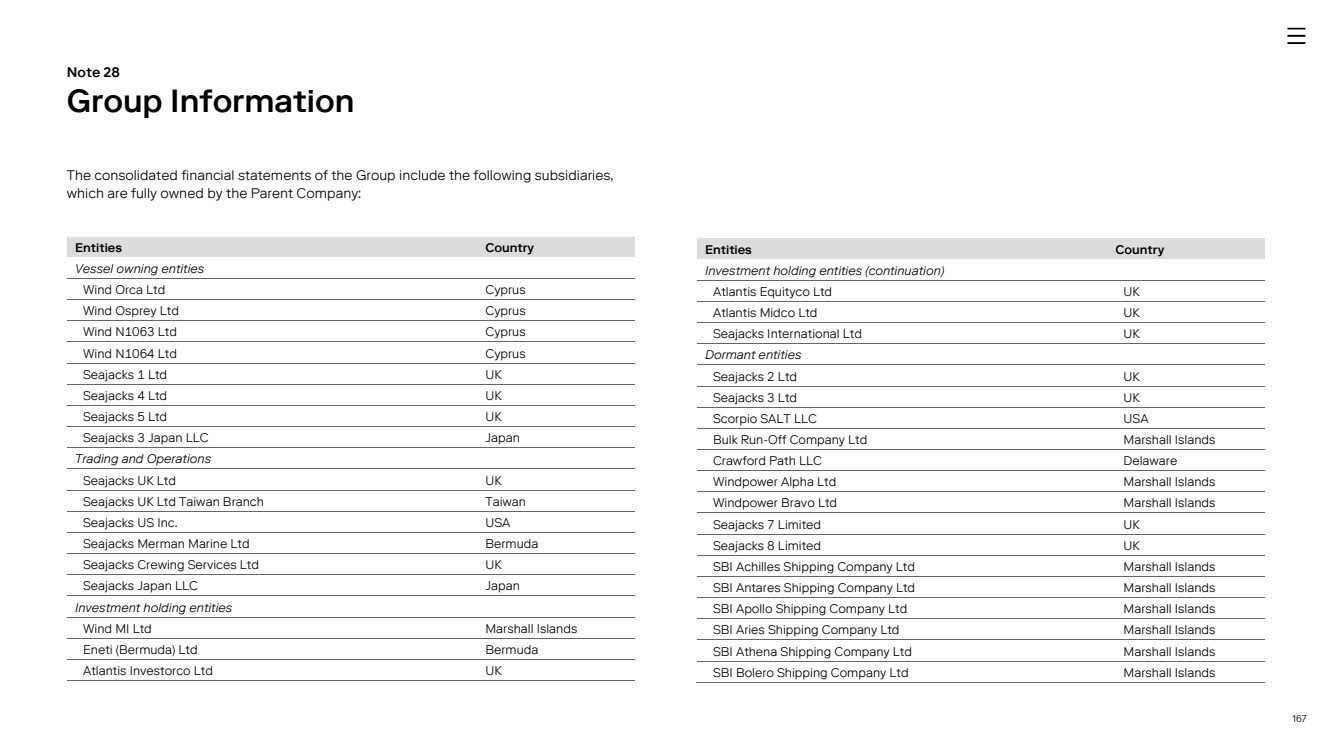
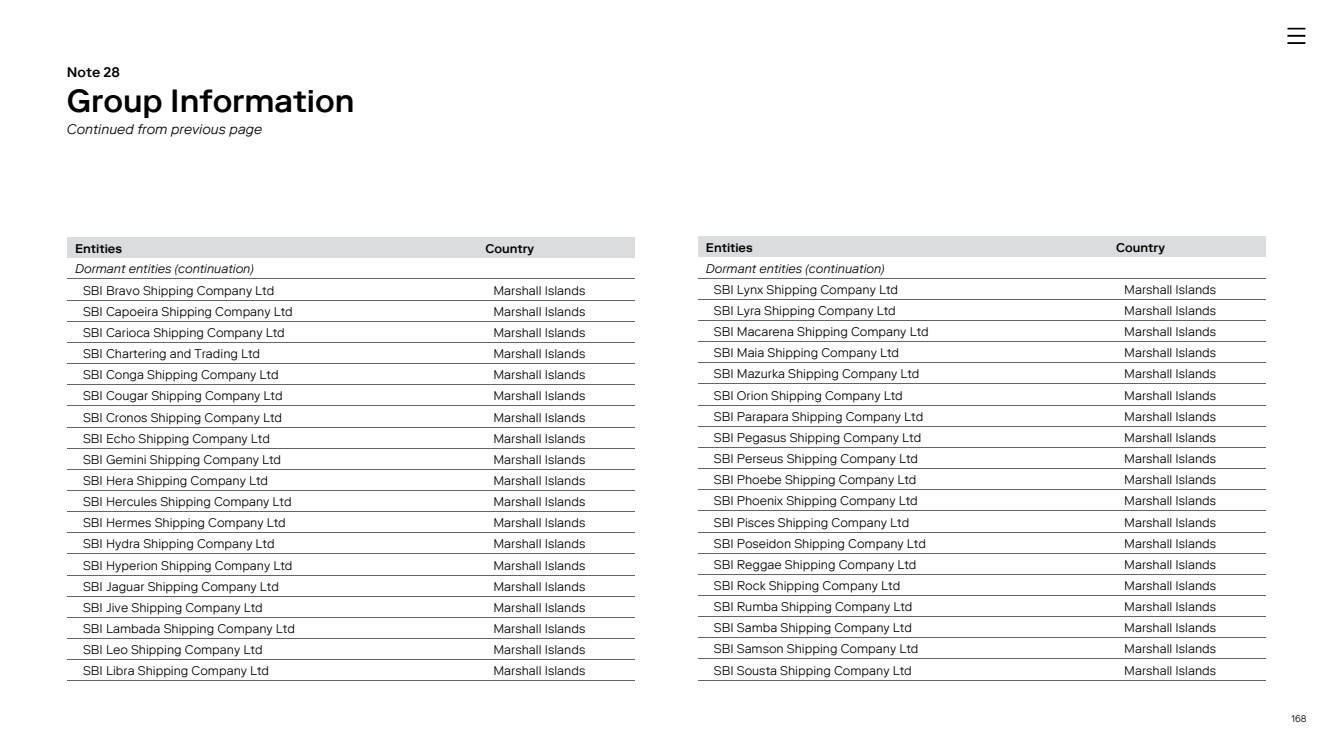
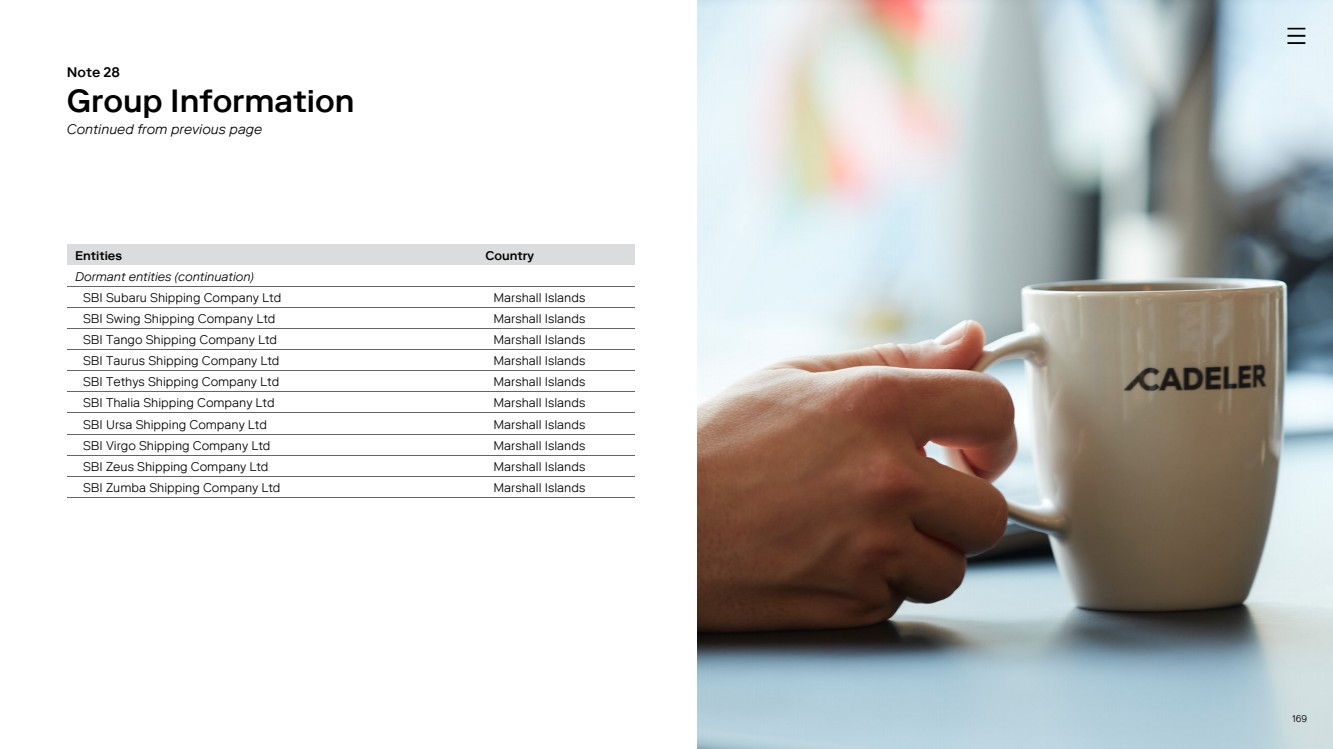
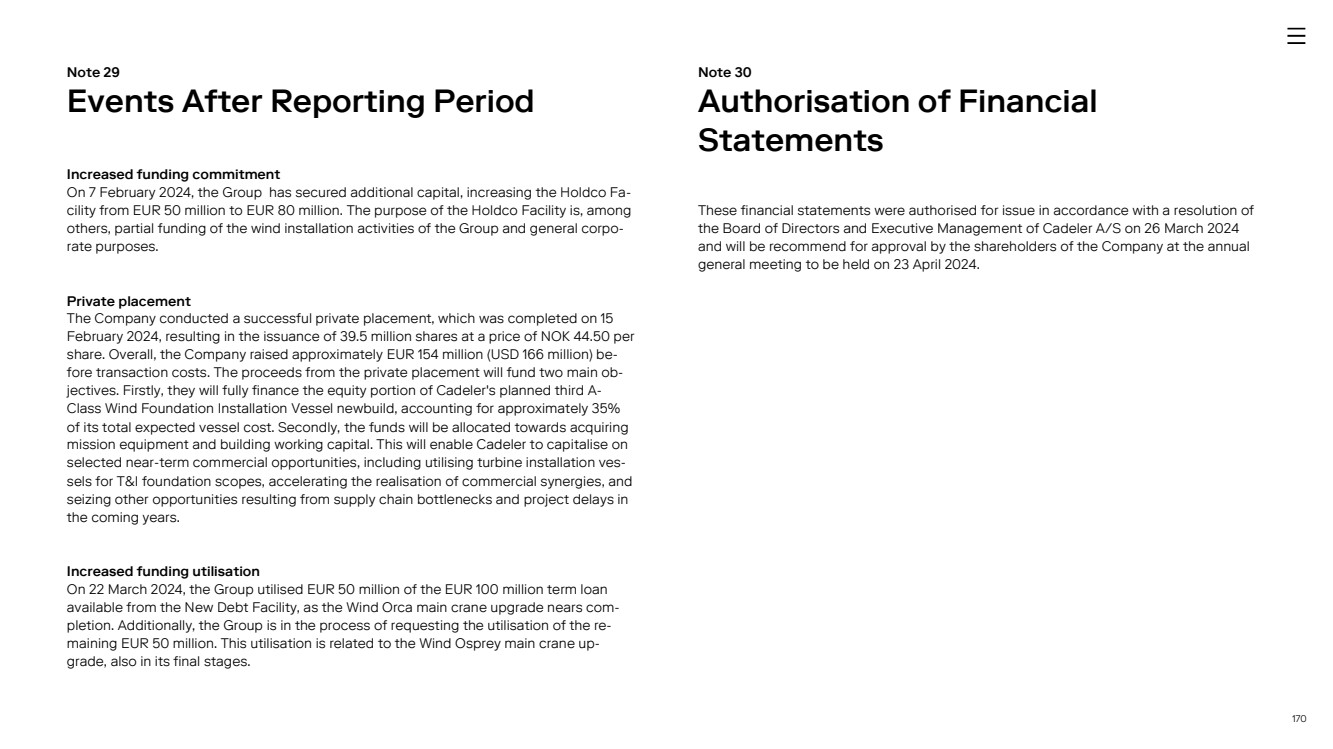
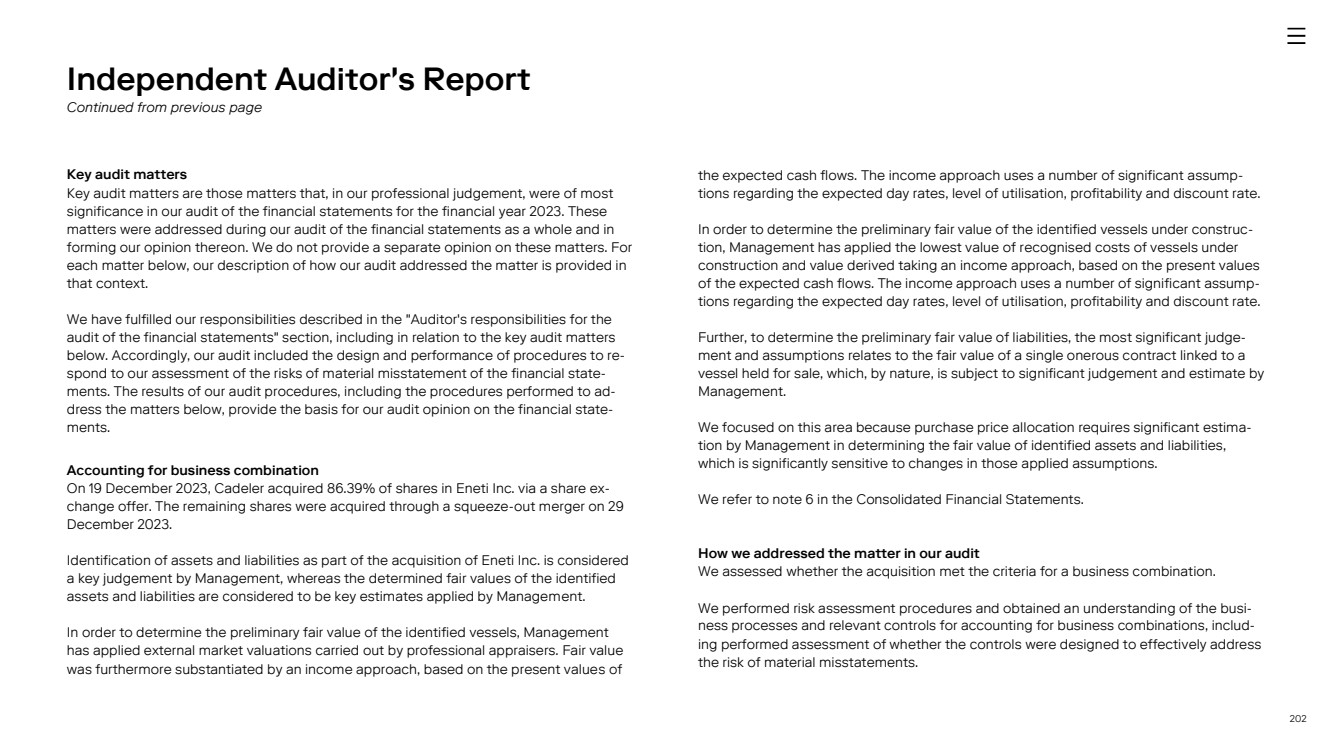
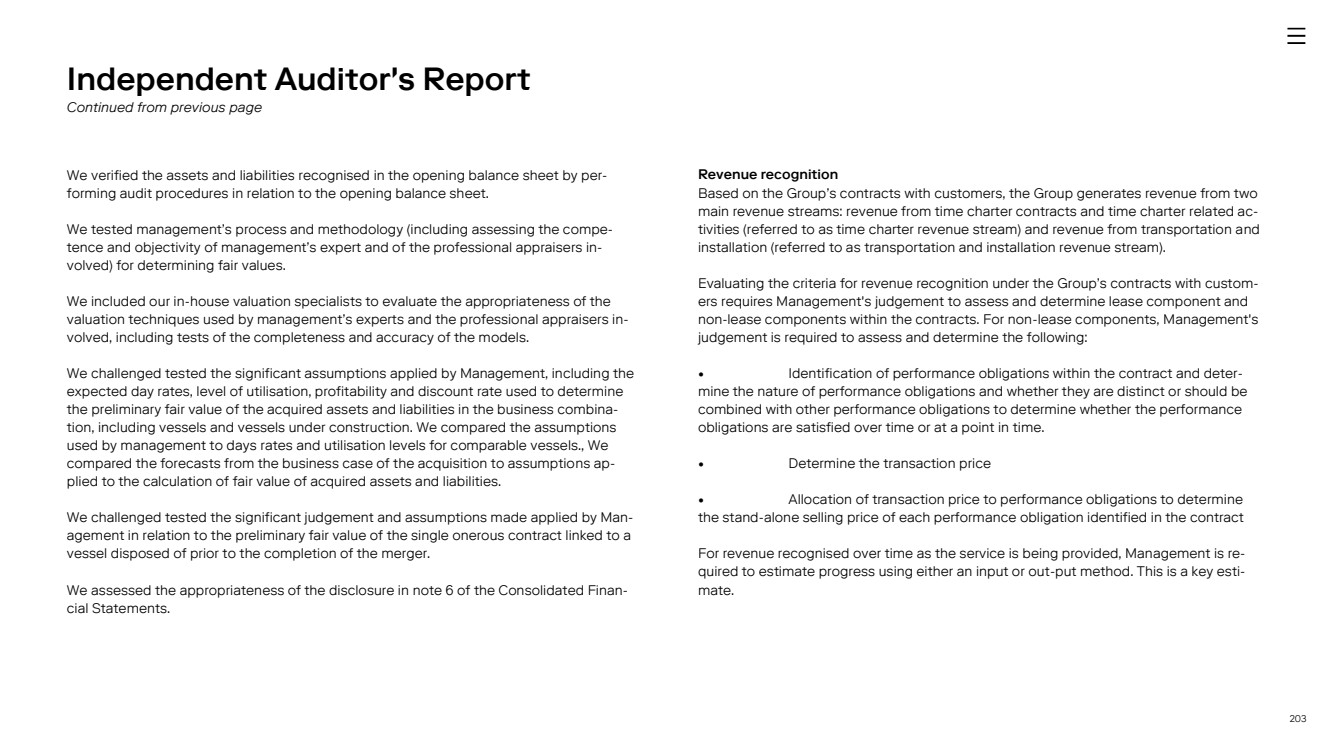
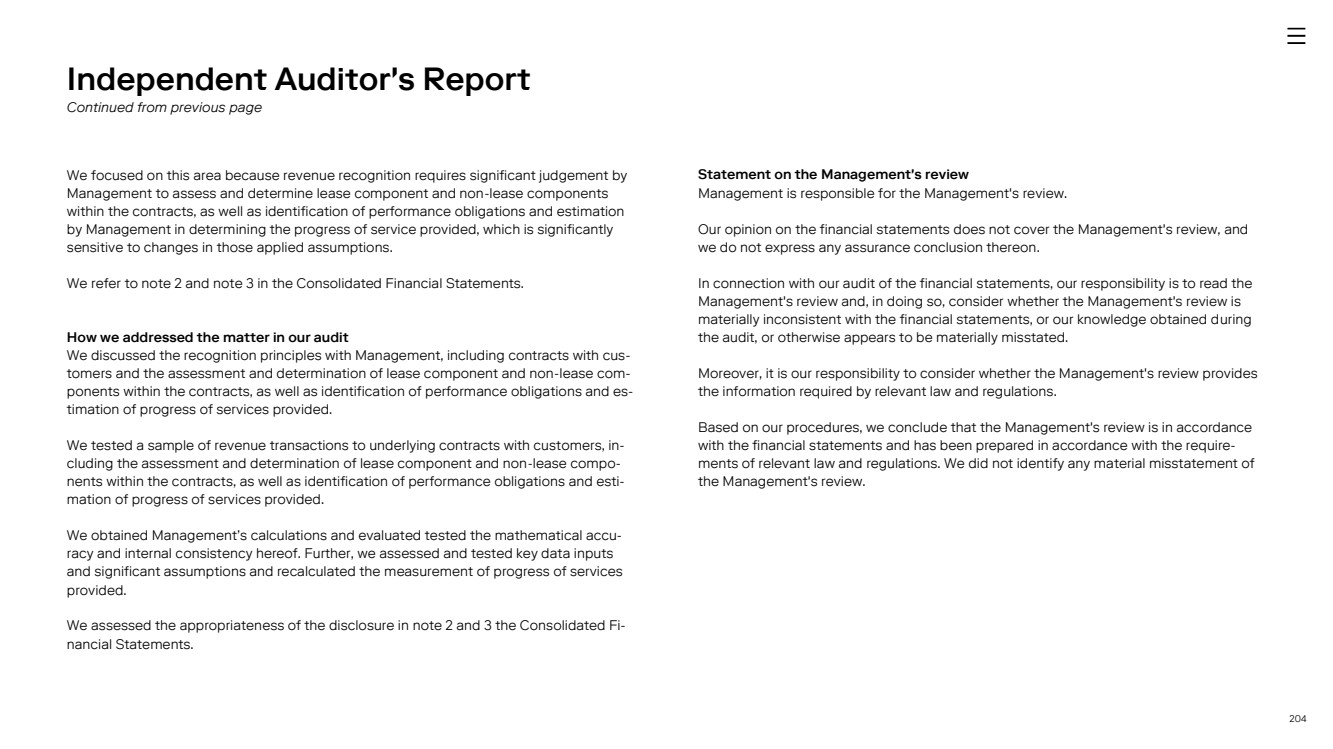
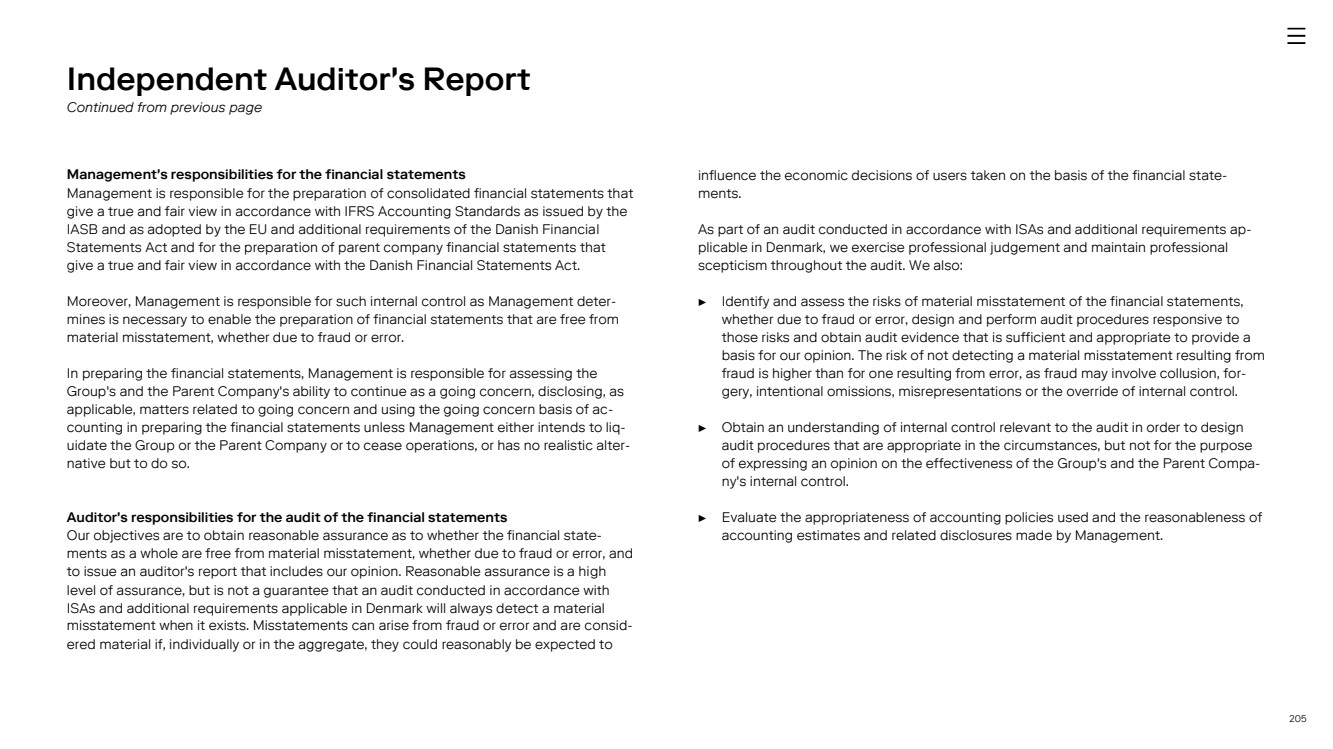
EXHIBIT 15.1
Published on March 26, 2024
|
Cadeler A/S. Incorporated in Denmark. Registration Number (CVR no.): 3118 0503 Arne Jacobsens Allé 7, 7. Floor, DK-2300 Copenhagen S, Denmark Annual Report 2023 For the year end 31 December 2023 Cadeler A/S. Incorporated in Denmark. Registration Number (CVR no.): 3118 0503 Kalvebod Brygge 43, DK-1560 Copenhagen V, Denmark |
|
2 Statement from the Chairman and the CEO .........................................................................................3 The Year 2023 in Brief ....................................................................................................................................6 Management Review...................................................................................................................................... 7 Reporting on Sustainability ........................................................................................................................37 Green Finance Report..................................................................................................................................82 Consolidated Financial Statements....................................................................................................... 86 Notes to the Consolidated Financial Statements ............................................................................ 93 Parent Company Financial Statements................................................................................................ 171 Notes to the Parent Company Financial Statements .....................................................................177 Statement by Management..................................................................................................................... 197 Independent Auditor's Report............................................................................................................... 200 Forward-looking Statements..................................................................................................................208 Alternative Performance Measures.......................................................................................................210 ESG Appendices .......................................................................................................................................... 212 Contents |
|
3 As 2023 came to a close, Cadeler secured its place as a global leader in the offshore wind farm transportation and installation industry. Cadeler charted a remarkable course in 2023, showing solid results alongside a stra-tegic scale-up in fleet size, investment in talent, and achievement of a record-breaking backlog of orders. Cadeler is now a global leader in offshore wind farm transportation and installation – ready to achieve its full international potential and to harness the power of wind. The story of the past year has been one of sustained growth for Cadeler – both organi-cally and through the merger with Eneti. This strategic combination, completed in De-cember 2023, made us the world’s leading offshore wind turbine transport and installa-tion company, with a market capitalisation of approximately EUR 1.3 billion, and a dual listing on the Oslo Stock Exchange and New York Stock Exchange. During the year, short-term sentiment around offshore wind turned negative as a result of headlines on some project cancellations, rising interest rates, high inflation and supply chain bottlenecks. However, the market fundamentals remain strong, and Cadeler en-joyed a record year of bookings. Our orderbook now stands at close to EUR 1.7 billion, with a very high percentage of this already at final investment decision stage. Globally, the market will continue to grow at a rapid pace. Offshore wind is a vital ele-ment in the energy transition, and continued geopolitical uncertainty will keep energy se-curity at the top of the international agenda. Cadeler is well positioned for this, due to tight supply of capable offshore wind turbine and foundation installation vessels. Our strategy to serve this expanding sector is to further develop the largest, most diverse and flexible fleet, able to handle complex next-generation offshore projects anywhere in the world. A strong combination of talents After careful consideration of potential partners, Eneti was identified as an ideal strategic fit for Cadeler. Our traditional strength in the European market is complemented by Eneti’s focus on Asia and the United States, creating a combination with full global cov-erage in the installation of next-generation turbines. We are now ready to strategically expand our markets outside Europe, while seeking full utilisation of our vessels. Increased scale and diversification mean that Cadeler will also be able to provide customers with a greater degree of redundancy – lessening the risk of projects falling behind schedule. When bottlenecks occur in the value chain, we can offer a unique flexibility to our clients to address any issues that may arise over the course of the project. We believe the combination with Eneti will deliver around EUR 100 million in annual syn-ergies. This figure comprises corporate and financing savings, such as reduced corpo-rate and management costs, an optimised hiring plan and improved financing terms – and operational synergies, such as cross-utilisation of equipment and better procure-ment efficiency. It also includes utilisation synergies, which will deliver more vessel avail-ability for our clients. Empowering the green transition Cadeler’s commitment to sustainability remains undiminished. In 2023 we have started to explore the uptake of certified biofuels and renewable diesel in our current O-class vessels. These represent a readily available way to reduce emissions from engine com-bustion, replacing fossil fuels and providing our customers with a short-term alternative. Statement from the Chairman and the CEO |
|
4 We were also able to sell the disassembled cranes from our O-class vessels to Hapo In-ternational Barges, granting them a useful second life. Another major focus is on building a fleet of vessels capable of running on alternative fuels in the future. During 2023, significant resources were allocated to ensuring our six newbuild vessels will be ready for eventual conversion to run on alternative fuels. Green methanol has been identified as the option available soonest. However, several fuel pathways have been explored, and we will continue investigating the alternatives during 2024. Furthermore, understanding how energy is consumed on board the vessels is a key driver for Cadeler in improving energy efficiency. During 2023, we continued expanding on our fuel monitoring systems, enabling sufficient real-time data to be utilised to drive im-provement actions. In addition, a heavy focus has been put on delivering newbuild as-sets with a significantly higher level of efficiencies in their design. All these initiatives will form the foundation of a future low-carbon fleet for Cadeler. To help us collaborate and meet the industry’s climate goals, Cadeler joined the EMRED joint industry project led by DNV. This project aims to establish a standardised monitor-ing and reporting framework for assessing greenhouse gas (GHG) emissions in the off-shore wind installation sector, driving emission reductions across the industry. Towards the end of 2023, Cadeler also began its involvement in a project led by Danish Shipping and ReFlow, focused on the development of a digital tool to assess the lifecycle emis-sions of vessels. Finally, we have established a dedicated Decarbonisation and Sustainability department. Sponsored by executive management, it will take responsibility for designing the strat-egy and roadmap for decarbonisation, along with execution and implementation. This strategic decision stemmed from the company’s acknowledgement of the importance and complexity of meeting challenges within these areas. We continue to work towards our long-standing goals of reducing emissions, optimising energy consumption and adopting greener fuels. Embracing change: new people, new fleet When Cadeler rang the bell at the New York Stock Exchange on December 21 last year, marking its listing as a single entity encompassing Eneti, it also welcomed a wealth of new talent on board. The company now employs around 400 seafarers and 230 people onshore. We can proudly say that we offer our business partners access to a talented global team, with continuous improvement in terms of safety, quality and efficiency within offshore wind farm transport and installation services. Whether at the Cadeler headquarters in Copenhagen or at our offices in Vejle in Den-mark, Taipei, Tokyo, Great Yarmouth in the UK or Virginia Beach in the USA, the daily nur-turing and development of our unique Cadeler culture is vital to help unlock industry po-tential – and to accelerate the transition to renewable energy. We will continue to refine our uncompromising “partners first” mentality, where our clients’ success is our guiding star. The Cadeler fleet now numbers four units. The former Eneti vessels Wind Scylla and Wind Zaratan now take their place alongside our existing O-class vessels, Wind Orca and Wind Osprey. Both of the latter units are being upgraded with new state-of-the-art main cranes, with finalisation of installation and commissioning in the early part of 2024. |
|
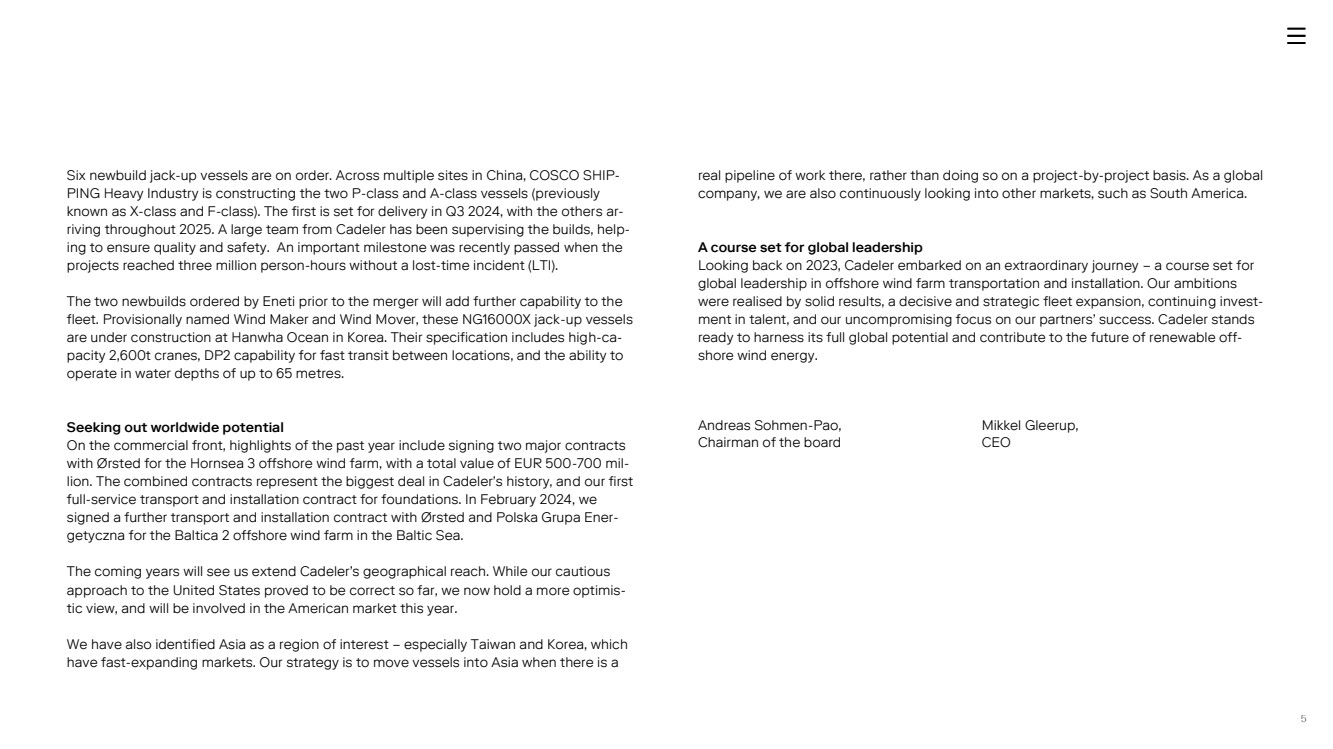
5 Six newbuild jack-up vessels are on order. Across multiple sites in China, COSCO SHIP-PING Heavy Industry is constructing the two P-class and A-class vessels (previously known as X-class and F-class). The first is set for delivery in Q3 2024, with the others ar-riving throughout 2025. A large team from Cadeler has been supervising the builds, help-ing to ensure quality and safety. An important milestone was recently passed when the projects reached three million person-hours without a lost-time incident (LTI). The two newbuilds ordered by Eneti prior to the merger will add further capability to the fleet. Provisionally named Wind Maker and Wind Mover, these NG16000X jack-up vessels are under construction at Hanwha Ocean in Korea. Their specification includes high-ca-pacity 2,600t cranes, DP2 capability for fast transit between locations, and the ability to operate in water depths of up to 65 metres. Seeking out worldwide potential On the commercial front, highlights of the past year include signing two major contracts with Ørsted for the Hornsea 3 offshore wind farm, with a total value of EUR 500-700 mil-lion. The combined contracts represent the biggest deal in Cadeler’s history, and our first full-service transport and installation contract for foundations. In February 2024, we signed a further transport and installation contract with Ørsted and Polska Grupa Ener-getyczna for the Baltica 2 offshore wind farm in the Baltic Sea. The coming years will see us extend Cadeler’s geographical reach. While our cautious approach to the United States proved to be correct so far, we now hold a more optimis-tic view, and will be involved in the American market this year. We have also identified Asia as a region of interest – especially Taiwan and Korea, which have fast-expanding markets. Our strategy is to move vessels into Asia when there is a real pipeline of work there, rather than doing so on a project-by-project basis. As a global company, we are also continuously looking into other markets, such as South America. A course set for global leadership Looking back on 2023, Cadeler embarked on an extraordinary journey – a course set for global leadership in offshore wind farm transportation and installation. Our ambitions were realised by solid results, a decisive and strategic fleet expansion, continuing invest-ment in talent, and our uncompromising focus on our partners’ success. Cadeler stands ready to harness its full global potential and contribute to the future of renewable off-shore wind energy. Andreas Sohmen-Pao, Chairman of the board Mikkel Gleerup, CEO 5 |
|
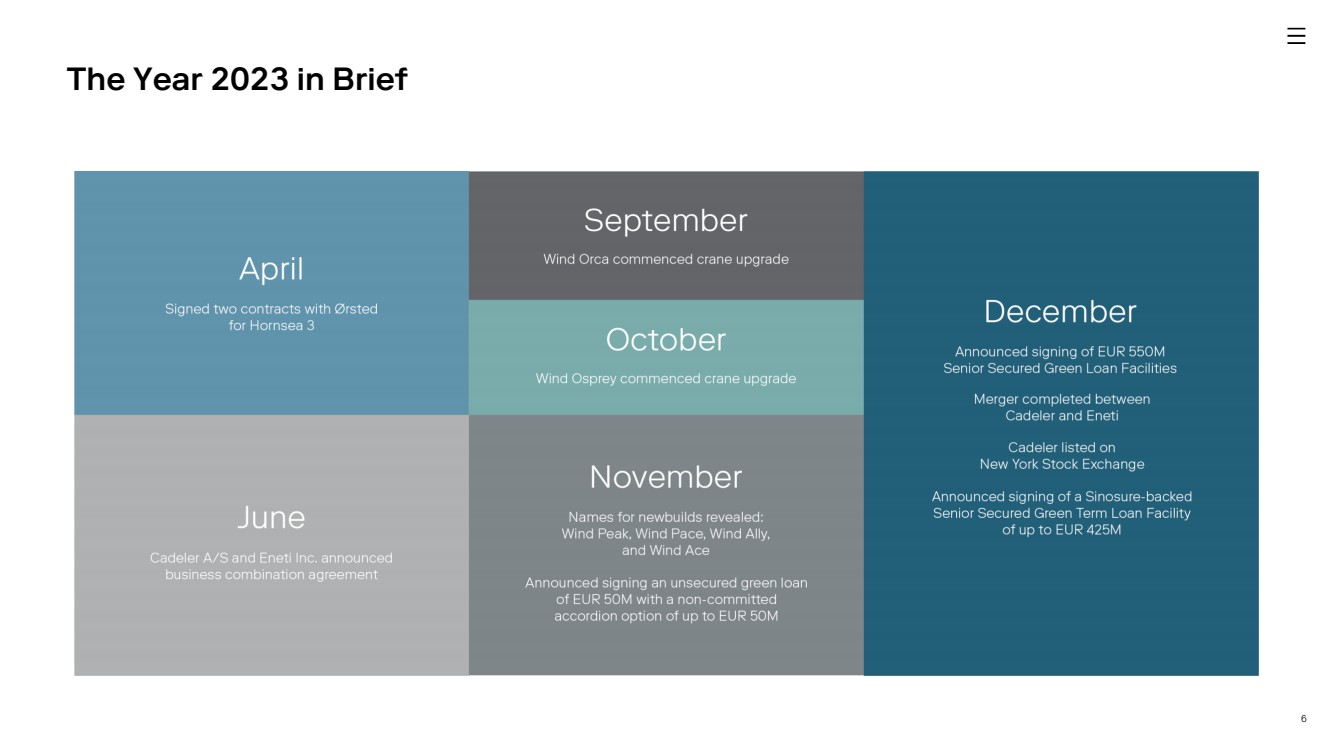
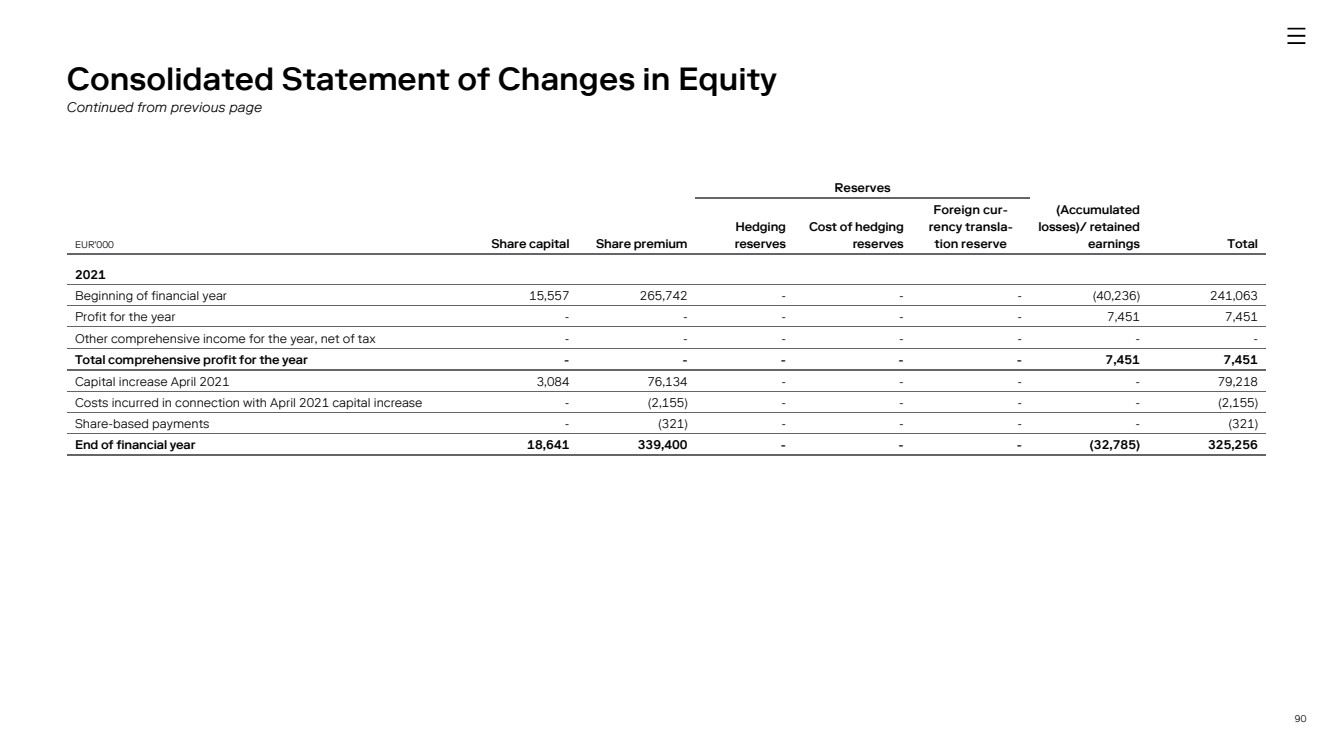
6 The Year 2023 in Brief |
|
7 Management Review 7 |
|
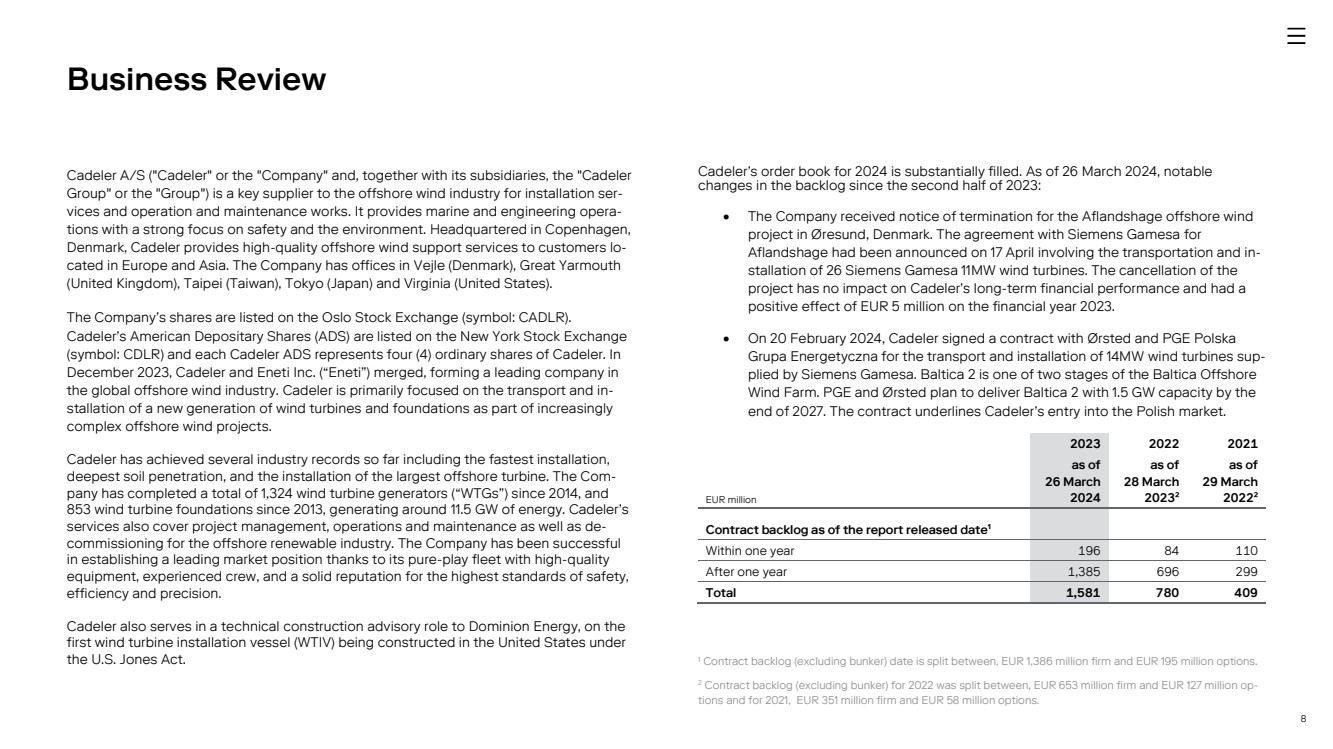
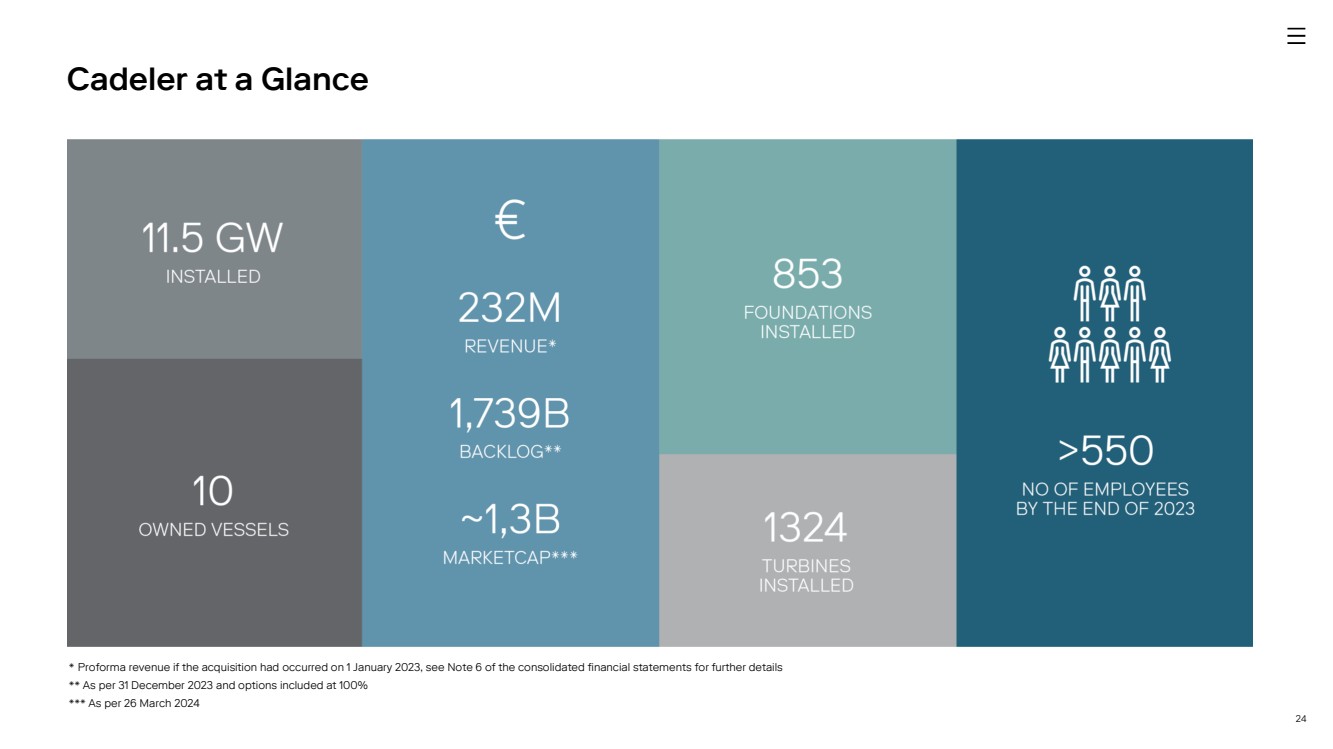
8 Cadeler A/S ("Cadeler" or the "Company" and, together with its subsidiaries, the "Cadeler Group" or the "Group") is a key supplier to the offshore wind industry for installation ser-vices and operation and maintenance works. It provides marine and engineering opera-tions with a strong focus on safety and the environment. Headquartered in Copenhagen, Denmark, Cadeler provides high-quality offshore wind support services to customers lo-cated in Europe and Asia. The Company has offices in Vejle (Denmark), Great Yarmouth (United Kingdom), Taipei (Taiwan), Tokyo (Japan) and Virginia (United States). The Company’s shares are listed on the Oslo Stock Exchange (symbol: CADLR). Cadeler’s American Depositary Shares (ADS) are listed on the New York Stock Exchange (symbol: CDLR) and each Cadeler ADS represents four (4) ordinary shares of Cadeler. In December 2023, Cadeler and Eneti Inc. (“Eneti”) merged, forming a leading company in the global offshore wind industry. Cadeler is primarily focused on the transport and in-stallation of a new generation of wind turbines and foundations as part of increasingly complex offshore wind projects. Cadeler has achieved several industry records so far including the fastest installation, deepest soil penetration, and the installation of the largest offshore turbine. The Com-pany has completed a total of 1,324 wind turbine generators (“WTGs”) since 2014, and 853 wind turbine foundations since 2013, generating around 11.5 GW of energy. Cadeler’s services also cover project management, operations and maintenance as well as de-commissioning for the offshore renewable industry. The Company has been successful in establishing a leading market position thanks to its pure-play fleet with high-quality equipment, experienced crew, and a solid reputation for the highest standards of safety, efficiency and precision. Cadeler also serves in a technical construction advisory role to Dominion Energy, on the first wind turbine installation vessel (WTIV) being constructed in the United States under the U.S. Jones Act. Cadeler’s order book for 2024 is substantially filled. As of 26 March 2024, notable changes in the backlog since the second half of 2023: • The Company received notice of termination for the Aflandshage offshore wind project in Øresund, Denmark. The agreement with Siemens Gamesa for Aflandshage had been announced on 17 April involving the transportation and in-stallation of 26 Siemens Gamesa 11MW wind turbines. The cancellation of the project has no impact on Cadeler’s long-term financial performance and had a positive effect of EUR 5 million on the financial year 2023. • On 20 February 2024, Cadeler signed a contract with Ørsted and PGE Polska Grupa Energetyczna for the transport and installation of 14MW wind turbines sup-plied by Siemens Gamesa. Baltica 2 is one of two stages of the Baltica Offshore Wind Farm. PGE and Ørsted plan to deliver Baltica 2 with 1.5 GW capacity by the end of 2027. The contract underlines Cadeler’s entry into the Polish market. 2023 2022 2021 EUR million as of 26 March 2024 as of 28 March 2023² as of 29 March 2022² Contract backlog as of the report released date¹ Within one year 196 84 110 After one year 1,385 696 299 Total 1,581 780 409 Business Review 1 Contract backlog (excluding bunker) date is split between, EUR 1,386 million firm and EUR 195 million options. 2 Contract backlog (excluding bunker) for 2022 was split between, EUR 653 million firm and EUR 127 million op-tions and for 2021, EUR 351 million firm and EUR 58 million options. |
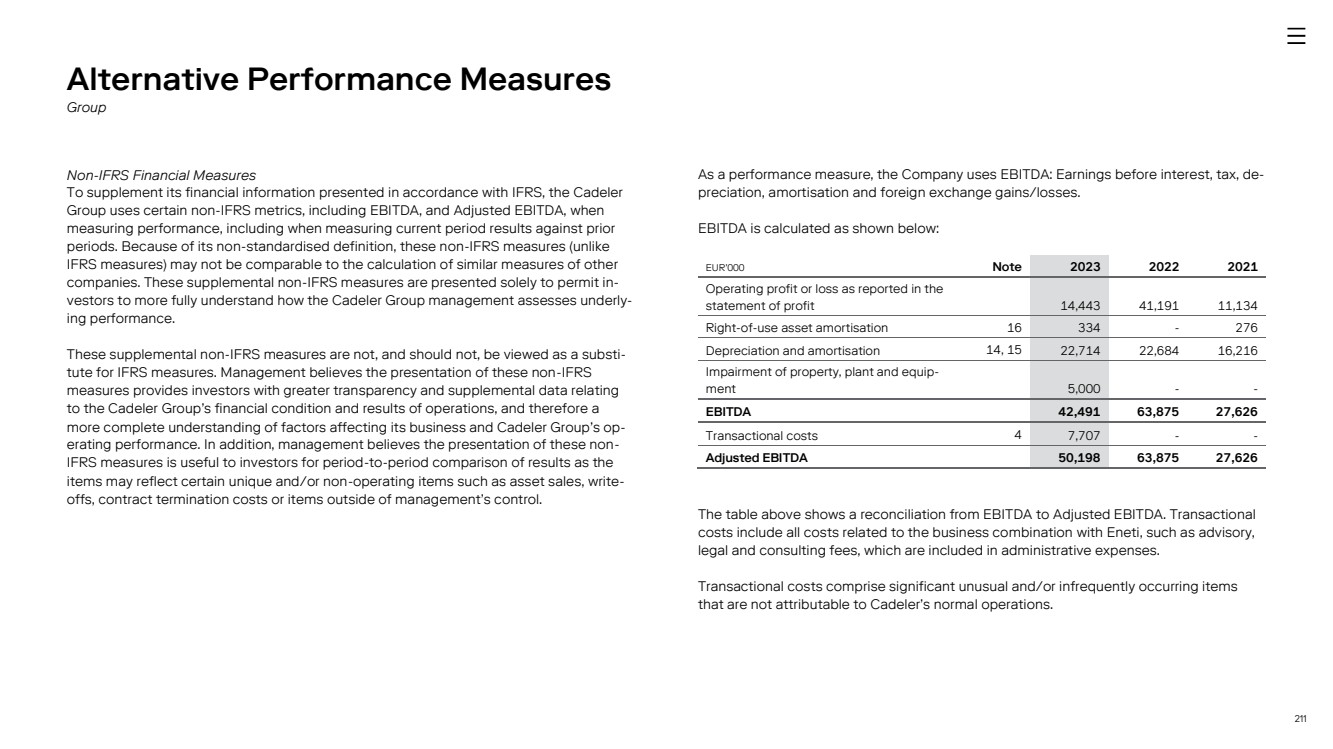
|
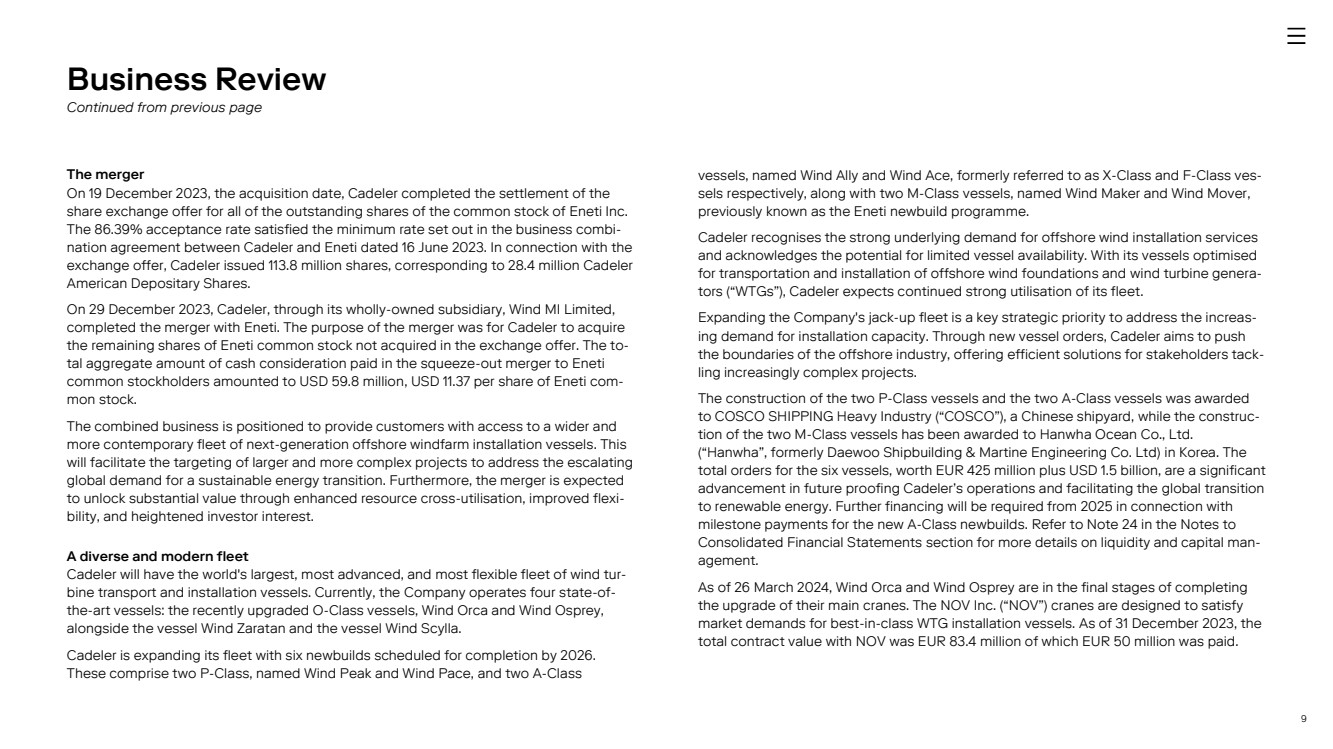
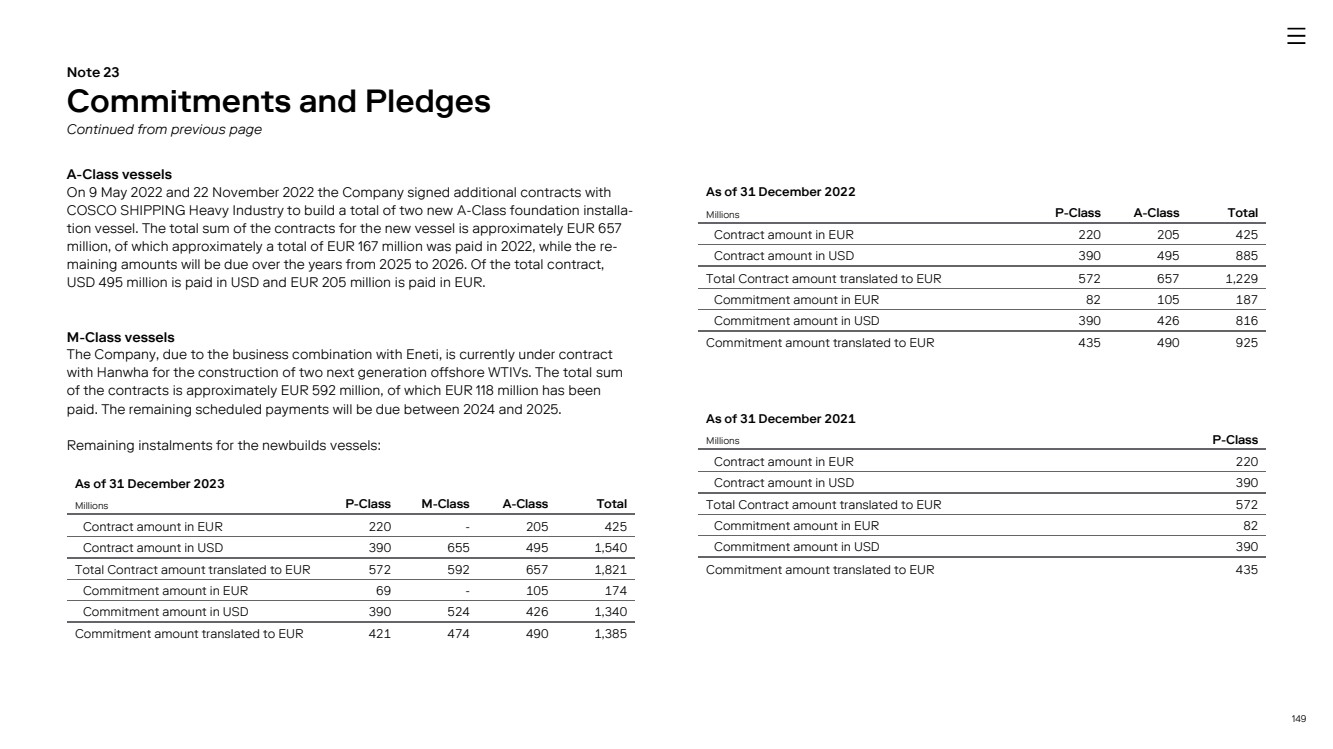
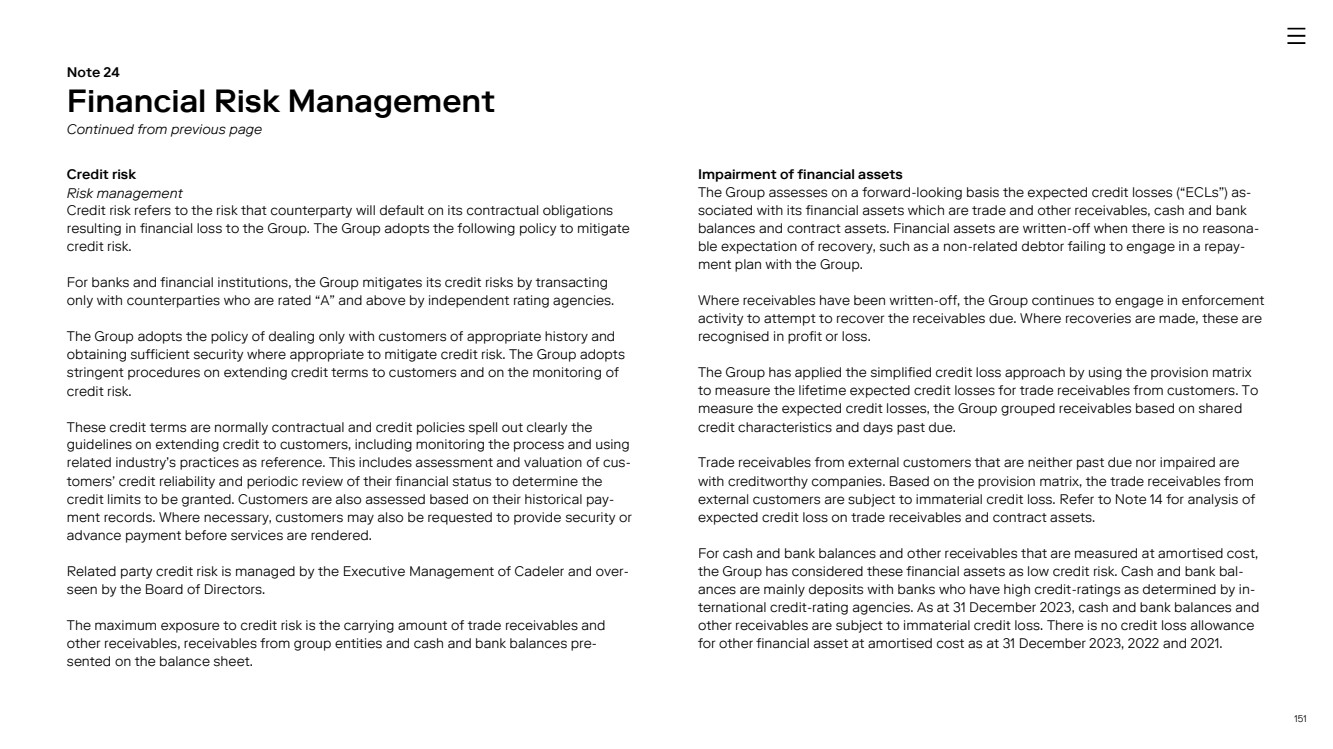
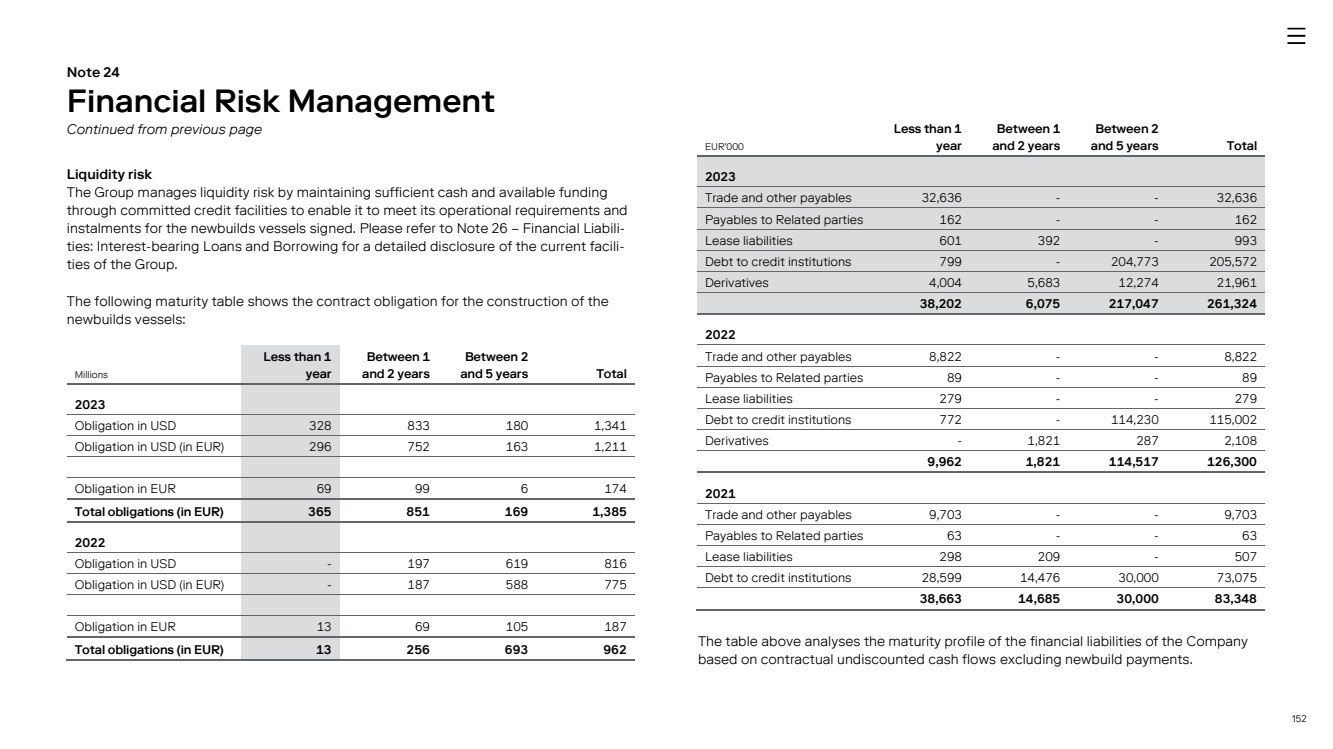
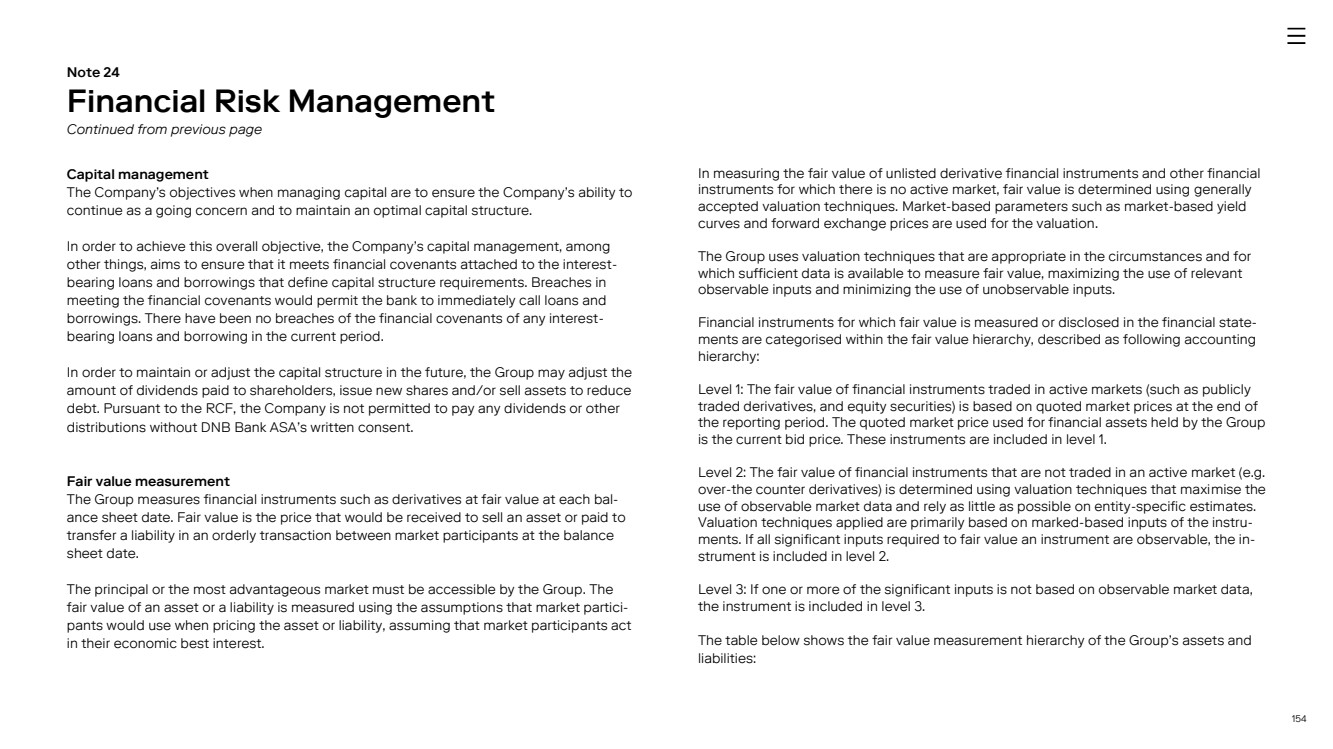
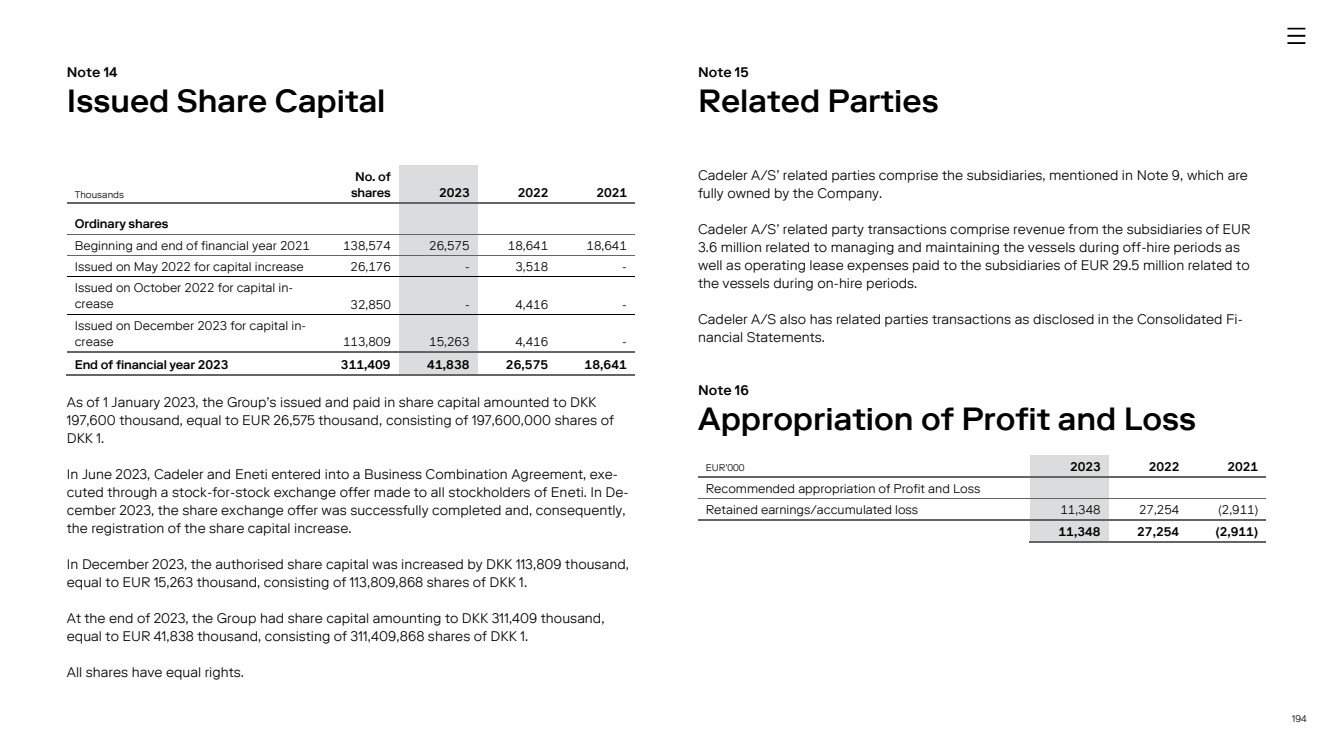
9 The merger On 19 December 2023, the acquisition date, Cadeler completed the settlement of the share exchange offer for all of the outstanding shares of the common stock of Eneti Inc. The 86.39% acceptance rate satisfied the minimum rate set out in the business combi-nation agreement between Cadeler and Eneti dated 16 June 2023. In connection with the exchange offer, Cadeler issued 113.8 million shares, corresponding to 28.4 million Cadeler American Depositary Shares. On 29 December 2023, Cadeler, through its wholly-owned subsidiary, Wind MI Limited, completed the merger with Eneti. The purpose of the merger was for Cadeler to acquire the remaining shares of Eneti common stock not acquired in the exchange offer. The to-tal aggregate amount of cash consideration paid in the squeeze-out merger to Eneti common stockholders amounted to USD 59.8 million, USD 11.37 per share of Eneti com-mon stock. The combined business is positioned to provide customers with access to a wider and more contemporary fleet of next-generation offshore windfarm installation vessels. This will facilitate the targeting of larger and more complex projects to address the escalating global demand for a sustainable energy transition. Furthermore, the merger is expected to unlock substantial value through enhanced resource cross-utilisation, improved flexi-bility, and heightened investor interest. A diverse and modern fleet Cadeler will have the world's largest, most advanced, and most flexible fleet of wind tur-bine transport and installation vessels. Currently, the Company operates four state-of-the-art vessels: the recently upgraded O-Class vessels, Wind Orca and Wind Osprey, alongside the vessel Wind Zaratan and the vessel Wind Scylla. Cadeler is expanding its fleet with six newbuilds scheduled for completion by 2026. These comprise two P-Class, named Wind Peak and Wind Pace, and two A-Class vessels, named Wind Ally and Wind Ace, formerly referred to as X-Class and F-Class ves-sels respectively, along with two M-Class vessels, named Wind Maker and Wind Mover, previously known as the Eneti newbuild programme. Cadeler recognises the strong underlying demand for offshore wind installation services and acknowledges the potential for limited vessel availability. With its vessels optimised for transportation and installation of offshore wind foundations and wind turbine genera-tors (“WTGs”), Cadeler expects continued strong utilisation of its fleet. Expanding the Company's jack-up fleet is a key strategic priority to address the increas-ing demand for installation capacity. Through new vessel orders, Cadeler aims to push the boundaries of the offshore industry, offering efficient solutions for stakeholders tack-ling increasingly complex projects. The construction of the two P-Class vessels and the two A-Class vessels was awarded to COSCO SHIPPING Heavy Industry (“COSCO”), a Chinese shipyard, while the construc-tion of the two M-Class vessels has been awarded to Hanwha Ocean Co., Ltd. (“Hanwha”, formerly Daewoo Shipbuilding & Martine Engineering Co. Ltd) in Korea. The total orders for the six vessels, worth EUR 425 million plus USD 1.5 billion, are a significant advancement in future proofing Cadeler’s operations and facilitating the global transition to renewable energy. Further financing will be required from 2025 in connection with milestone payments for the new A-Class newbuilds. Refer to Note 24 in the Notes to Consolidated Financial Statements section for more details on liquidity and capital man-agement. As of 26 March 2024, Wind Orca and Wind Osprey are in the final stages of completing the upgrade of their main cranes. The NOV Inc. (“NOV”) cranes are designed to satisfy market demands for best-in-class WTG installation vessels. As of 31 December 2023, the total contract value with NOV was EUR 83.4 million of which EUR 50 million was paid. Business Review Continued from previous page |
|
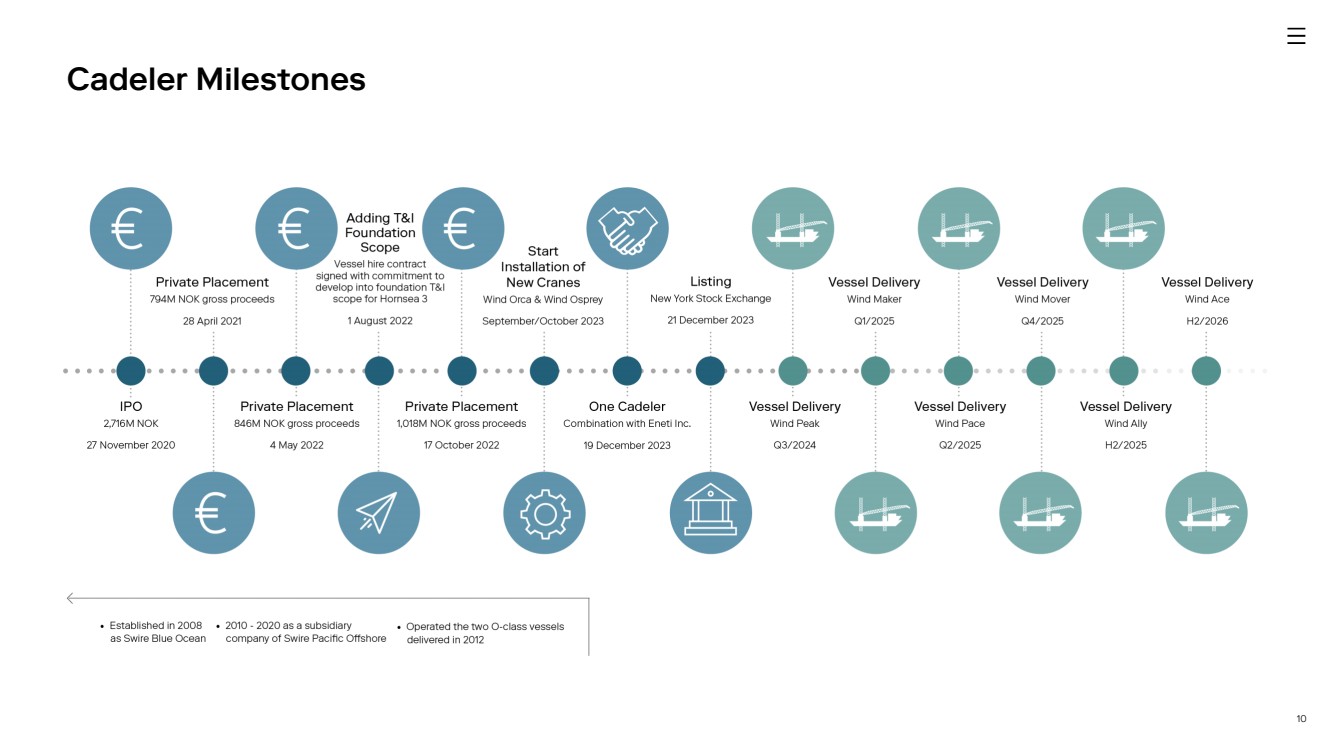
10 Cadeler Milestones |
|
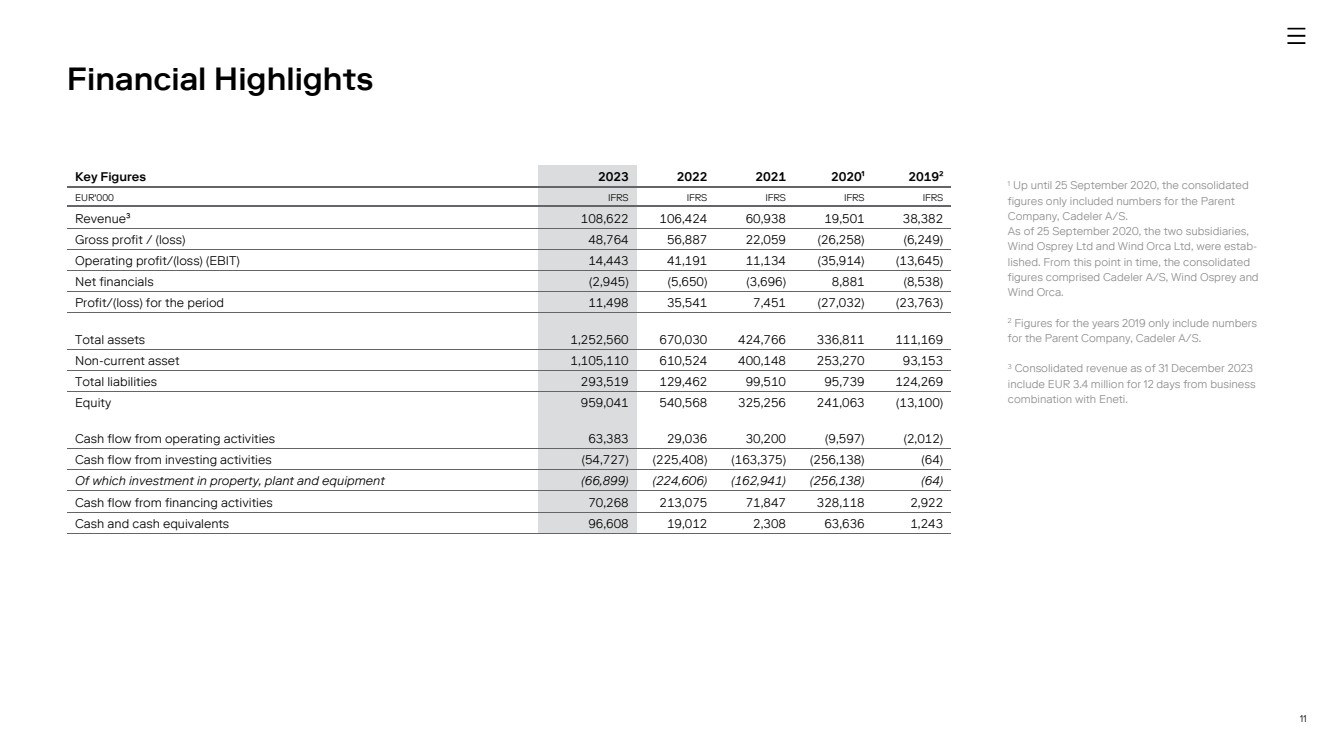
11 Financial Highlights 1 Up until 25 September 2020, the consolidated figures only included numbers for the Parent Company, Cadeler A/S. As of 25 September 2020, the two subsidiaries, Wind Osprey Ltd and Wind Orca Ltd, were estab-lished. From this point in time, the consolidated figures comprised Cadeler A/S, Wind Osprey and Wind Orca. 2 Figures for the years 2019 only include numbers for the Parent Company, Cadeler A/S. 3 Consolidated revenue as of 31 December 2023 include EUR 3.4 million for 12 days from business combination with Eneti. Key Figures 2023 2022 2021 2020¹ 2019² EUR'000 IFRS IFRS IFRS IFRS IFRS Revenue³ 108,622 106,424 60,938 19,501 38,382 Gross profit / (loss) 48,764 56,887 22,059 (26,258) (6,249) Operating profit/(loss) (EBIT) 14,443 41,191 11,134 (35,914) (13,645) Net financials (2,945) (5,650) (3,696) 8,881 (8,538) Profit/(loss) for the period 11,498 35,541 7,451 (27,032) (23,763) Total assets 1,252,560 670,030 424,766 336,811 111,169 Non-current asset 1,105,110 610,524 400,148 253,270 93,153 Total liabilities 293,519 129,462 99,510 95,739 124,269 Equity 959,041 540,568 325,256 241,063 (13,100) Cash flow from operating activities 63,383 29,036 30,200 (9,597) (2,012) Cash flow from investing activities (54,727) (225,408) (163,375) (256,138) (64) Of which investment in property, plant and equipment (66,899) (224,606) (162,941) (256,138) (64) Cash flow from financing activities 70,268 213,075 71,847 328,118 2,922 Cash and cash equivalents 96,608 19,012 2,308 63,636 1,243 |
|
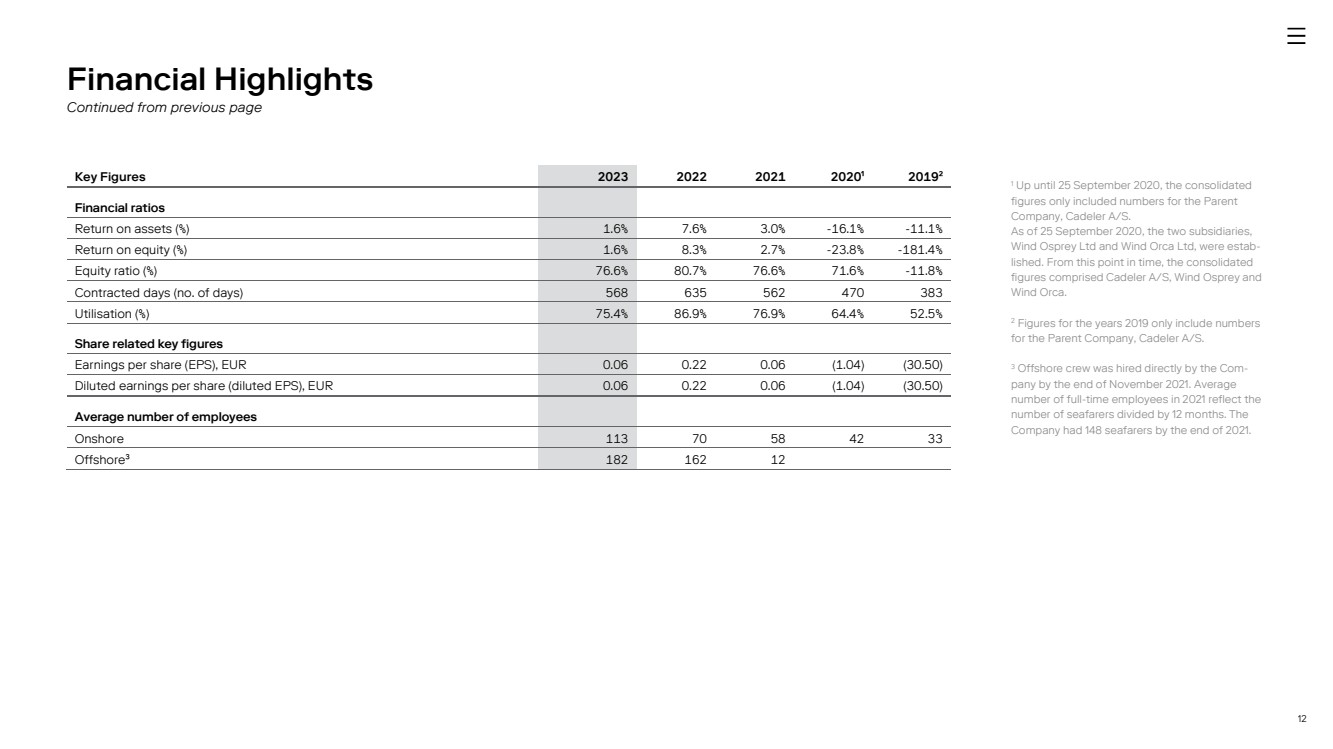
12 Key Figures 2023 2022 2021 2020¹ 2019² Financial ratios Return on assets (%) 1.6% 7.6% 3.0% -16.1% -11.1% Return on equity (%) 1.6% 8.3% 2.7% -23.8% -181.4% Equity ratio (%) 76.6% 80.7% 76.6% 71.6% -11.8% Contracted days (no. of days) 568 635 562 470 383 Utilisation (%) 75.4% 86.9% 76.9% 64.4% 52.5% Share related key figures Earnings per share (EPS), EUR 0.06 0.22 0.06 (1.04) (30.50) Diluted earnings per share (diluted EPS), EUR 0.06 0.22 0.06 (1.04) (30.50) Average number of employees Onshore 113 70 58 42 33 Offshore³ 182 162 12 Financial Highlights Continued from previous page 1 Up until 25 September 2020, the consolidated figures only included numbers for the Parent Company, Cadeler A/S. As of 25 September 2020, the two subsidiaries, Wind Osprey Ltd and Wind Orca Ltd, were estab-lished. From this point in time, the consolidated figures comprised Cadeler A/S, Wind Osprey and Wind Orca. 2 Figures for the years 2019 only include numbers for the Parent Company, Cadeler A/S. 3 Offshore crew was hired directly by the Com-pany by the end of November 2021. Average number of full-time employees in 2021 reflect the number of seafarers divided by 12 months. The Company had 148 seafarers by the end of 2021. |
|
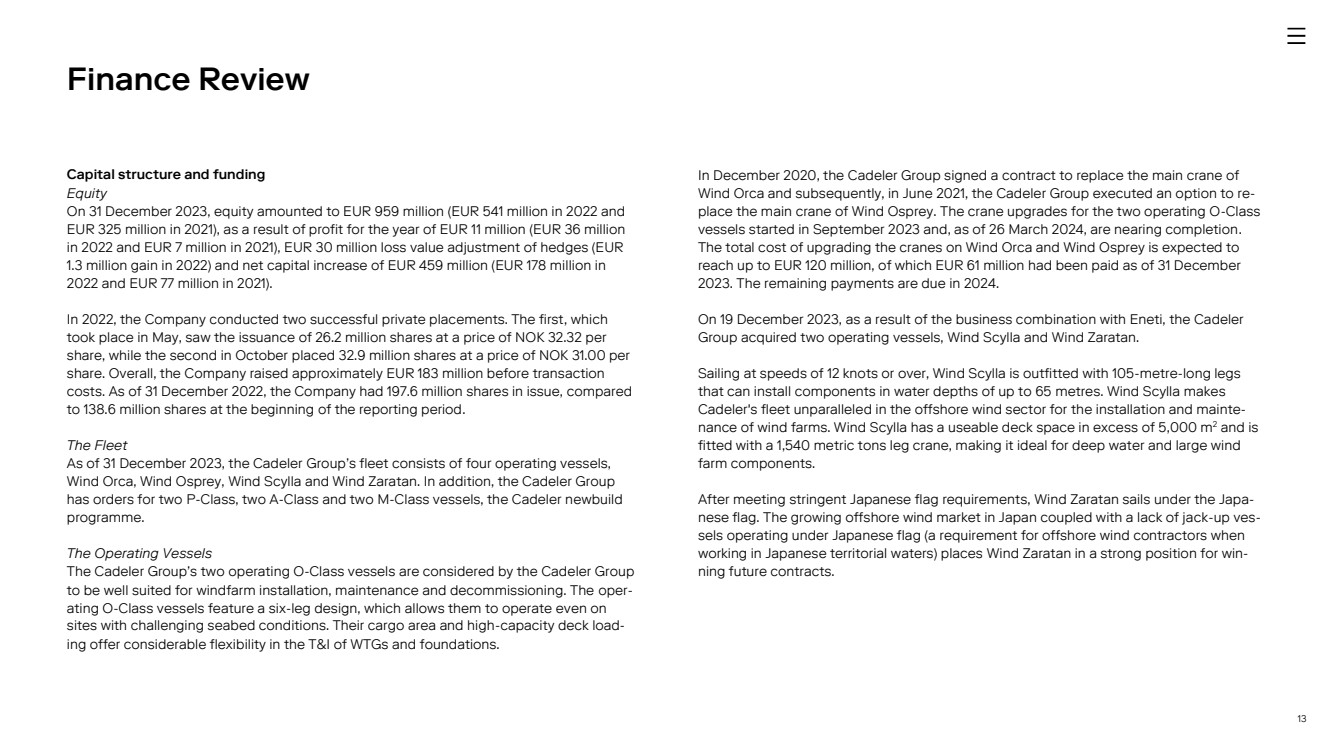
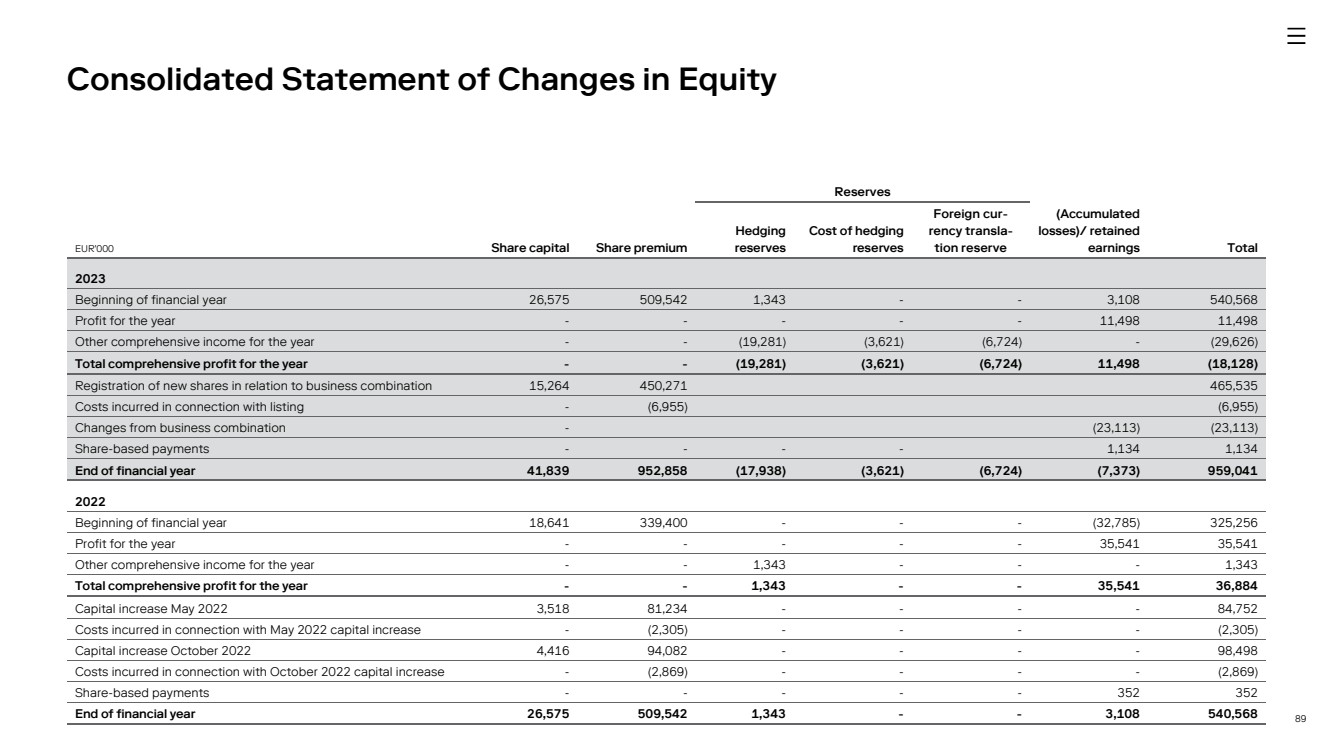
13 Capital structure and funding Equity On 31 December 2023, equity amounted to EUR 959 million (EUR 541 million in 2022 and EUR 325 million in 2021), as a result of profit for the year of EUR 11 million (EUR 36 million in 2022 and EUR 7 million in 2021), EUR 30 million loss value adjustment of hedges (EUR 1.3 million gain in 2022) and net capital increase of EUR 459 million (EUR 178 million in 2022 and EUR 77 million in 2021). In 2022, the Company conducted two successful private placements. The first, which took place in May, saw the issuance of 26.2 million shares at a price of NOK 32.32 per share, while the second in October placed 32.9 million shares at a price of NOK 31.00 per share. Overall, the Company raised approximately EUR 183 million before transaction costs. As of 31 December 2022, the Company had 197.6 million shares in issue, compared to 138.6 million shares at the beginning of the reporting period. The Fleet As of 31 December 2023, the Cadeler Group’s fleet consists of four operating vessels, Wind Orca, Wind Osprey, Wind Scylla and Wind Zaratan. In addition, the Cadeler Group has orders for two P-Class, two A-Class and two M-Class vessels, the Cadeler newbuild programme. The Operating Vessels The Cadeler Group’s two operating O-Class vessels are considered by the Cadeler Group to be well suited for windfarm installation, maintenance and decommissioning. The oper-ating O-Class vessels feature a six-leg design, which allows them to operate even on sites with challenging seabed conditions. Their cargo area and high-capacity deck load-ing offer considerable flexibility in the T&I of WTGs and foundations. In December 2020, the Cadeler Group signed a contract to replace the main crane of Wind Orca and subsequently, in June 2021, the Cadeler Group executed an option to re-place the main crane of Wind Osprey. The crane upgrades for the two operating O-Class vessels started in September 2023 and, as of 26 March 2024, are nearing completion. The total cost of upgrading the cranes on Wind Orca and Wind Osprey is expected to reach up to EUR 120 million, of which EUR 61 million had been paid as of 31 December 2023. The remaining payments are due in 2024. On 19 December 2023, as a result of the business combination with Eneti, the Cadeler Group acquired two operating vessels, Wind Scylla and Wind Zaratan. Sailing at speeds of 12 knots or over, Wind Scylla is outfitted with 105-metre-long legs that can install components in water depths of up to 65 metres. Wind Scylla makes Cadeler's fleet unparalleled in the offshore wind sector for the installation and mainte-nance of wind farms. Wind Scylla has a useable deck space in excess of 5,000 m2 and is fitted with a 1,540 metric tons leg crane, making it ideal for deep water and large wind farm components. After meeting stringent Japanese flag requirements, Wind Zaratan sails under the Japa-nese flag. The growing offshore wind market in Japan coupled with a lack of jack-up ves-sels operating under Japanese flag (a requirement for offshore wind contractors when working in Japanese territorial waters) places Wind Zaratan in a strong position for win-ning future contracts. Finance Review |
|
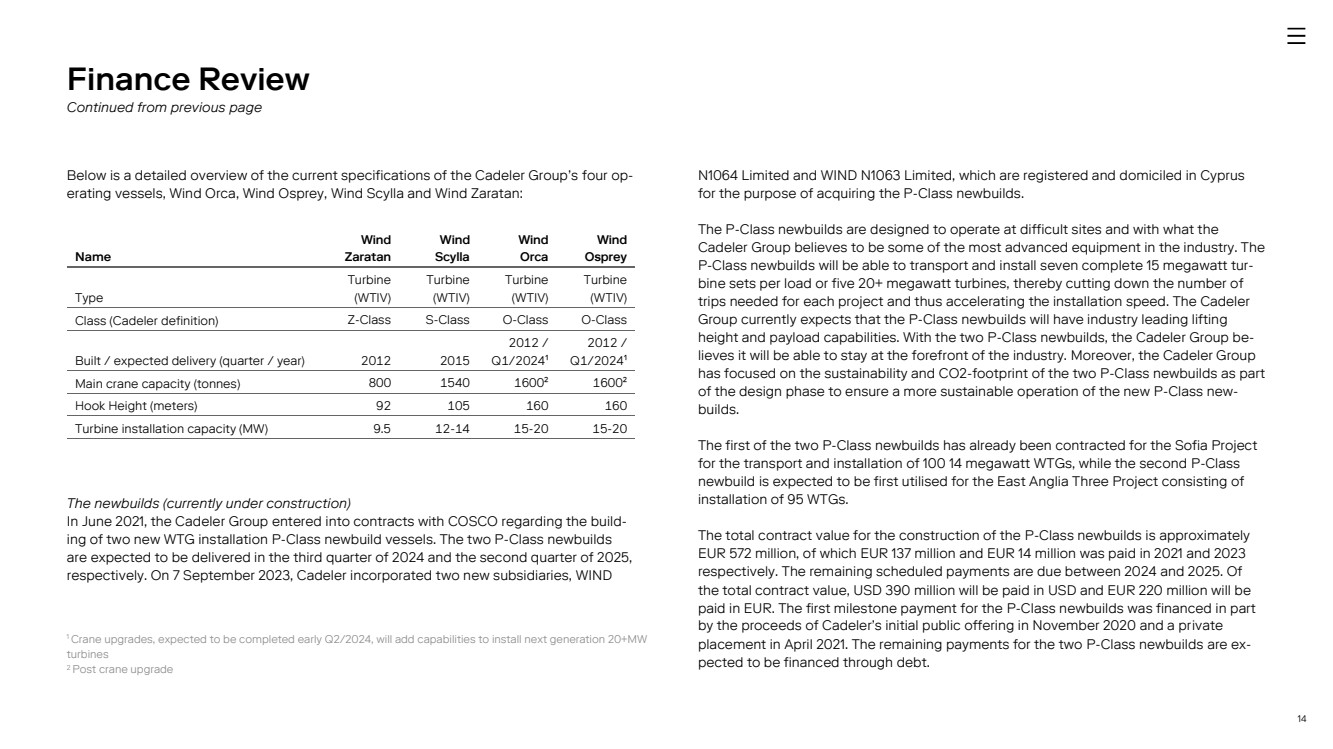
14 Below is a detailed overview of the current specifications of the Cadeler Group’s four op-erating vessels, Wind Orca, Wind Osprey, Wind Scylla and Wind Zaratan: The newbuilds (currently under construction) In June 2021, the Cadeler Group entered into contracts with COSCO regarding the build-ing of two new WTG installation P-Class newbuild vessels. The two P-Class newbuilds are expected to be delivered in the third quarter of 2024 and the second quarter of 2025, respectively. On 7 September 2023, Cadeler incorporated two new subsidiaries, WIND N1064 Limited and WIND N1063 Limited, which are registered and domiciled in Cyprus for the purpose of acquiring the P-Class newbuilds. The P-Class newbuilds are designed to operate at difficult sites and with what the Cadeler Group believes to be some of the most advanced equipment in the industry. The P-Class newbuilds will be able to transport and install seven complete 15 megawatt tur-bine sets per load or five 20+ megawatt turbines, thereby cutting down the number of trips needed for each project and thus accelerating the installation speed. The Cadeler Group currently expects that the P-Class newbuilds will have industry leading lifting height and payload capabilities. With the two P-Class newbuilds, the Cadeler Group be-lieves it will be able to stay at the forefront of the industry. Moreover, the Cadeler Group has focused on the sustainability and CO2-footprint of the two P-Class newbuilds as part of the design phase to ensure a more sustainable operation of the new P-Class new-builds. The first of the two P-Class newbuilds has already been contracted for the Sofia Project for the transport and installation of 100 14 megawatt WTGs, while the second P-Class newbuild is expected to be first utilised for the East Anglia Three Project consisting of installation of 95 WTGs. The total contract value for the construction of the P-Class newbuilds is approximately EUR 572 million, of which EUR 137 million and EUR 14 million was paid in 2021 and 2023 respectively. The remaining scheduled payments are due between 2024 and 2025. Of the total contract value, USD 390 million will be paid in USD and EUR 220 million will be paid in EUR. The first milestone payment for the P-Class newbuilds was financed in part by the proceeds of Cadeler’s initial public offering in November 2020 and a private placement in April 2021. The remaining payments for the two P-Class newbuilds are ex-pected to be financed through debt. Finance Review Continued from previous page 1 Crane upgrades, expected to be completed early Q2/2024, will add capabilities to install next generation 20+MW turbines 2 Post crane upgrade Name Wind Zaratan Wind Scylla Wind Orca Wind Osprey Type Turbine (WTIV) Turbine (WTIV) Turbine (WTIV) Turbine (WTIV) Class (Cadeler definition) Z-Class S-Class O-Class O-Class Built / expected delivery (quarter / year) 2012 2015 2012 / Q1/2024¹ 2012 / Q1/2024¹ Main crane capacity (tonnes) 800 1540 1600² 1600² Hook Height (meters) 92 105 160 160 Turbine installation capacity (MW) 9.5 12-14 15-20 15-20 |
|
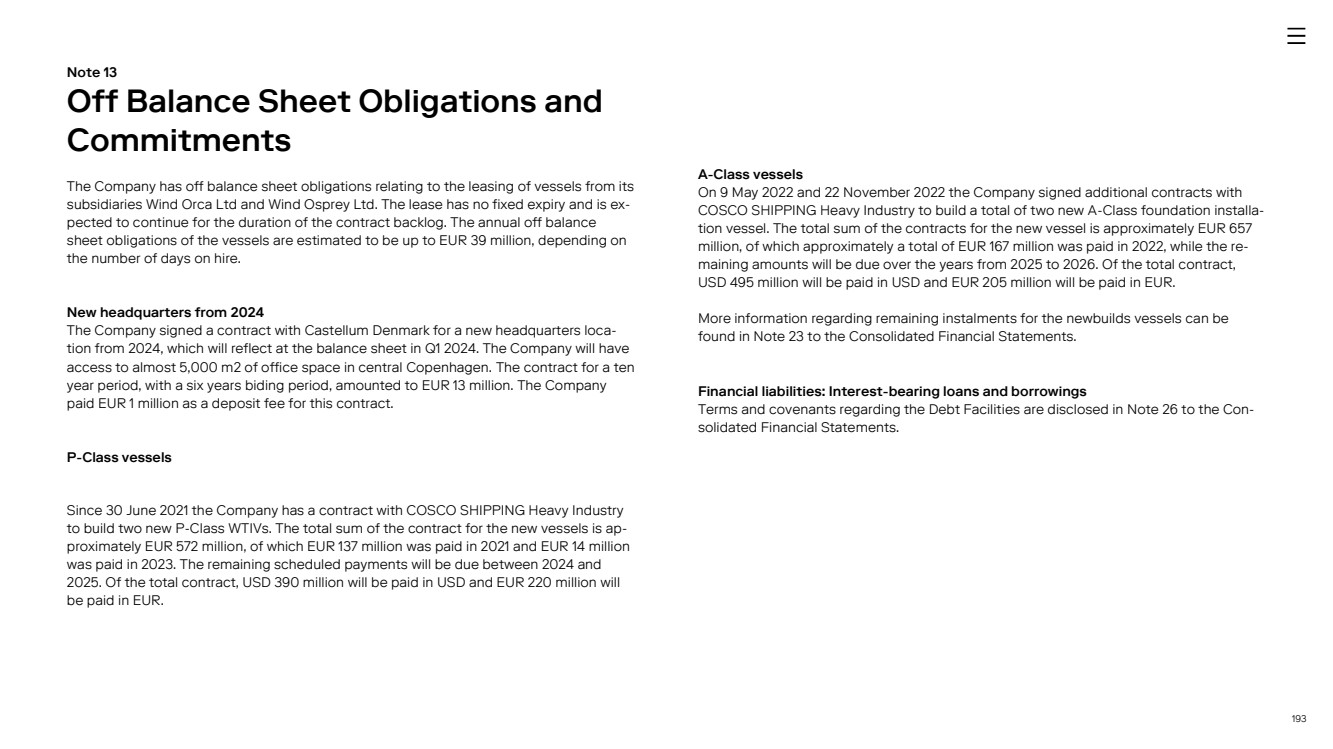
15 Cadeler Group has also placed orders with COSCO for the construction of two A-Class newbuilds. In May 2022, the Cadeler Group signed a contract with COSCO regarding the building of one A-Class newbuild WTIV expected to be delivered in the fourth quarter of 2025. The contract included an option for one additional P-Class or A-Class vessel. The Cadeler Group has experienced strong employment prospects for the A-Class newbuild, which was evidenced by the Cadeler Group’s contract with Ørsted A/S (“Ørsted”) for foundation installation at Hornsea 3 offshore wind farm, which is set to utilise one A-Class newbuild. As a result, in November 2022, the Cadeler Group exercised the option to order one additional A-Class newbuild, which is expected to be delivered in the sec-ond half of 2026. This A-Class newbuild will upon delivery be the second purpose-built wind foundation installation vessel in the Cadeler Group’s fleet. In connection with the exercise of the option, and entering into a definitive contract, the Cadeler Group has en-tered into a letter of intent regarding the construction of an additional A-Class newbuild vessel. The A-Class newbuilds are based on the P-Class specifications and will be hybrid vessels for T&I of both foundations and WTGs. The A-Class newbuilds will be able to transport up to six XL monopile foundations per round trip and, if needed, may within a short period of time be converted from being a foundation installation vessel to a WTG installation ves-sel. The A-Class newbuilds will, as the P-Class newbuilds, be able to transport and install seven complete 15 megawatt turbine sets per load or five 20+ megawatt turbines, thereby cutting down the number of trips needed for each project and thus accelerating the installation speed. The Cadeler Group believes the large transport capacity will in-crease operational efficiency substantially. The total value of the contracts for the A-Class newbuilds is approximately EUR 657 mil-lion. After down payments of an aggregate EUR 167 million in June 2022 and December 2022, financed through private placements completed in May and October 2022, respec-tively, the remaining amounts are due in 2025 and 2026. Of the total contract value, USD 495 million will be paid in USD and EUR 205 million will be paid in EUR. The remaining payments on the A-Class newbuilds are currently expected to be financed through se-cured senior debt and cash flow from the operations. On 19 December 2023, as a result of the Business Combination with Eneti, the Cadeler Group added two M-Class vessels to its newbuild vessels, for the construction of which there are two contracts in place with Hanwha. The M-Class newbuilds, Wind Maker (formerly known as “Nessie”) and Wind Mover (for-merly known as “Siren”), will operate with an impressive high capacity 2,600 metric tons main crane which will revolve around the starboard aft leg, allowing the safe installation and maintenance of heavy foundations and the components relating to offshore wind turbines. Both vessels have been designed to operate in water depths of up to 65 me-tres and at significant wave heights of 2 metres whilst the vessel itself will be above sea level installing and maintaining offshore structures. Finance Review Continued from previous page |
|
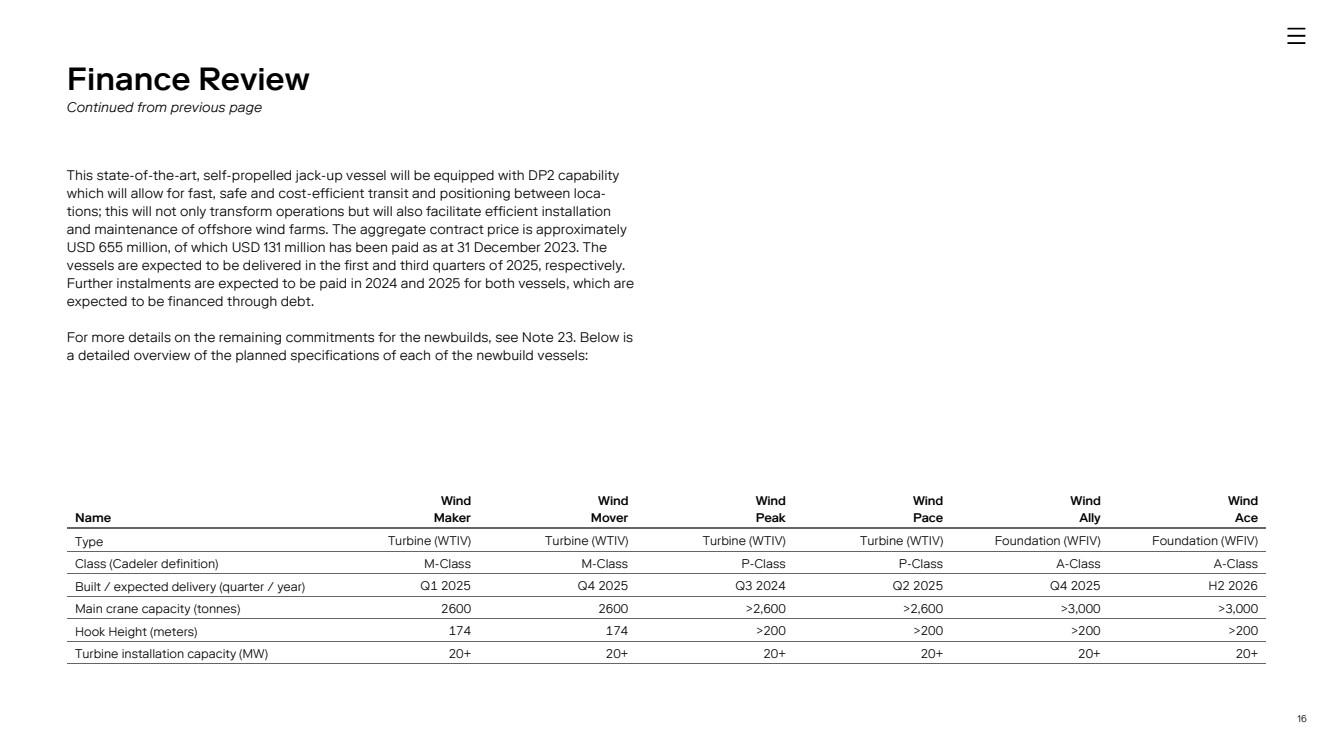
16 This state-of-the-art, self-propelled jack-up vessel will be equipped with DP2 capability which will allow for fast, safe and cost-efficient transit and positioning between loca-tions; this will not only transform operations but will also facilitate efficient installation and maintenance of offshore wind farms. The aggregate contract price is approximately USD 655 million, of which USD 131 million has been paid as at 31 December 2023. The vessels are expected to be delivered in the first and third quarters of 2025, respectively. Further instalments are expected to be paid in 2024 and 2025 for both vessels, which are expected to be financed through debt. For more details on the remaining commitments for the newbuilds, see Note 23. Below is a detailed overview of the planned specifications of each of the newbuild vessels: Finance Review Continued from previous page Name Wind Maker Wind Mover Wind Peak Wind Pace Wind Ally Wind Ace Type Turbine (WTIV) Turbine (WTIV) Turbine (WTIV) Turbine (WTIV) Foundation (WFIV) Foundation (WFIV) Class (Cadeler definition) M-Class M-Class P-Class P-Class A-Class A-Class Built / expected delivery (quarter / year) Q1 2025 Q4 2025 Q3 2024 Q2 2025 Q4 2025 H2 2026 Main crane capacity (tonnes) 2600 2600 >2,600 >2,600 >3,000 >3,000 Hook Height (meters) 174 174 >200 >200 >200 >200 Turbine installation capacity (MW) 20+ 20+ 20+ 20+ 20+ 20+ |
|
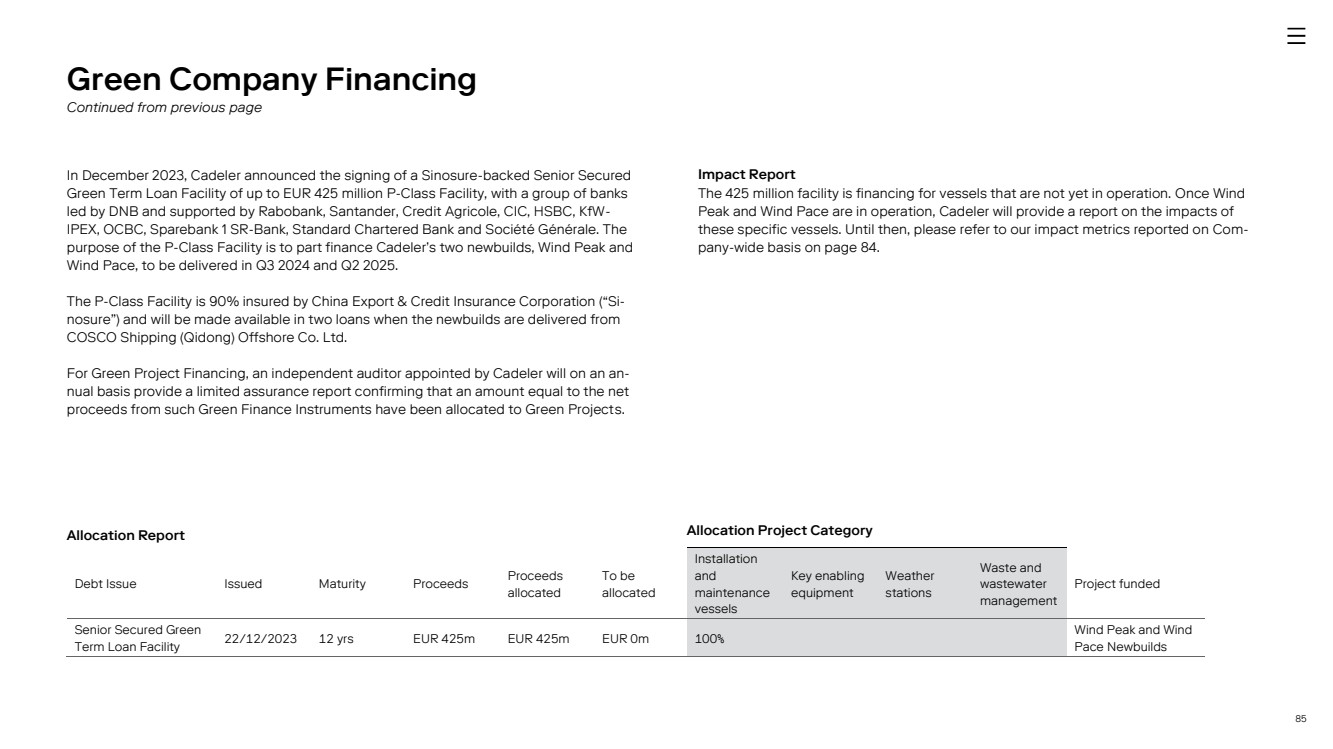
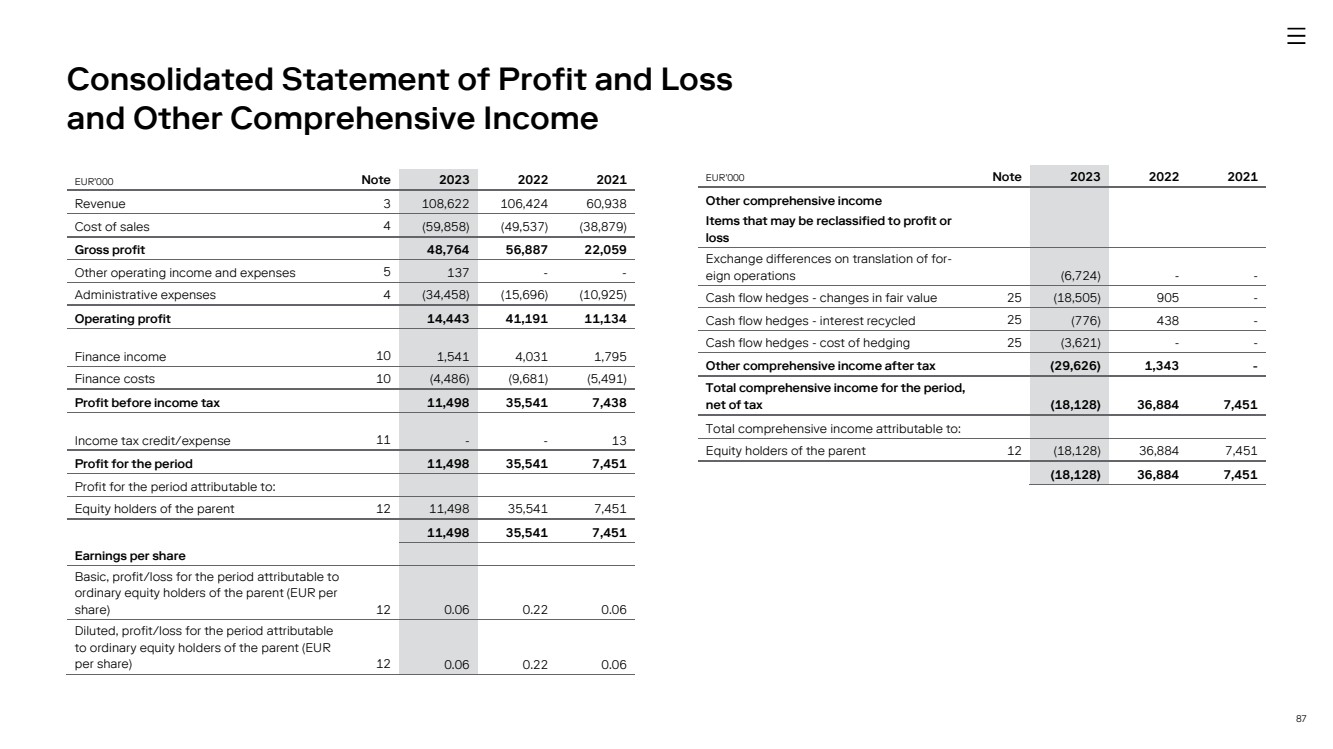
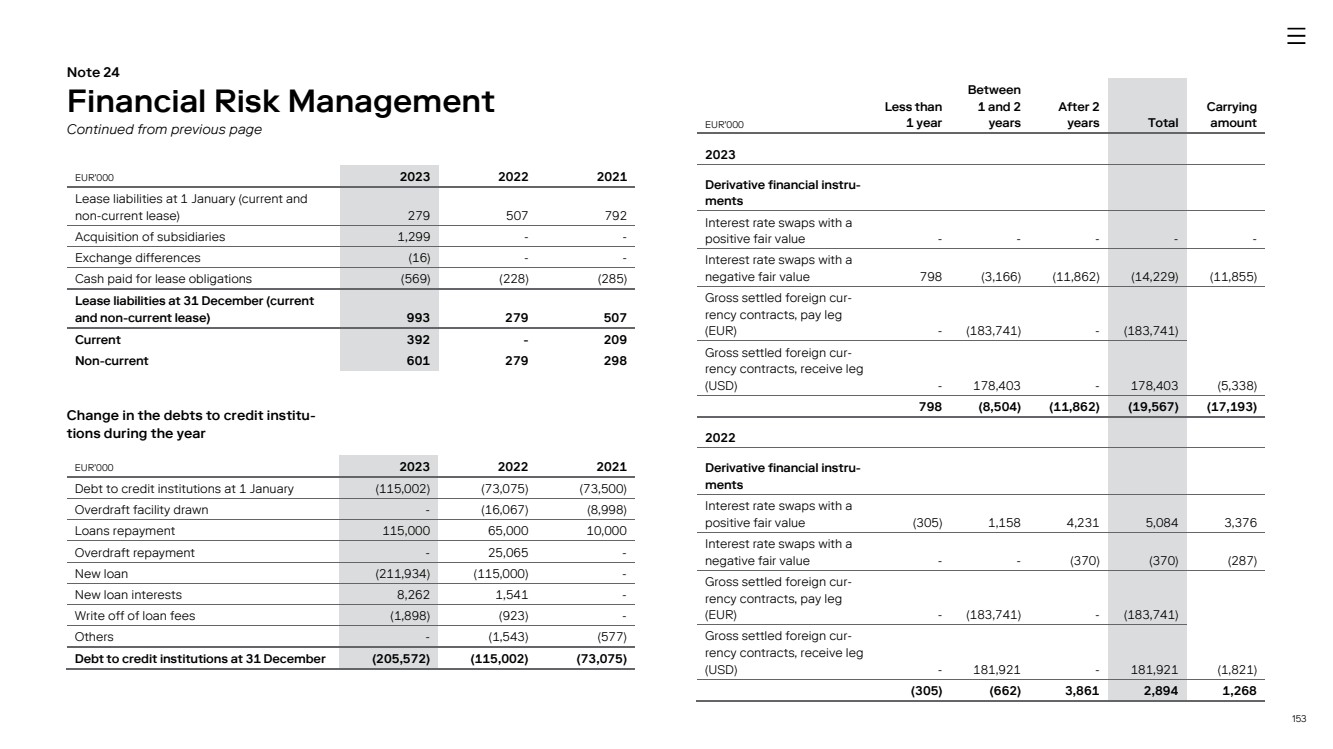
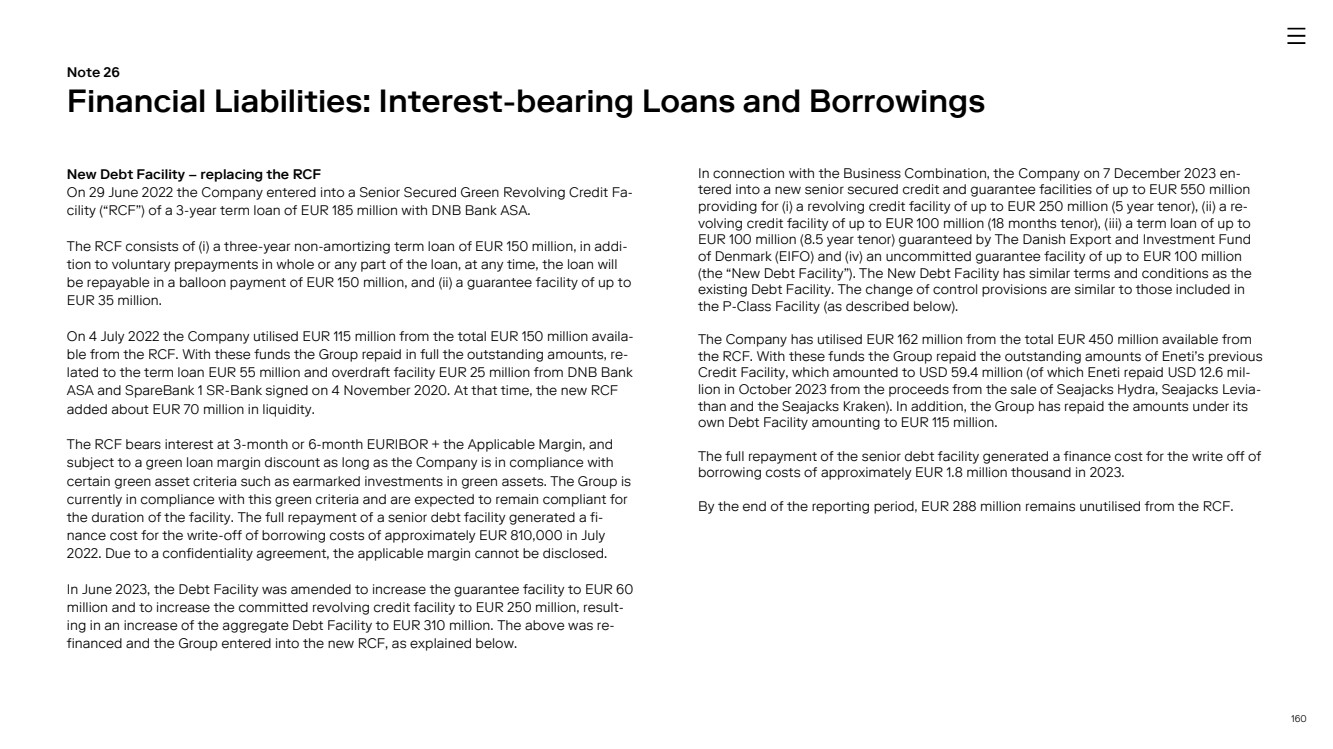
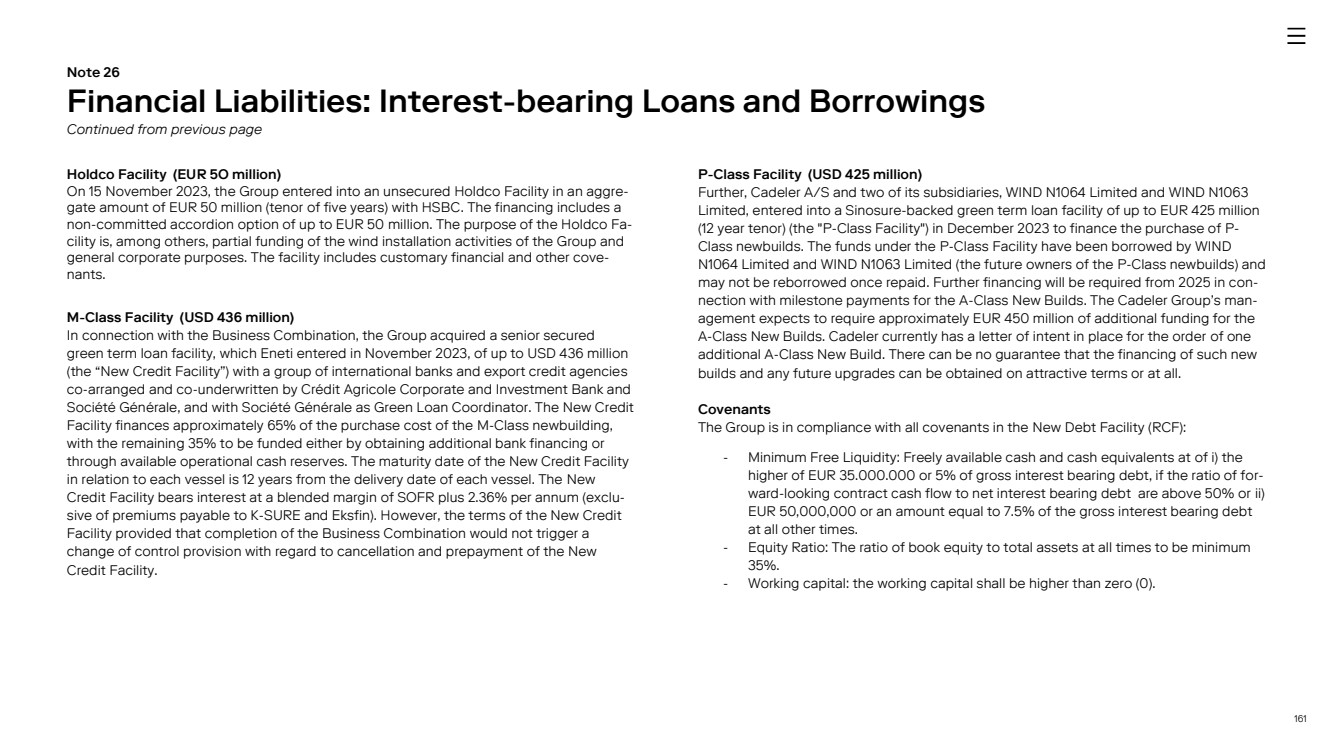
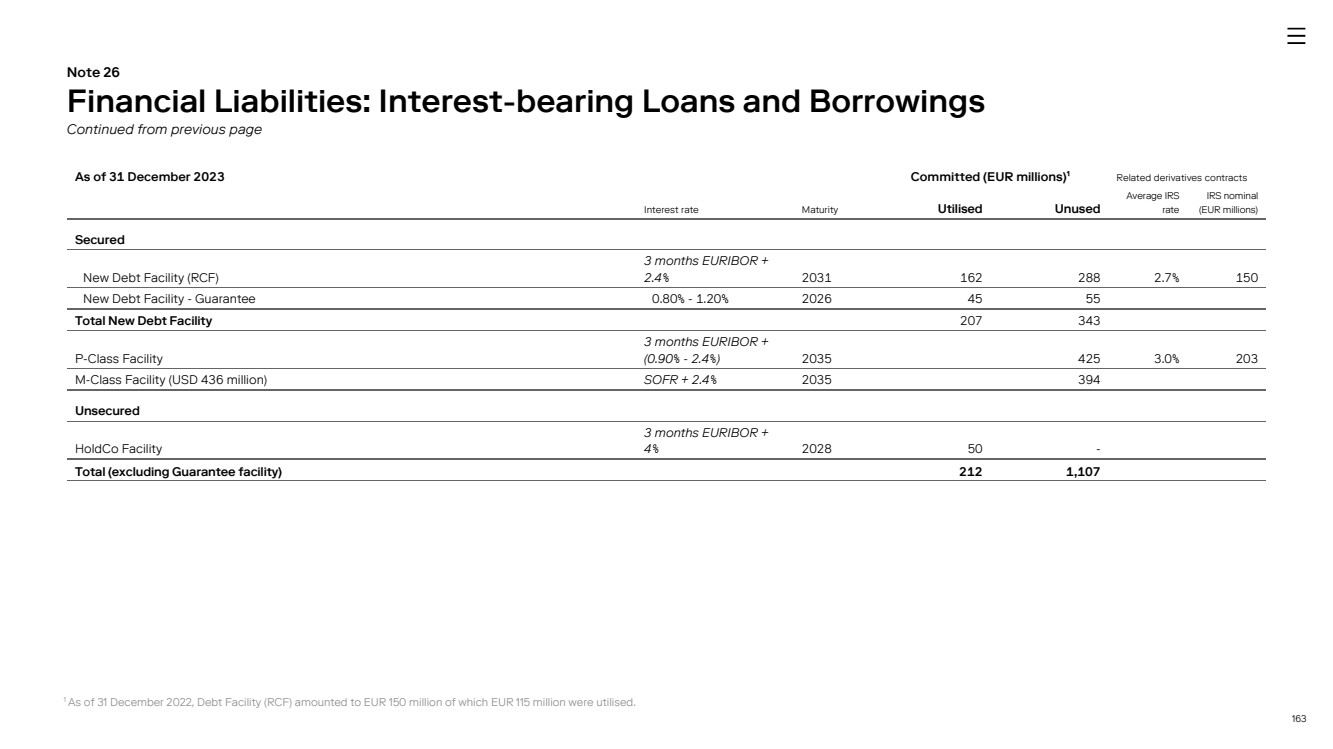
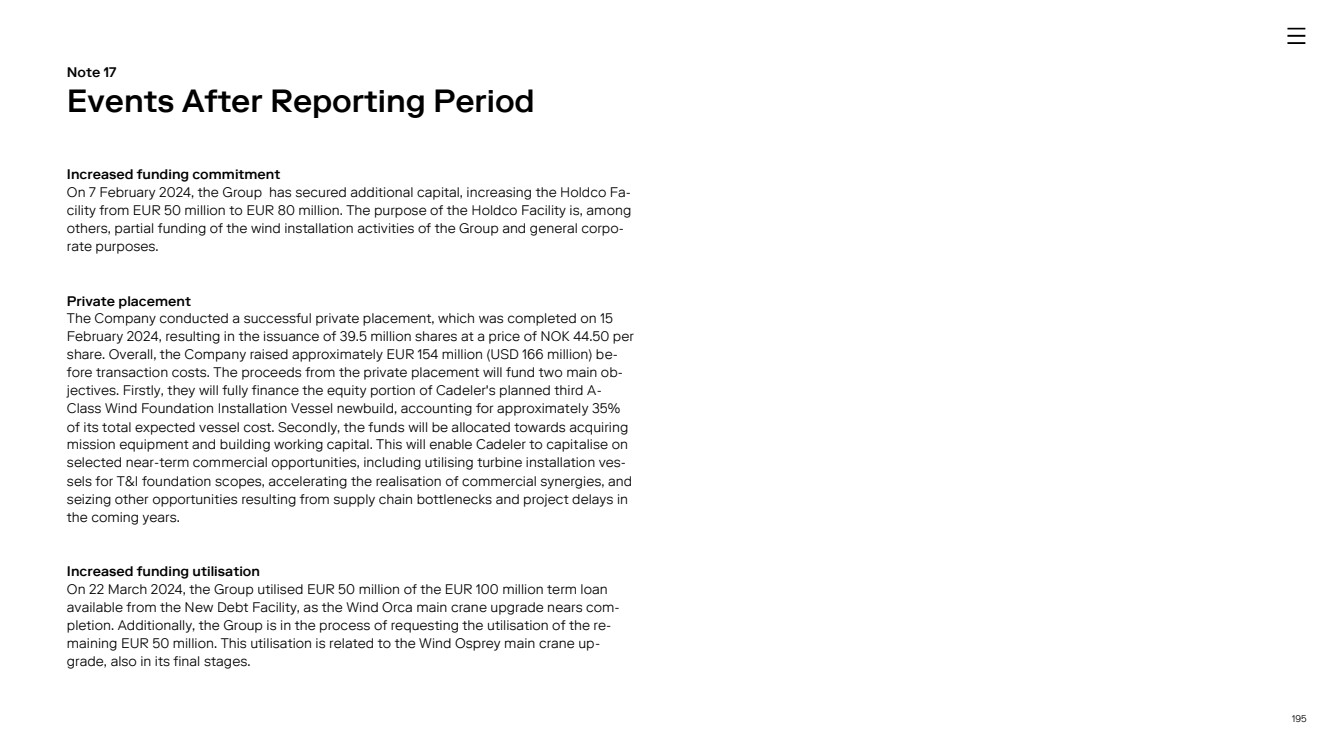
17 Funding On 29 June 2022, the Cadeler Group entered into a senior secured green revolving credit facility (the “Debt Facility”), which provided for a three-year revolving credit facility of up to EUR 185 million. The Debt Facility was entered into for the purpose of refinancing ex-isting facility agreements, obtaining financing for general corporate purposes and work-ing capital requirements. On 16 June 2023, Cadeler amended its Debt Facility, increasing the guarantee facility to EUR 60 million and the committed revolving credit facility to EUR 250 million, resulting in a total Debt Facility of EUR 310 million. Additionally, an accordion option allows for a po-tential EUR 100 million increase by adding a term loan facility, subject to lender discre-tion and export credit agency guarantee. On 7 December 2023, Cadeler secured a new senior secured credit and guarantee facility (the “New Debt Facility”) of up to EUR 550 million with DNB Bank ASA, Rabobank, Credit Agricole, Danske Bank, OCBC, Standard Chartered Bank, and Société Générale. This fa-cility includes various tranches: a revolving credit facility of EUR 250 million (5-year tenor), a revolving credit facility of EUR 100 million (18-month tenor), a term loan of EUR 100 million (8.5-year tenor) guaranteed by the Danish export and Investment Fund of Denmark (EIFO), and an uncommitted guarantee facility of EUR 100 million. On 15 November 2023, Cadeler entered an unsecured term loan facility of EUR 50 million with HSBC, (the “Holdco Facility”), supporting wind installation activities and general cor-porate purposes. This facility includes an accordion option of up to EUR 50 million and contains change of control provisions. On 22 December 2023, Cadeler and its subsidiaries secured a Sinosure-backed green term loan facility of up to EUR 425 million, (the “P-Class Facility”), to finance P-Class newbuilds. This facility includes various securities and change of control provisions. In connection with the Business Combination, the Group acquired a senior secured green term loan facility, which Eneti entered into in November 2023, of up to USD 436 million (the “New Credit Facility”) with a group of international banks and export credit agencies co-arranged and co-underwritten by Crédit Agricole Corporate and Investment Bank and Société Générale, and with Société Générale as Green Loan Coordinator. The New Credit Facility finances approximately 65% of the purchase cost of the M-Class newbuilds. Additional financing of approximately EUR 450 million will be required from 2025 for A-Class newbuilds milestone payments. The Group entered into interest rate swap con-tracts with the Group’s main bank and related these to the RCF and the future loans. The interest rate risk arising from the loans have been partially swapped from 3M EURIBOR to a fixed rate. The average fixed rate of the swaps is 2.8%. Income statement Revenue In 2023, the Company saw a modest revenue growth of 2%, amounting to EUR 109 mil-lion. Despite a lower utilisation rate of 75% due to upgrades on Wind Orca and Wind Os-prey in Q4 2023, the revenue growth is commendable. Additional revenue streams in-cluded EUR 3.4 million from the business combination with Eneti and a further EUR 5 mil-lion from the cancellation of the Aflandshage contract. Costs Cost of sales for 2023 rose by 20% to EUR 60 million, up from EUR 50 million the previ-ous year. This increase was largely due to the impairment of the sold main crane for Wind Orca, costing EUR 5 million. Other contributing factors include an additional EUR 3.8 mil-lion from the business combination with Eneti. Finance Review Continued from previous page |
|
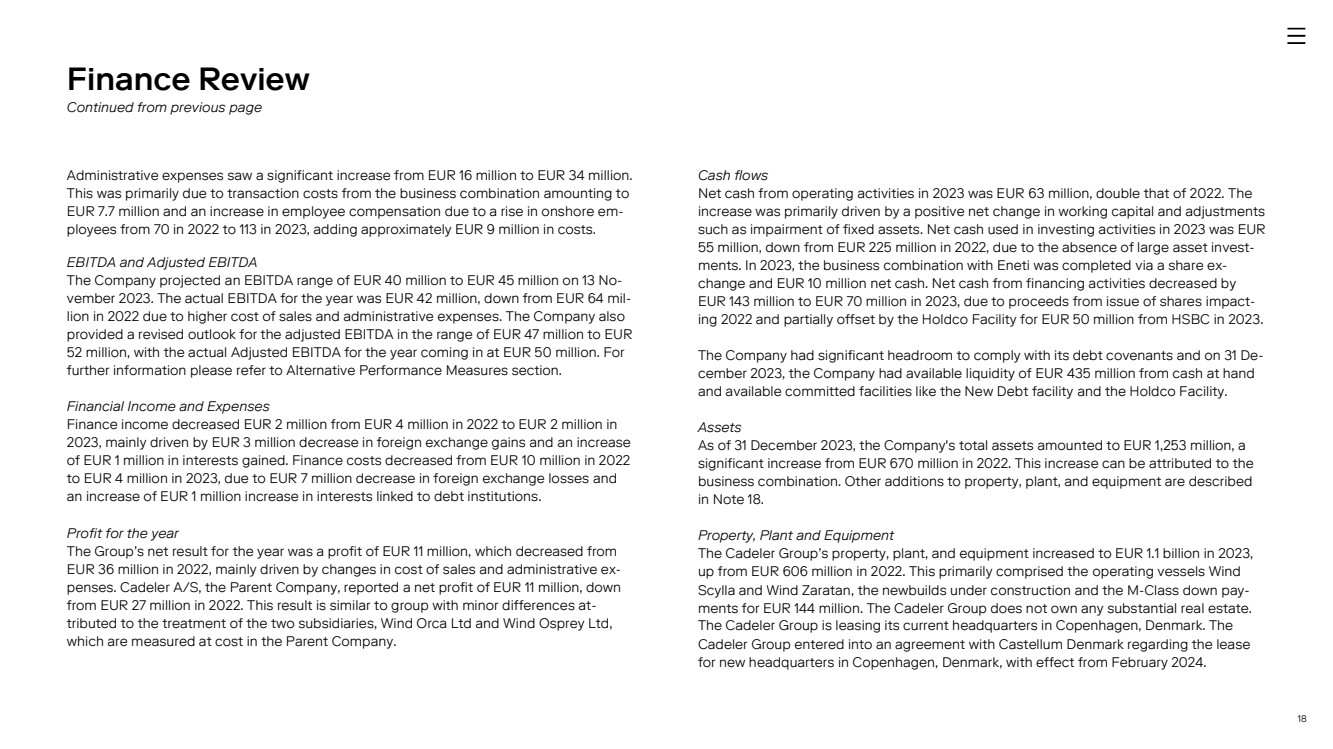
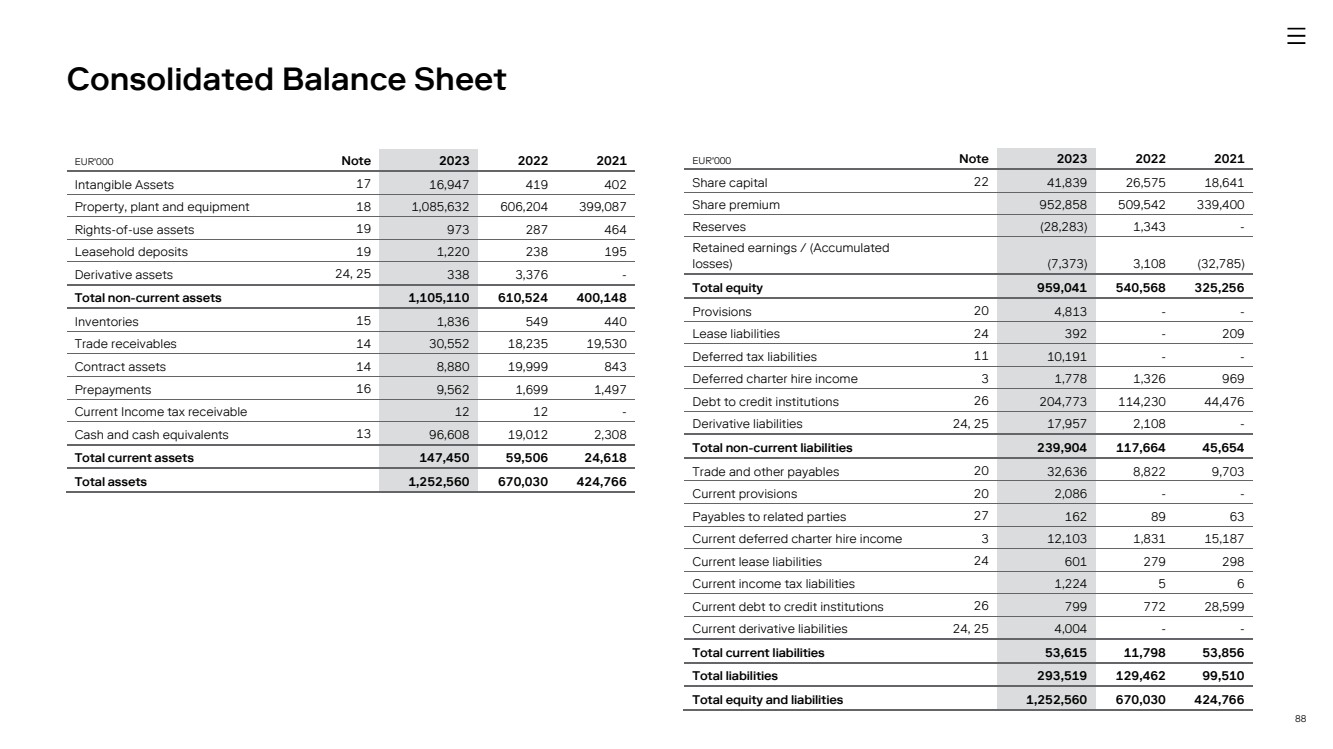
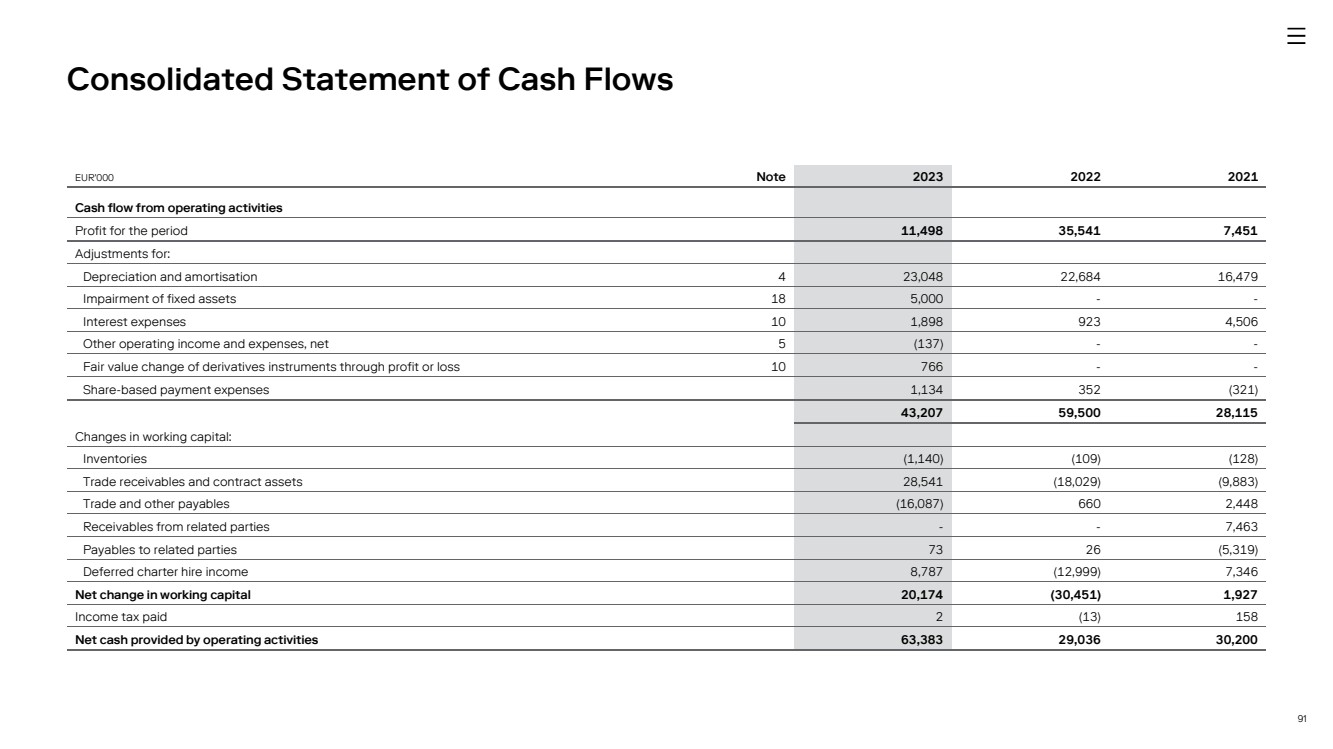
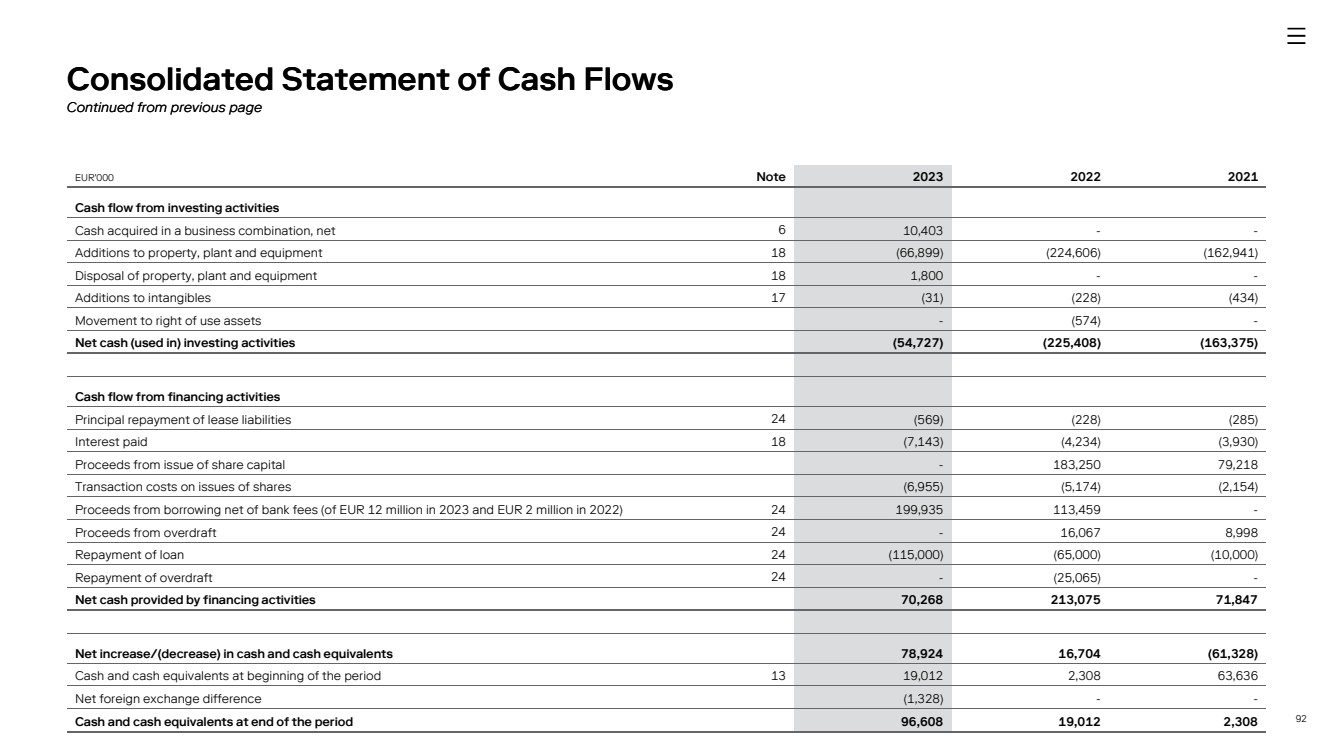
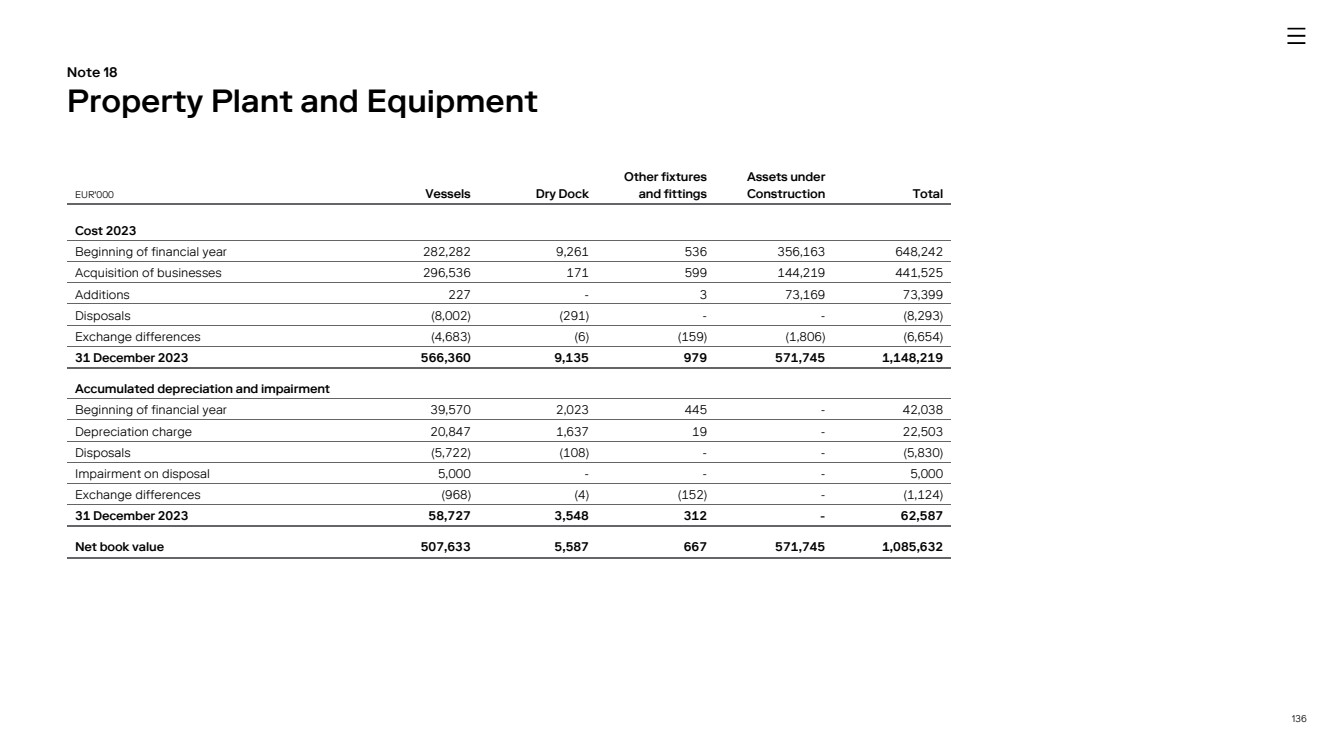
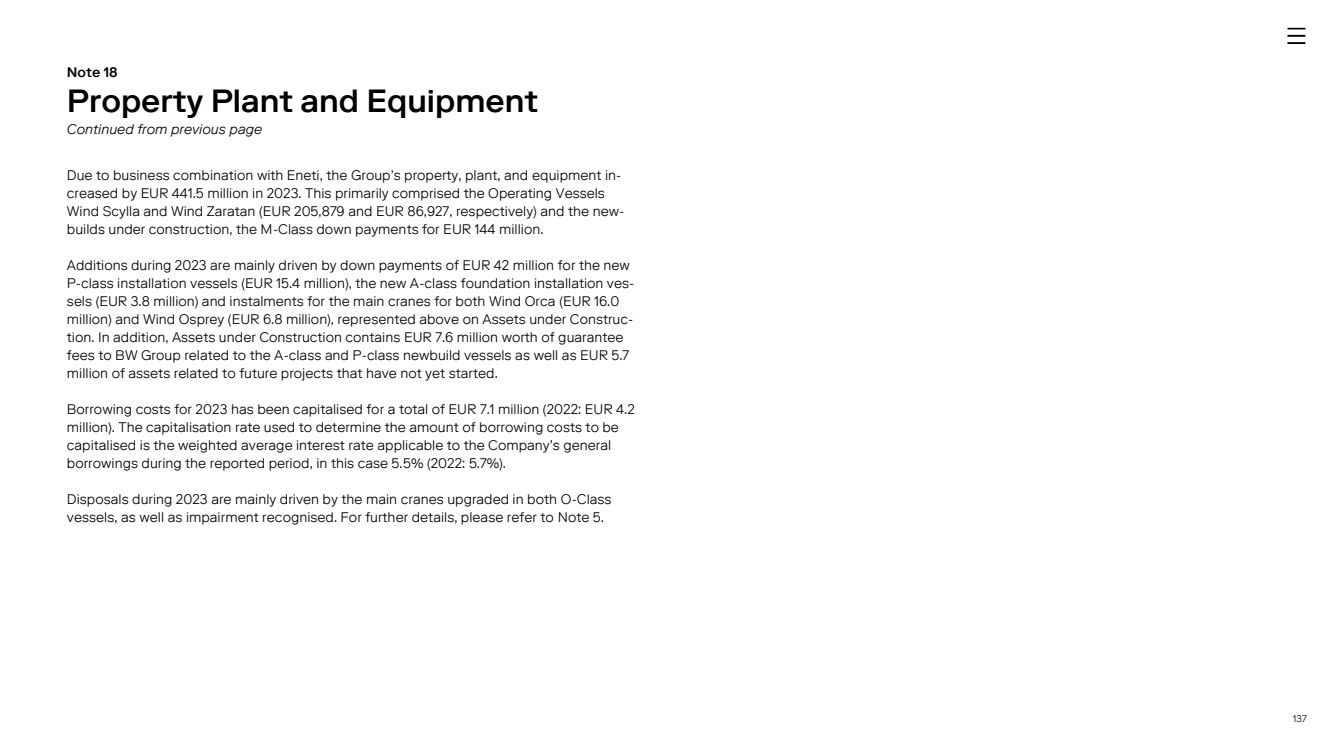
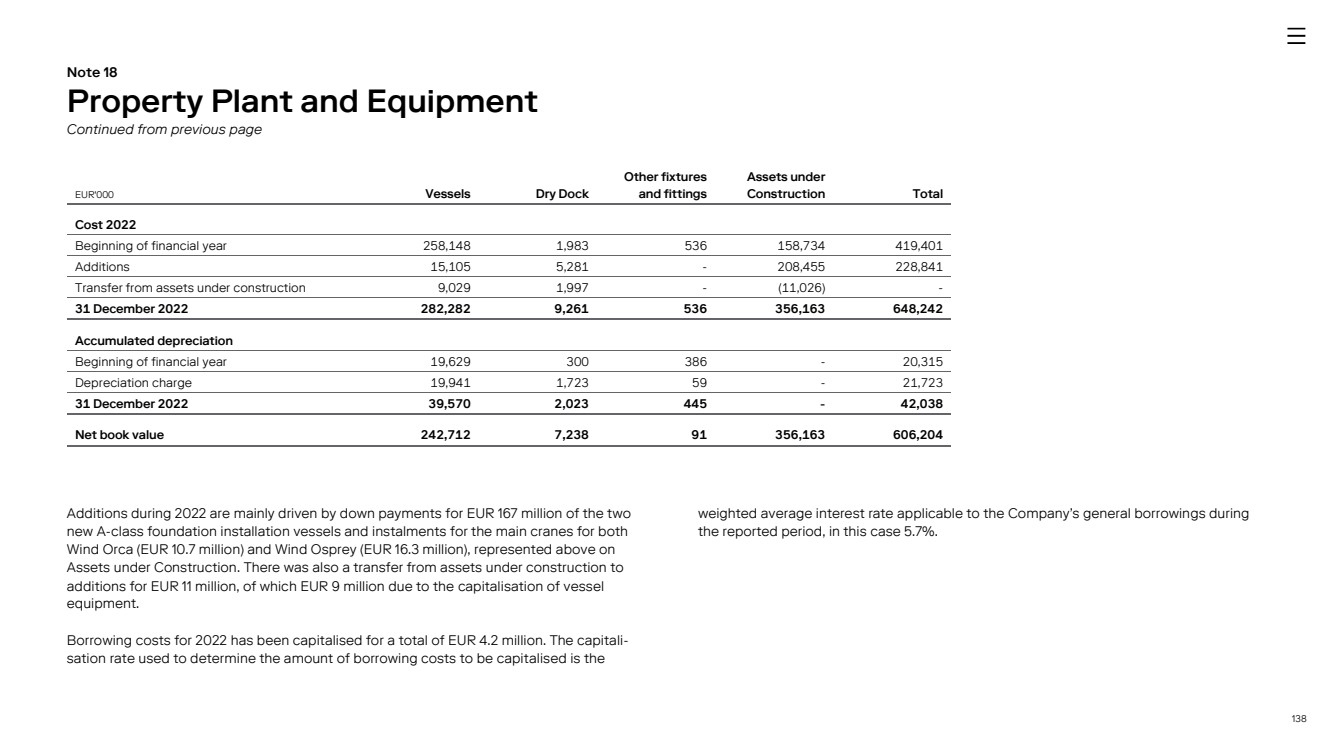
18 Administrative expenses saw a significant increase from EUR 16 million to EUR 34 million. This was primarily due to transaction costs from the business combination amounting to EUR 7.7 million and an increase in employee compensation due to a rise in onshore em-ployees from 70 in 2022 to 113 in 2023, adding approximately EUR 9 million in costs. EBITDA and Adjusted EBITDA The Company projected an EBITDA range of EUR 40 million to EUR 45 million on 13 No-vember 2023. The actual EBITDA for the year was EUR 42 million, down from EUR 64 mil-lion in 2022 due to higher cost of sales and administrative expenses. The Company also provided a revised outlook for the adjusted EBITDA in the range of EUR 47 million to EUR 52 million, with the actual Adjusted EBITDA for the year coming in at EUR 50 million. For further information please refer to Alternative Performance Measures section. Financial Income and Expenses Finance income decreased EUR 2 million from EUR 4 million in 2022 to EUR 2 million in 2023, mainly driven by EUR 3 million decrease in foreign exchange gains and an increase of EUR 1 million in interests gained. Finance costs decreased from EUR 10 million in 2022 to EUR 4 million in 2023, due to EUR 7 million decrease in foreign exchange losses and an increase of EUR 1 million increase in interests linked to debt institutions. Profit for the year The Group’s net result for the year was a profit of EUR 11 million, which decreased from EUR 36 million in 2022, mainly driven by changes in cost of sales and administrative ex-penses. Cadeler A/S, the Parent Company, reported a net profit of EUR 11 million, down from EUR 27 million in 2022. This result is similar to group with minor differences at-tributed to the treatment of the two subsidiaries, Wind Orca Ltd and Wind Osprey Ltd, which are measured at cost in the Parent Company. Cash flows Net cash from operating activities in 2023 was EUR 63 million, double that of 2022. The increase was primarily driven by a positive net change in working capital and adjustments such as impairment of fixed assets. Net cash used in investing activities in 2023 was EUR 55 million, down from EUR 225 million in 2022, due to the absence of large asset invest-ments. In 2023, the business combination with Eneti was completed via a share ex-change and EUR 10 million net cash. Net cash from financing activities decreased by EUR 143 million to EUR 70 million in 2023, due to proceeds from issue of shares impact-ing 2022 and partially offset by the Holdco Facility for EUR 50 million from HSBC in 2023. The Company had significant headroom to comply with its debt covenants and on 31 De-cember 2023, the Company had available liquidity of EUR 435 million from cash at hand and available committed facilities like the New Debt facility and the Holdco Facility. Assets As of 31 December 2023, the Company's total assets amounted to EUR 1,253 million, a significant increase from EUR 670 million in 2022. This increase can be attributed to the business combination. Other additions to property, plant, and equipment are described in Note 18. Property, Plant and Equipment The Cadeler Group’s property, plant, and equipment increased to EUR 1.1 billion in 2023, up from EUR 606 million in 2022. This primarily comprised the operating vessels Wind Scylla and Wind Zaratan, the newbuilds under construction and the M-Class down pay-ments for EUR 144 million. The Cadeler Group does not own any substantial real estate. The Cadeler Group is leasing its current headquarters in Copenhagen, Denmark. The Cadeler Group entered into an agreement with Castellum Denmark regarding the lease for new headquarters in Copenhagen, Denmark, with effect from February 2024. Finance Review Continued from previous page |
|
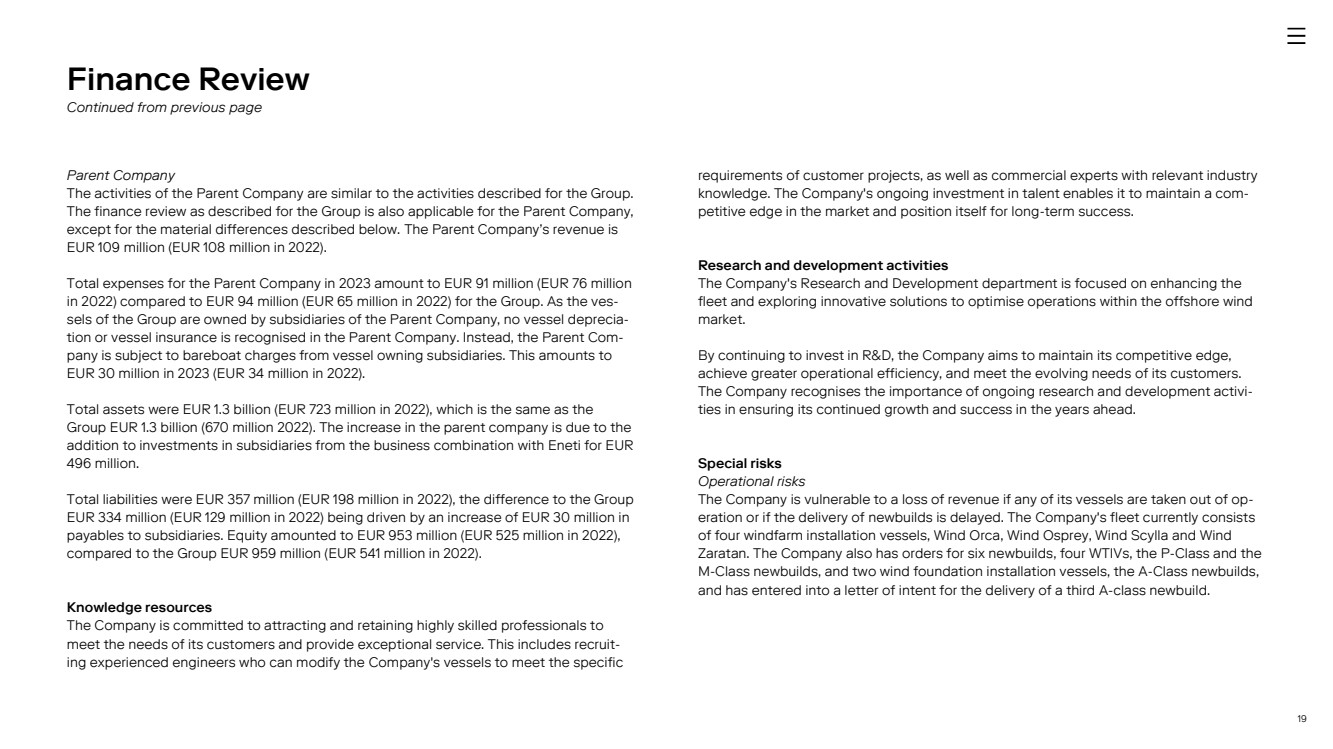
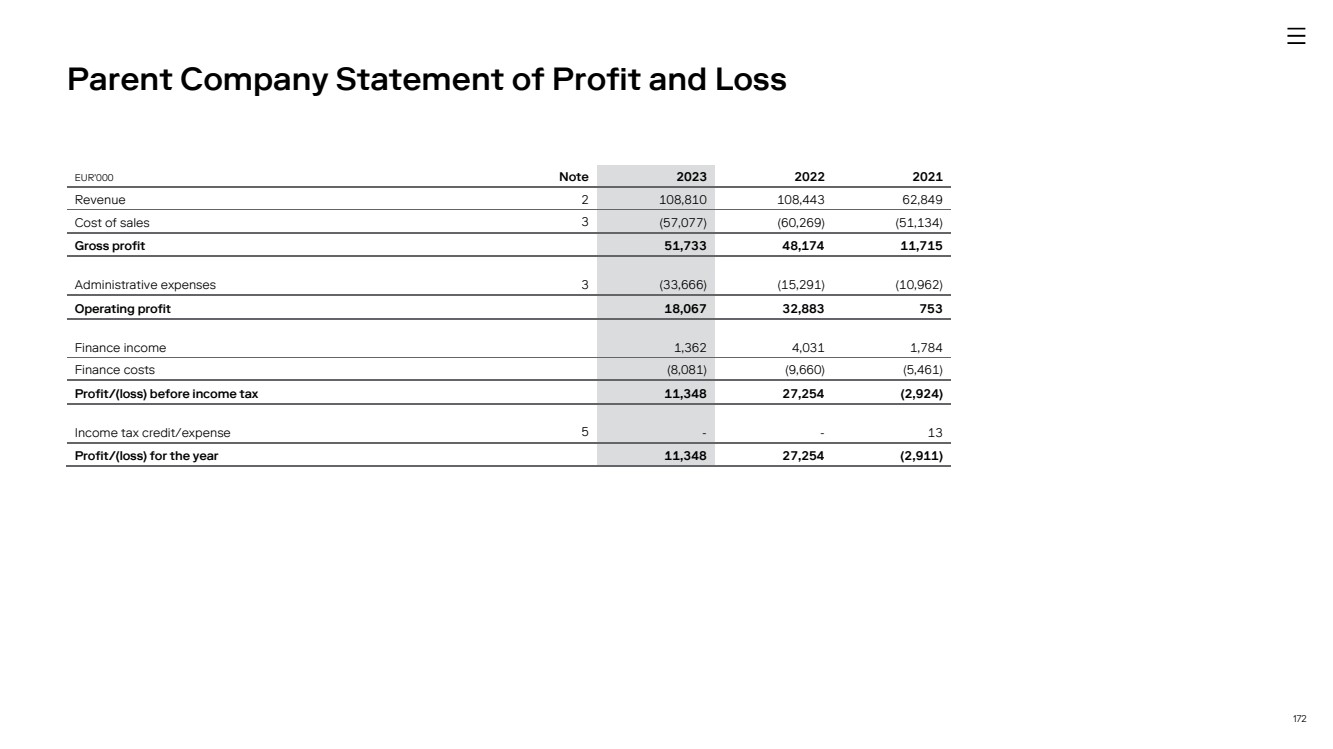
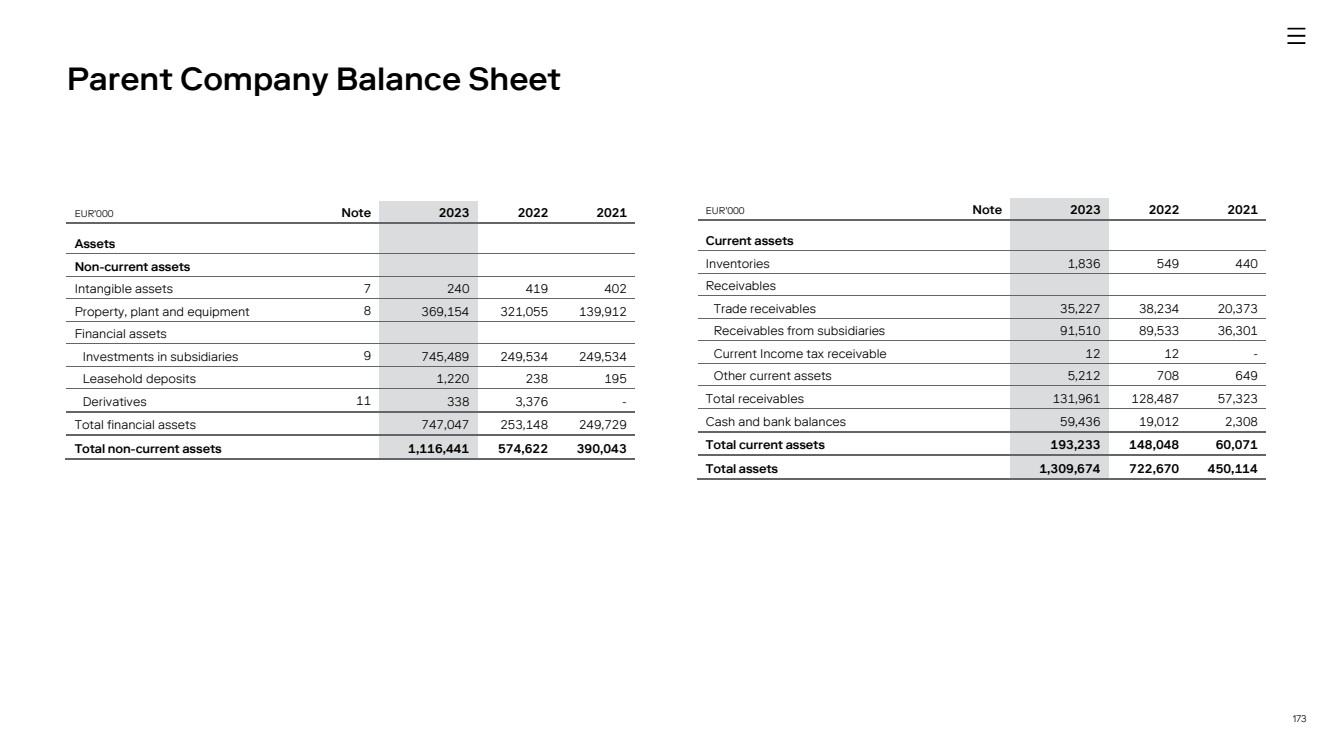
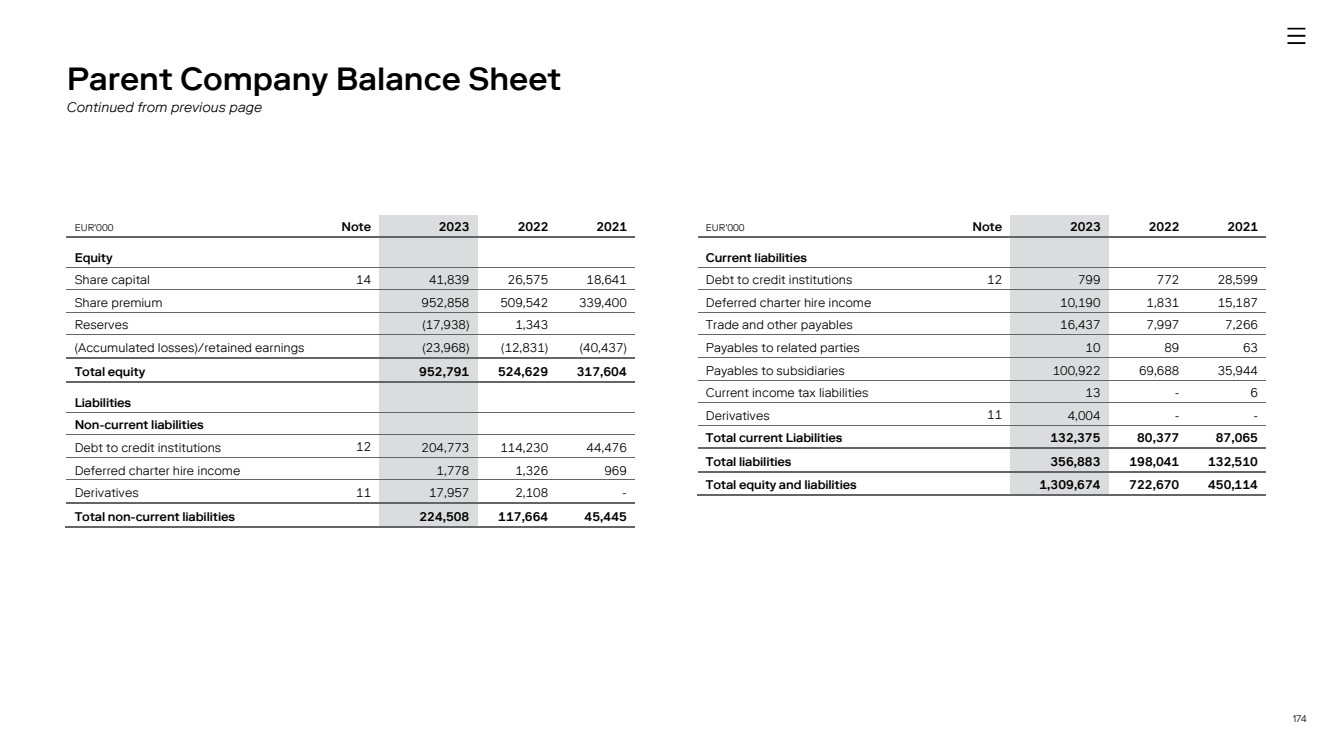
19 Parent Company The activities of the Parent Company are similar to the activities described for the Group. The finance review as described for the Group is also applicable for the Parent Company, except for the material differences described below. The Parent Company’s revenue is EUR 109 million (EUR 108 million in 2022). Total expenses for the Parent Company in 2023 amount to EUR 91 million (EUR 76 million in 2022) compared to EUR 94 million (EUR 65 million in 2022) for the Group. As the ves-sels of the Group are owned by subsidiaries of the Parent Company, no vessel deprecia-tion or vessel insurance is recognised in the Parent Company. Instead, the Parent Com-pany is subject to bareboat charges from vessel owning subsidiaries. This amounts to EUR 30 million in 2023 (EUR 34 million in 2022). Total assets were EUR 1.3 billion (EUR 723 million in 2022), which is the same as the Group EUR 1.3 billion (670 million 2022). The increase in the parent company is due to the addition to investments in subsidiaries from the business combination with Eneti for EUR 496 million. Total liabilities were EUR 357 million (EUR 198 million in 2022), the difference to the Group EUR 334 million (EUR 129 million in 2022) being driven by an increase of EUR 30 million in payables to subsidiaries. Equity amounted to EUR 953 million (EUR 525 million in 2022), compared to the Group EUR 959 million (EUR 541 million in 2022). Knowledge resources The Company is committed to attracting and retaining highly skilled professionals to meet the needs of its customers and provide exceptional service. This includes recruit-ing experienced engineers who can modify the Company's vessels to meet the specific requirements of customer projects, as well as commercial experts with relevant industry knowledge. The Company's ongoing investment in talent enables it to maintain a com-petitive edge in the market and position itself for long-term success. Research and development activities The Company's Research and Development department is focused on enhancing the fleet and exploring innovative solutions to optimise operations within the offshore wind market. By continuing to invest in R&D, the Company aims to maintain its competitive edge, achieve greater operational efficiency, and meet the evolving needs of its customers. The Company recognises the importance of ongoing research and development activi-ties in ensuring its continued growth and success in the years ahead. Special risks Operational risks The Company is vulnerable to a loss of revenue if any of its vessels are taken out of op-eration or if the delivery of newbuilds is delayed. The Company's fleet currently consists of four windfarm installation vessels, Wind Orca, Wind Osprey, Wind Scylla and Wind Zaratan. The Company also has orders for six newbuilds, four WTIVs, the P-Class and the M-Class newbuilds, and two wind foundation installation vessels, the A-Class newbuilds, and has entered into a letter of intent for the delivery of a third A-class newbuild. Finance Review Continued from previous page |
|
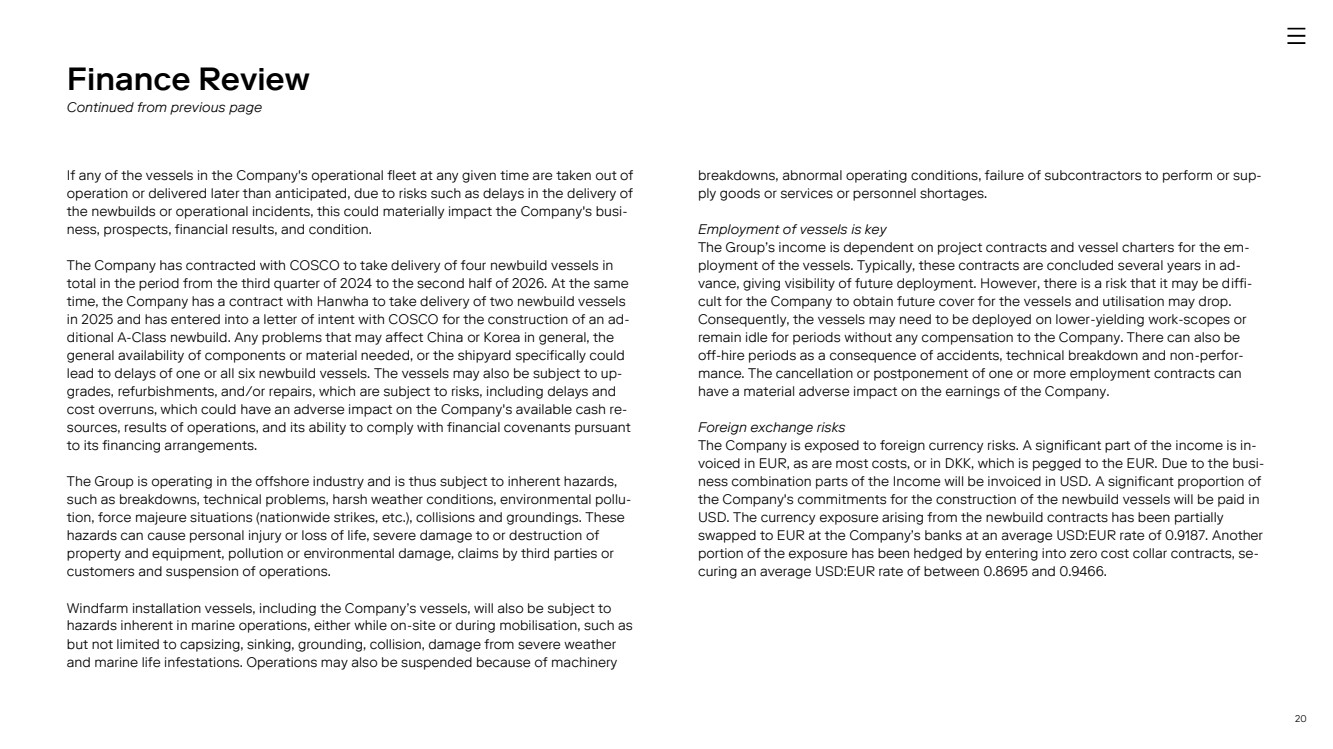
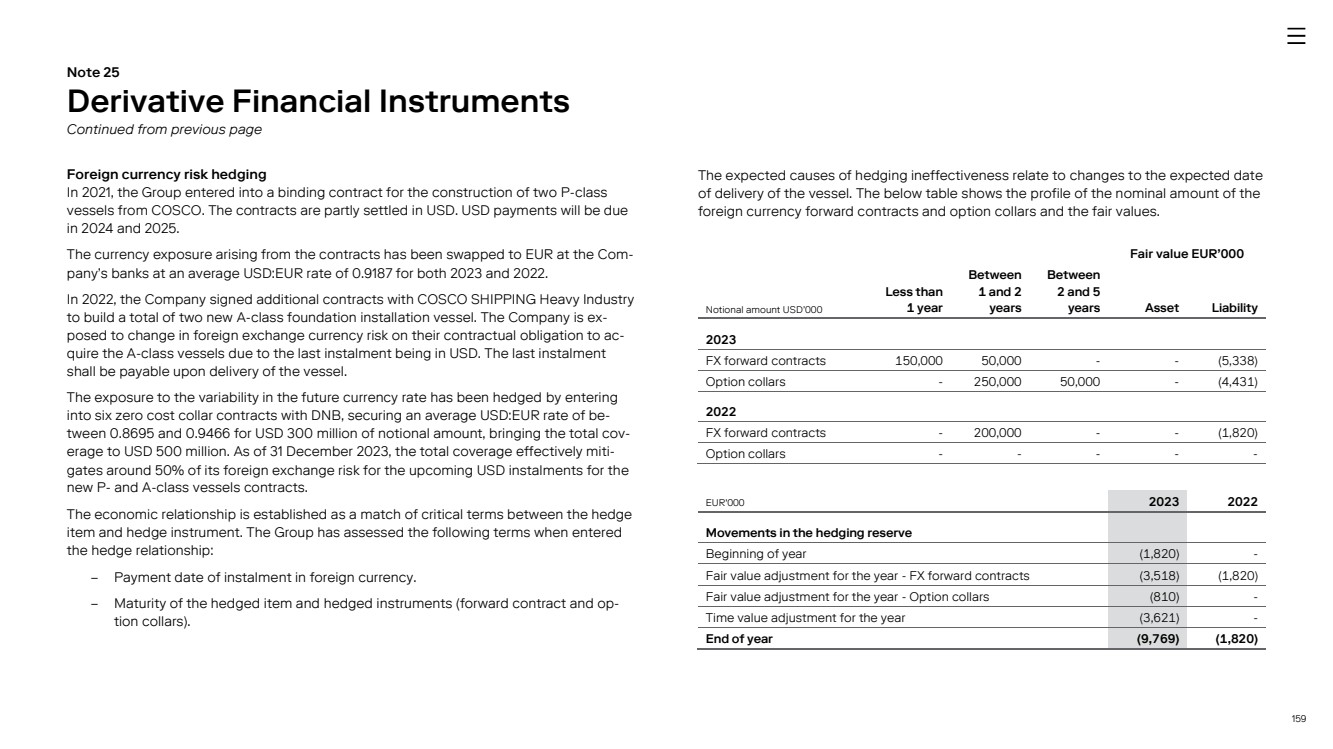
20 If any of the vessels in the Company's operational fleet at any given time are taken out of operation or delivered later than anticipated, due to risks such as delays in the delivery of the newbuilds or operational incidents, this could materially impact the Company's busi-ness, prospects, financial results, and condition. The Company has contracted with COSCO to take delivery of four newbuild vessels in total in the period from the third quarter of 2024 to the second half of 2026. At the same time, the Company has a contract with Hanwha to take delivery of two newbuild vessels in 2025 and has entered into a letter of intent with COSCO for the construction of an ad-ditional A-Class newbuild. Any problems that may affect China or Korea in general, the general availability of components or material needed, or the shipyard specifically could lead to delays of one or all six newbuild vessels. The vessels may also be subject to up-grades, refurbishments, and/or repairs, which are subject to risks, including delays and cost overruns, which could have an adverse impact on the Company's available cash re-sources, results of operations, and its ability to comply with financial covenants pursuant to its financing arrangements. The Group is operating in the offshore industry and is thus subject to inherent hazards, such as breakdowns, technical problems, harsh weather conditions, environmental pollu-tion, force majeure situations (nationwide strikes, etc.), collisions and groundings. These hazards can cause personal injury or loss of life, severe damage to or destruction of property and equipment, pollution or environmental damage, claims by third parties or customers and suspension of operations. Windfarm installation vessels, including the Company’s vessels, will also be subject to hazards inherent in marine operations, either while on-site or during mobilisation, such as but not limited to capsizing, sinking, grounding, collision, damage from severe weather and marine life infestations. Operations may also be suspended because of machinery breakdowns, abnormal operating conditions, failure of subcontractors to perform or sup-ply goods or services or personnel shortages. Employment of vessels is key The Group’s income is dependent on project contracts and vessel charters for the em-ployment of the vessels. Typically, these contracts are concluded several years in ad-vance, giving visibility of future deployment. However, there is a risk that it may be diffi-cult for the Company to obtain future cover for the vessels and utilisation may drop. Consequently, the vessels may need to be deployed on lower-yielding work-scopes or remain idle for periods without any compensation to the Company. There can also be off-hire periods as a consequence of accidents, technical breakdown and non-perfor-mance. The cancellation or postponement of one or more employment contracts can have a material adverse impact on the earnings of the Company. Foreign exchange risks The Company is exposed to foreign currency risks. A significant part of the income is in-voiced in EUR, as are most costs, or in DKK, which is pegged to the EUR. Due to the busi-ness combination parts of the Income will be invoiced in USD. A significant proportion of the Company's commitments for the construction of the newbuild vessels will be paid in USD. The currency exposure arising from the newbuild contracts has been partially swapped to EUR at the Company’s banks at an average USD:EUR rate of 0.9187. Another portion of the exposure has been hedged by entering into zero cost collar contracts, se-curing an average USD:EUR rate of between 0.8695 and 0.9466. Finance Review Continued from previous page |
|
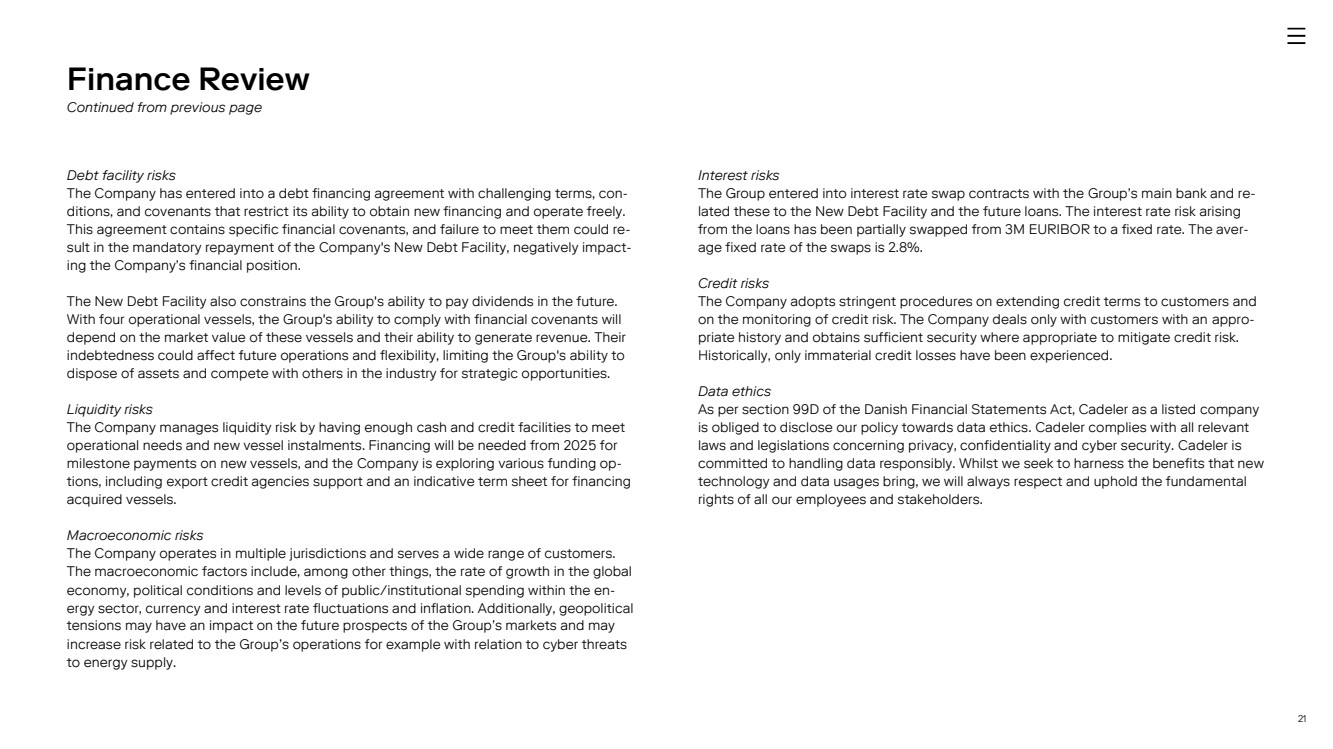
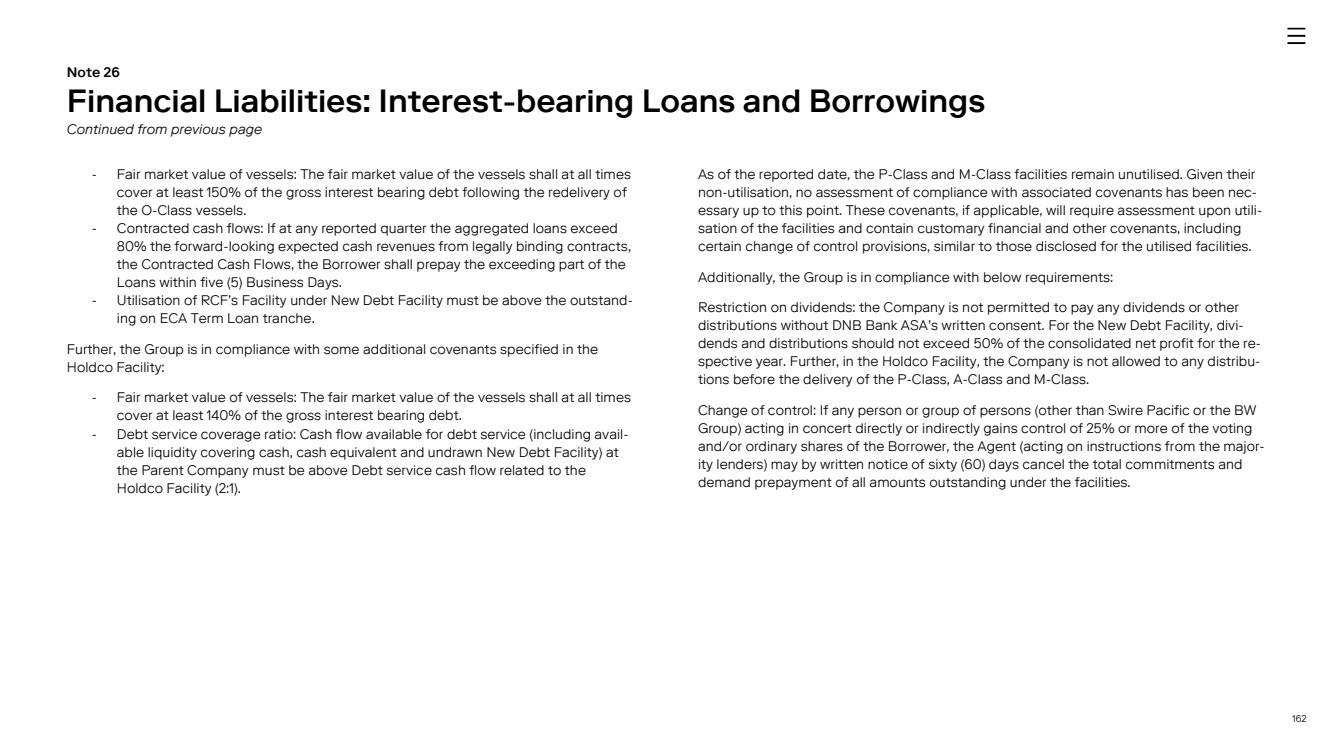
21 Debt facility risks The Company has entered into a debt financing agreement with challenging terms, con-ditions, and covenants that restrict its ability to obtain new financing and operate freely. This agreement contains specific financial covenants, and failure to meet them could re-sult in the mandatory repayment of the Company's New Debt Facility, negatively impact-ing the Company’s financial position. The New Debt Facility also constrains the Group's ability to pay dividends in the future. With four operational vessels, the Group's ability to comply with financial covenants will depend on the market value of these vessels and their ability to generate revenue. Their indebtedness could affect future operations and flexibility, limiting the Group's ability to dispose of assets and compete with others in the industry for strategic opportunities. Liquidity risks The Company manages liquidity risk by having enough cash and credit facilities to meet operational needs and new vessel instalments. Financing will be needed from 2025 for milestone payments on new vessels, and the Company is exploring various funding op-tions, including export credit agencies support and an indicative term sheet for financing acquired vessels. Macroeconomic risks The Company operates in multiple jurisdictions and serves a wide range of customers. The macroeconomic factors include, among other things, the rate of growth in the global economy, political conditions and levels of public/institutional spending within the en-ergy sector, currency and interest rate fluctuations and inflation. Additionally, geopolitical tensions may have an impact on the future prospects of the Group’s markets and may increase risk related to the Group’s operations for example with relation to cyber threats to energy supply. Interest risks The Group entered into interest rate swap contracts with the Group’s main bank and re-lated these to the New Debt Facility and the future loans. The interest rate risk arising from the loans has been partially swapped from 3M EURIBOR to a fixed rate. The aver-age fixed rate of the swaps is 2.8%. Credit risks The Company adopts stringent procedures on extending credit terms to customers and on the monitoring of credit risk. The Company deals only with customers with an appro-priate history and obtains sufficient security where appropriate to mitigate credit risk. Historically, only immaterial credit losses have been experienced. Data ethics As per section 99D of the Danish Financial Statements Act, Cadeler as a listed company is obliged to disclose our policy towards data ethics. Cadeler complies with all relevant laws and legislations concerning privacy, confidentiality and cyber security. Cadeler is committed to handling data responsibly. Whilst we seek to harness the benefits that new technology and data usages bring, we will always respect and uphold the fundamental rights of all our employees and stakeholders. Finance Review Continued from previous page |
|
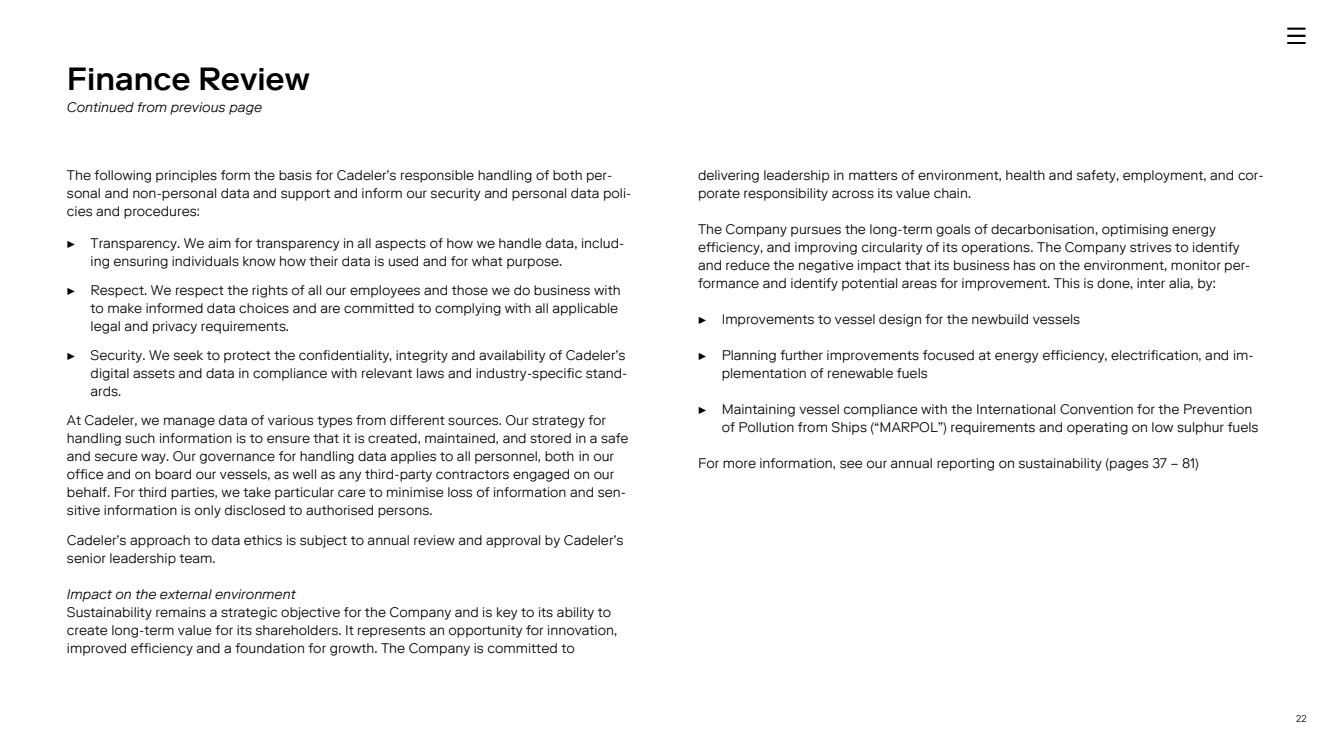
22 The following principles form the basis for Cadeler’s responsible handling of both per-sonal and non-personal data and support and inform our security and personal data poli-cies and procedures: ▶ Transparency. We aim for transparency in all aspects of how we handle data, includ-ing ensuring individuals know how their data is used and for what purpose. ▶ Respect. We respect the rights of all our employees and those we do business with to make informed data choices and are committed to complying with all applicable legal and privacy requirements. ▶ Security. We seek to protect the confidentiality, integrity and availability of Cadeler’s digital assets and data in compliance with relevant laws and industry-specific stand-ards. At Cadeler, we manage data of various types from different sources. Our strategy for handling such information is to ensure that it is created, maintained, and stored in a safe and secure way. Our governance for handling data applies to all personnel, both in our office and on board our vessels, as well as any third-party contractors engaged on our behalf. For third parties, we take particular care to minimise loss of information and sen-sitive information is only disclosed to authorised persons. Cadeler’s approach to data ethics is subject to annual review and approval by Cadeler’s senior leadership team. Impact on the external environment Sustainability remains a strategic objective for the Company and is key to its ability to create long-term value for its shareholders. It represents an opportunity for innovation, improved efficiency and a foundation for growth. The Company is committed to delivering leadership in matters of environment, health and safety, employment, and cor-porate responsibility across its value chain. The Company pursues the long-term goals of decarbonisation, optimising energy efficiency, and improving circularity of its operations. The Company strives to identify and reduce the negative impact that its business has on the environment, monitor per-formance and identify potential areas for improvement. This is done, inter alia, by: ▶ Improvements to vessel design for the newbuild vessels ▶ Planning further improvements focused at energy efficiency, electrification, and im-plementation of renewable fuels ▶ Maintaining vessel compliance with the International Convention for the Prevention of Pollution from Ships (“MARPOL”) requirements and operating on low sulphur fuels For more information, see our annual reporting on sustainability (pages 37 – 81) Finance Review Continued from previous page |
|
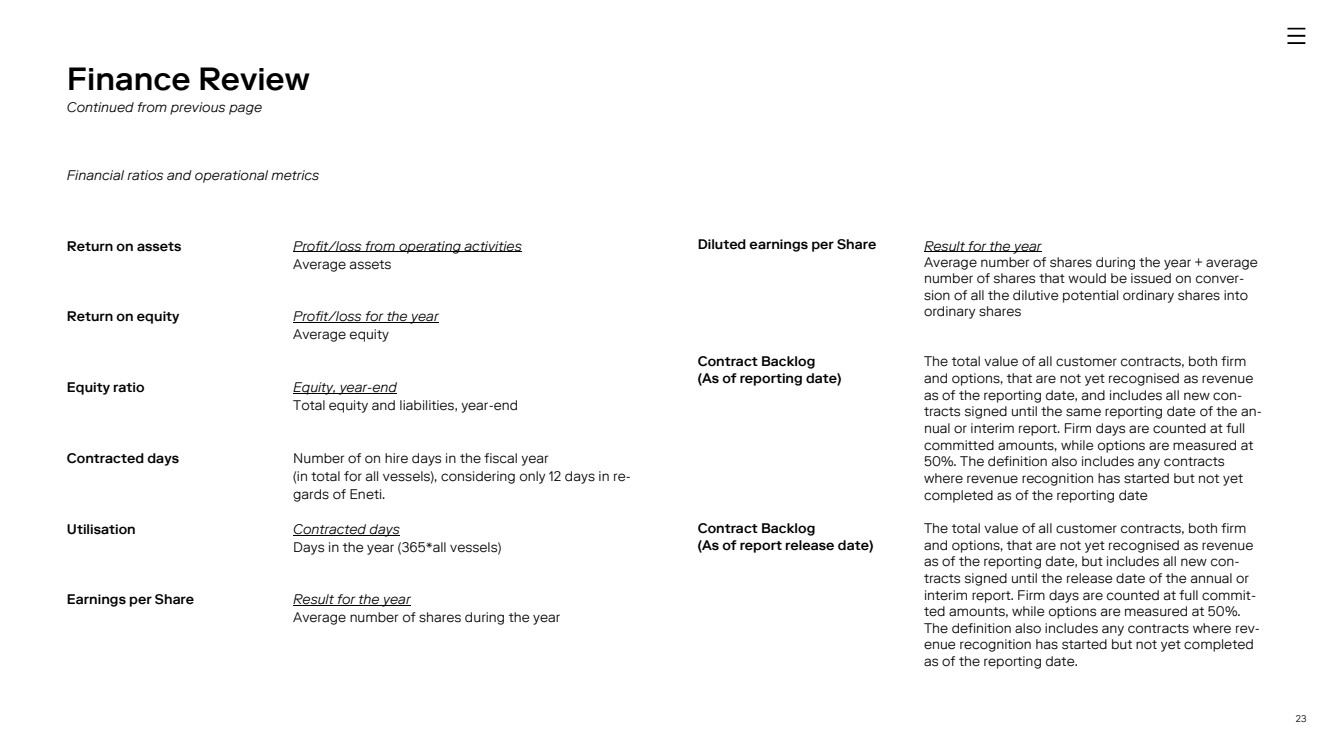
23 Financial ratios and operational metrics Finance Review Continued from previous page Return on assets Profit/loss from operating activities Average assets Return on equity Profit/loss for the year Average equity Equity ratio Equity, year-end Total equity and liabilities, year-end Contracted days Number of on hire days in the fiscal year (in total for all vessels), considering only 12 days in re-gards of Eneti. Utilisation Contracted days Days in the year (365*all vessels) Earnings per Share Result for the year Average number of shares during the year Diluted earnings per Share Result for the year Average number of shares during the year + average number of shares that would be issued on conver-sion of all the dilutive potential ordinary shares into ordinary shares Contract Backlog (As of reporting date) The total value of all customer contracts, both firm and options, that are not yet recognised as revenue as of the reporting date, and includes all new con-tracts signed until the same reporting date of the an-nual or interim report. Firm days are counted at full committed amounts, while options are measured at 50%. The definition also includes any contracts where revenue recognition has started but not yet completed as of the reporting date Contract Backlog (As of report release date) The total value of all customer contracts, both firm and options, that are not yet recognised as revenue as of the reporting date, but includes all new con-tracts signed until the release date of the annual or interim report. Firm days are counted at full commit-ted amounts, while options are measured at 50%. The definition also includes any contracts where rev-enue recognition has started but not yet completed as of the reporting date. |
|
24 Cadeler at a Glance * Proforma revenue if the acquisition had occurred on 1 January 2023, see Note 6 of the consolidated financial statements for further details ** As per 31 December 2023 and options included at 100% *** As per 26 March 2024 |
|
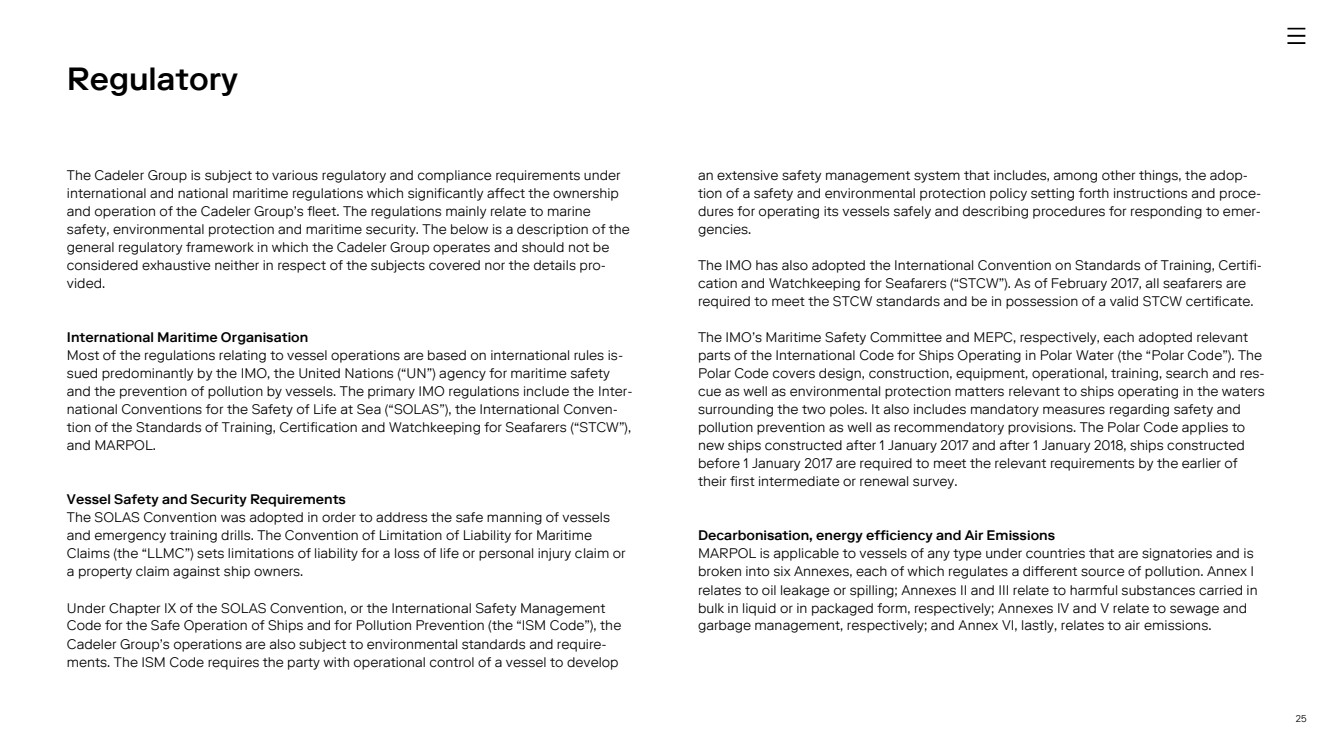
25 The Cadeler Group is subject to various regulatory and compliance requirements under international and national maritime regulations which significantly affect the ownership and operation of the Cadeler Group’s fleet. The regulations mainly relate to marine safety, environmental protection and maritime security. The below is a description of the general regulatory framework in which the Cadeler Group operates and should not be considered exhaustive neither in respect of the subjects covered nor the details pro-vided. International Maritime Organisation Most of the regulations relating to vessel operations are based on international rules is-sued predominantly by the IMO, the United Nations (“UN”) agency for maritime safety and the prevention of pollution by vessels. The primary IMO regulations include the Inter-national Conventions for the Safety of Life at Sea (“SOLAS”), the International Conven-tion of the Standards of Training, Certification and Watchkeeping for Seafarers (“STCW”), and MARPOL. Vessel Safety and Security Requirements The SOLAS Convention was adopted in order to address the safe manning of vessels and emergency training drills. The Convention of Limitation of Liability for Maritime Claims (the “LLMC”) sets limitations of liability for a loss of life or personal injury claim or a property claim against ship owners. Under Chapter IX of the SOLAS Convention, or the International Safety Management Code for the Safe Operation of Ships and for Pollution Prevention (the “ISM Code”), the Cadeler Group’s operations are also subject to environmental standards and require-ments. The ISM Code requires the party with operational control of a vessel to develop an extensive safety management system that includes, among other things, the adop-tion of a safety and environmental protection policy setting forth instructions and proce-dures for operating its vessels safely and describing procedures for responding to emer-gencies. The IMO has also adopted the International Convention on Standards of Training, Certifi-cation and Watchkeeping for Seafarers (“STCW”). As of February 2017, all seafarers are required to meet the STCW standards and be in possession of a valid STCW certificate. The IMO’s Maritime Safety Committee and MEPC, respectively, each adopted relevant parts of the International Code for Ships Operating in Polar Water (the “Polar Code”). The Polar Code covers design, construction, equipment, operational, training, search and res-cue as well as environmental protection matters relevant to ships operating in the waters surrounding the two poles. It also includes mandatory measures regarding safety and pollution prevention as well as recommendatory provisions. The Polar Code applies to new ships constructed after 1 January 2017 and after 1 January 2018, ships constructed before 1 January 2017 are required to meet the relevant requirements by the earlier of their first intermediate or renewal survey. Decarbonisation, energy efficiency and Air Emissions MARPOL is applicable to vessels of any type under countries that are signatories and is broken into six Annexes, each of which regulates a different source of pollution. Annex I relates to oil leakage or spilling; Annexes II and III relate to harmful substances carried in bulk in liquid or in packaged form, respectively; Annexes IV and V relate to sewage and garbage management, respectively; and Annex VI, lastly, relates to air emissions. Regulatory |
|
26 Annex VI to MARPOL addresses air pollution from vessels. Annex VI sets limits on sulfur oxide and nitrogen oxide emissions from all commercial vessel exhausts and prohibits “deliberate emissions” of ozone depleting substances (such as halons and chlorofluoro-carbons), emissions of volatile compounds from cargo tanks, and the shipboard incinera-tion of specific substances. Annex VI also includes a global cap on the sulfur content of fuel oil and allows for special areas to be established with more stringent controls on sulfur emissions, as explained below. Emissions of “volatile organic compounds” from certain vessels, and the ship-board incineration (from incinerators installed after 1 January 2000) of certain substances (such as polychlorinated biphenyls, or “PCBs”) are also prohibited. Pollution Control and Liability Requirements The IMO has negotiated international conventions that impose liability for pollution in in-ternational waters and the territorial waters of the signatories to such conventions. The IMO has, inter alia, adopted an International Convention for the Control and Manage-ment of Ships’ Ballast Water and Sediments (the “BWM Convention”) in 2004. The BWM Convention requires ships to manage their ballast water to remove, render harmless, or avoid the uptake or discharge of new or invasive aquatic organisms and pathogens within ballast water and sediments. The BWM Convention’s implementing regulations call for a phased introduction of mandatory ballast water exchange requirements, to be replaced in time with mandatory concentration limits, and require all ships to carry a bal-last water record book and an international ballast water management certificate. The IMO also adopted the International Convention on Civil Liability for Bunker Oil Pollu-tion Damage (the “Bunker Convention”) to impose strict liability on ship owners (including the registered owner, bareboat charterer, manager or operator) for pollution damage in jurisdictional waters of ratifying states caused by discharges of bunker fuel. The Bunker Convention requires registered owners of ships over 1,000 gross tons to maintain insur-ance for pollution damage in an amount equal to the limits of liability under the applica-ble national or international limitation regime (but not exceeding the amount calculated in accordance with the LLMC). Anti-Fouling Requirements In 2001, the IMO adopted the International Convention on the Control of Harmful Anti-fouling Systems on Ships (the “Anti-fouling Convention”). The Anti-fouling Convention prohibits the use of organotin compound coatings to prevent the attachment of mol-luscs, anti-fouling systems containing cybutryne and other sea life to the hulls of vessels. Vessels of over 400 gross tons engaged in international voyages will also be required to undergo an initial survey before the vessel is put into service or before an International Anti-fouling System Certificate (the “IAFS Certificate”) is issued for the first time; and subsequent surveys when the anti-fouling systems are altered or replaced. International Labour Organisation The International Labour Organisation (the “ILO”) is a specialised agency of the UN that has adopted the Maritime Labor Convention 2006 (“MLC 2006”). A Maritime Labor Cer-tificate and a Declaration of Maritime Labor Compliance is required to ensure compli-ance with MLC 2006 for all ships of 500 gross tons or over and are either engaged in in-ternational voyage or flying the flag of a member and operating from a port, or between ports, in another country. Regulatory Continued from previous page |
|
27 EU Regulations Decarbonisation and energy efficiency The EU made a unilateral commitment to reduce overall greenhouse gas emissions from its member states from 20% of 1990 levels by 2020. The EU also committed to reduce its emissions by 20% under the Kyoto Protocol’s second period from 2013 to 2020. Regulation (EU) 2015/757 of the European Parliament and of the Council of 29 April 2015 (amending EU Directive 2009/16/EC) (“MRV Regulation”) governs the monitoring, report-ing and verification of carbon dioxide emissions from maritime transport, and, subject to some exclusions, requires companies with ships over 5,000 gross tonnage to monitor and report carbon dioxide emissions annually. The EU has adopted several regulations and directives requiring, among other things, more frequent inspections of high-risk ships, as determined by type, age and flag as well as the number of times the ship has been detained. The EU also adopted and extended a ban on substandard ships and enacted a minimum ban period and a definitive ban for repeated offenses. The regulation also provided the EU with greater authority and con-trol over classification societies, by imposing more requirements on classification socie-ties and providing for fines or penalty payments for organisations that failed to comply. Furthermore, the EU has implemented regulations requiring vessels to use reduced sul-fur content fuel for their main and auxiliary engines. The EU Directive 2005/33/EC (amending Directive 1999/32/EC) introduced requirements parallel to those in Annex VI relating to the sulfur content of marine fuels. In addition, the EU imposed a 0.1% maxi-mum sulfur requirement for fuel used by ships at berth in the Baltic, the North Sea and the English Channel (the so called “SOx-Emission Control Area). As of January 2020, EU member states also have to ensure that ships in all EU waters, except the SOx-Emission Control Area, use fuels with a 0.5% maximum sulfur content. On 15 September 2020, the European Parliament voted to include greenhouse gas emis-sions from the maritime sector in the EU’s carbon market, the EU ETS. On July 14, 2021, the European Commission formally proposed its plan, which would involve gradually in-cluding the maritime sector from 2024 and phasing the sector in over a three-year pe-riod. This will require shipowners to buy permits to cover these emissions. On 18 Decem-ber 2022, the Environmental Council and European Parliament agreed to include mari-time shipping emissions within the scope of the EU ETS in phases: shipping companies will pay for 40% for verified emissions from 2024, 70% for 2025 and 100% for 2026. Most large vessels will be included in the scope of the EU ETS from the start, with offshore vessels being included from 2027. Offshore vessels above 5,000 gross tonnage will be included in the EU ETS from 2027. The inclusion of general cargo vessels and offshore vessels between 400-5,000 gross tonnage in the ETS will be reviewed in 2026. Pollution Control and Liability Requirements EU Directive 2009/123/EC (amending Directive 2005/35/EC) on ship-source pollution and on the introduction of penalties for infringements imposes criminal sanctions for il-licit ship-source discharges of polluting substances, including minor discharges, if com-mitted with intent, recklessly or with serious negligence and the discharges individually or in the aggregate result in deterioration of the quality of water. Aiding and abetting the discharge of a polluting substance may also lead to criminal penalties. The directive ap-plies to all types of vessels, irrespective of their flag, but certain exceptions apply to war-ships or where human safety or that of the ship is in danger. Regulatory Continued from previous page |
|
28 Ship recycling The EU has put in place regulatory requirements on the recycling of vessels. The recy-cling of vessels is subject to various international, regional and national requirements, in-cluding the 1989 Basel Convention/EU Waste Shipment Regulation (1013/2006), the 2009 Hong Kong Convention and the EU Ship Recycling Regulation (1257/2013) which may apply depending on the vessel flag and the location of the vessel when the decision to recycle the vessel was taken. The regulations put in place certain requirements relat-ing to, inter alia, the export of vessels destined for recycling and the manner in which the recycling is carried out. Inspection by Classification Societies The hull and machinery of every commercial vessel must be classed by a classification society authorised by its country of registry. The classification society certifies that a vessel is safe and seaworthy in accordance with the applicable rules and regulations of the country of registry of the vessel and SOLAS. Most insurance underwriters make it a condition for insurance coverage and lending that a vessel be certified “in class” by a classification society which is a member of the International Association of Classification Societies, the IACS. A vessel must undergo annual surveys, intermediate surveys, drydockings and special surveys. In lieu of a special survey, a vessel’s machinery may be on a continuous survey cycle, under which the machinery would be surveyed periodically over a five-year period. Every vessel is also required to be drydocked every periodically for inspection of the un-derwater parts of the vessel. If any vessel does not maintain its class and/or fails any an-nual survey, intermediate survey, drydocking or special survey, the vessel will be unable to carry cargo between ports and will be unemployable and uninsurable and there may be further commercial consequences. Other Coastal State Requirements As a matter of international law, the coastal states are permitted, subject to certain re-strictions, to put in place requirements on the vessels’ operations in the territorial waters. Furthermore, the coastal state is entitled to exploit natural resources (such as wind power) in its exclusive economic zones and/or continental shelf subject to restrictions set out in the United Nations International Law of the Seas Convention (UNCLOS), Part II, Art. 2(2), Part V and VI (or customary international law). Internationally, coastal states have elected to put significantly different regulatory re-quirements. The local law requirements may relate to matters such as the ownership/na-tionality of the vessel, nationality and/or work permits for crew, and/or use of local port infrastructure. In the Cadeler Group’s activities, the Cadeler Group is confronted with a range of government policies that restrict international trade and protect domestic in-dustries. These protectionist measures manifest themselves mostly through cabotage laws which protect the domestic shipping industry from foreign competition and thus prevent or limit the us from operating in such countries. Examples of such measures can be found, among others, in the United States through the Merchant Marine Act of 1920 (also known as the Jones Act), as well as in many other jurisdictions. Regulatory Continued from previous page |
|
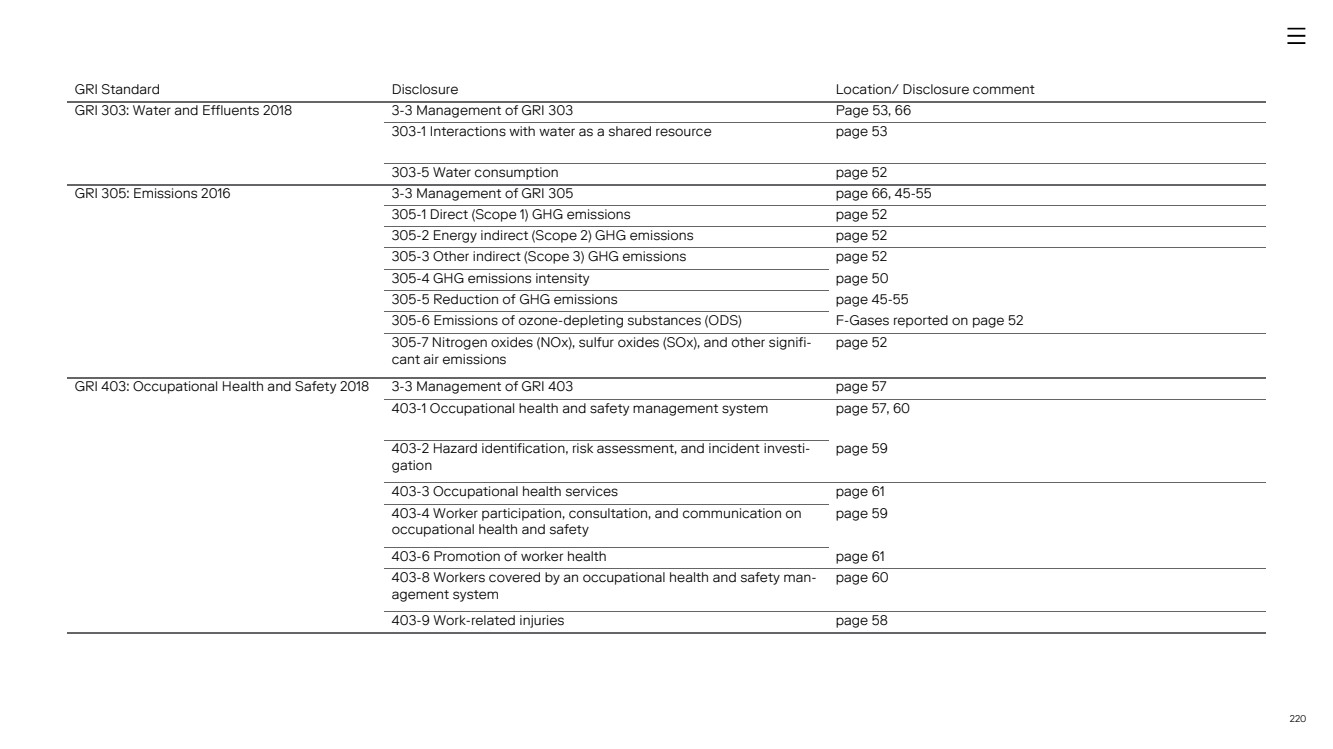
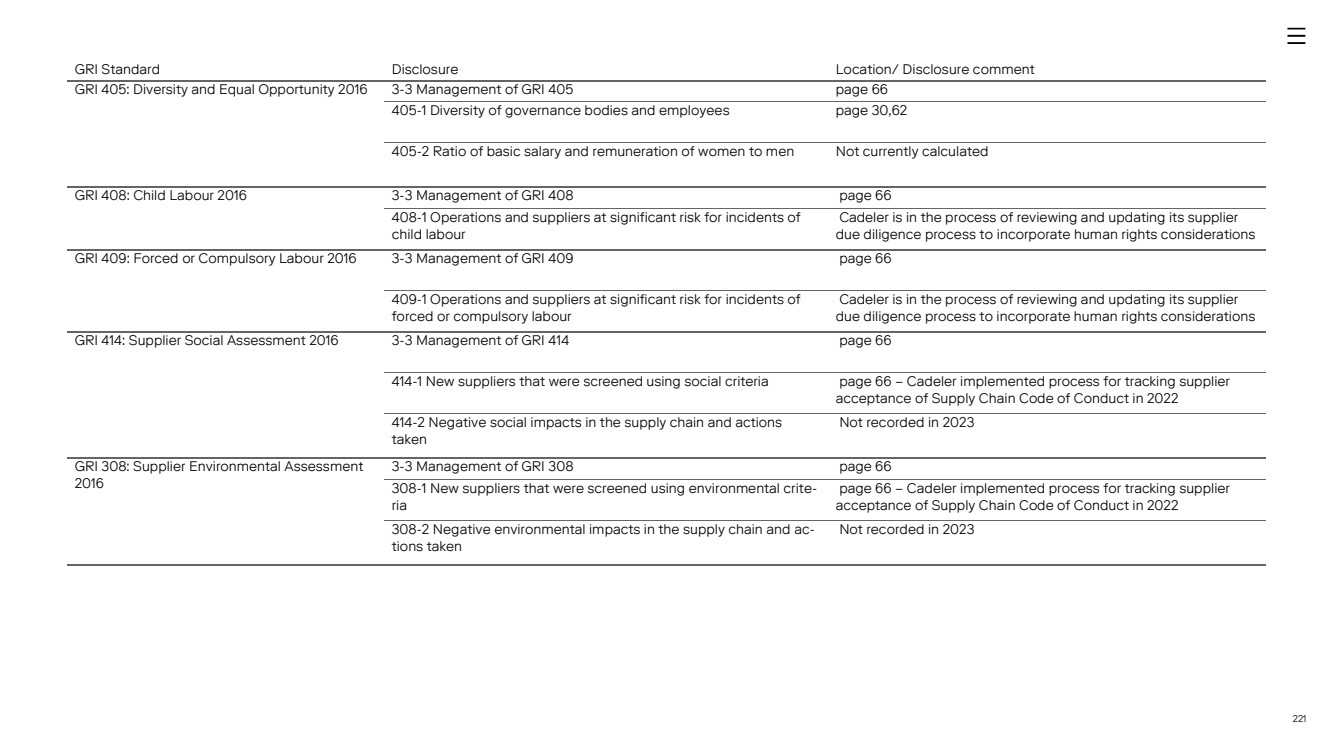
29 The Company’s corporate governance principles are based on, and in all material as-pects in compliance with, the Norwegian Code of Practice and applicable Danish law. In addition, and as a result of the listing of the Company’s American Depositary Shares on the New York Stock Exchange (the “NYSE”), the Company complies with applicable United States federal securities laws and regulations as well as the rules of the NYSE, in particular the corporate governance standards of Section 303A of the NYSE Listed Com-pany Manual, to the extent applicable to the Company as a foreign private issuer. A full copy of the Company’s corporate governance code is available on the Company’s website: https://www.cadeler.com/assets/uploads/PDFs/Investors/cadeler-corporate-governance-policy-2024.pdf Statutory CSR report To fulfil the requirement for statutory reporting on corporate responsibility cf. sections §99a and §107d of the Danish Financial Statements Act, the Company has integrated its annual sustainable development reporting into the Annual Report 2023, see pages 37 – 81. Also see pages 212-221 for the ESG Appendices, which contain KPIs and accounting practices related to Cadeler’s Statutory reporting. Corporate Governance 29 |
|
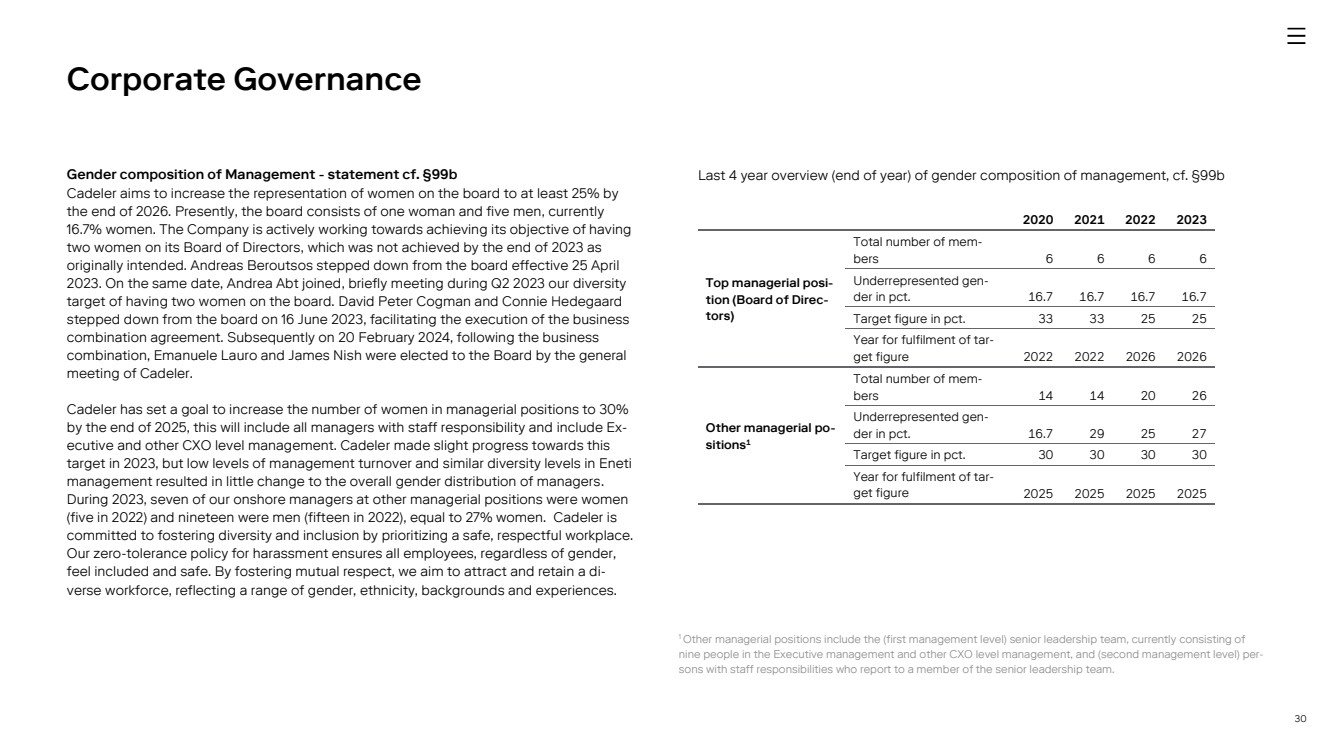
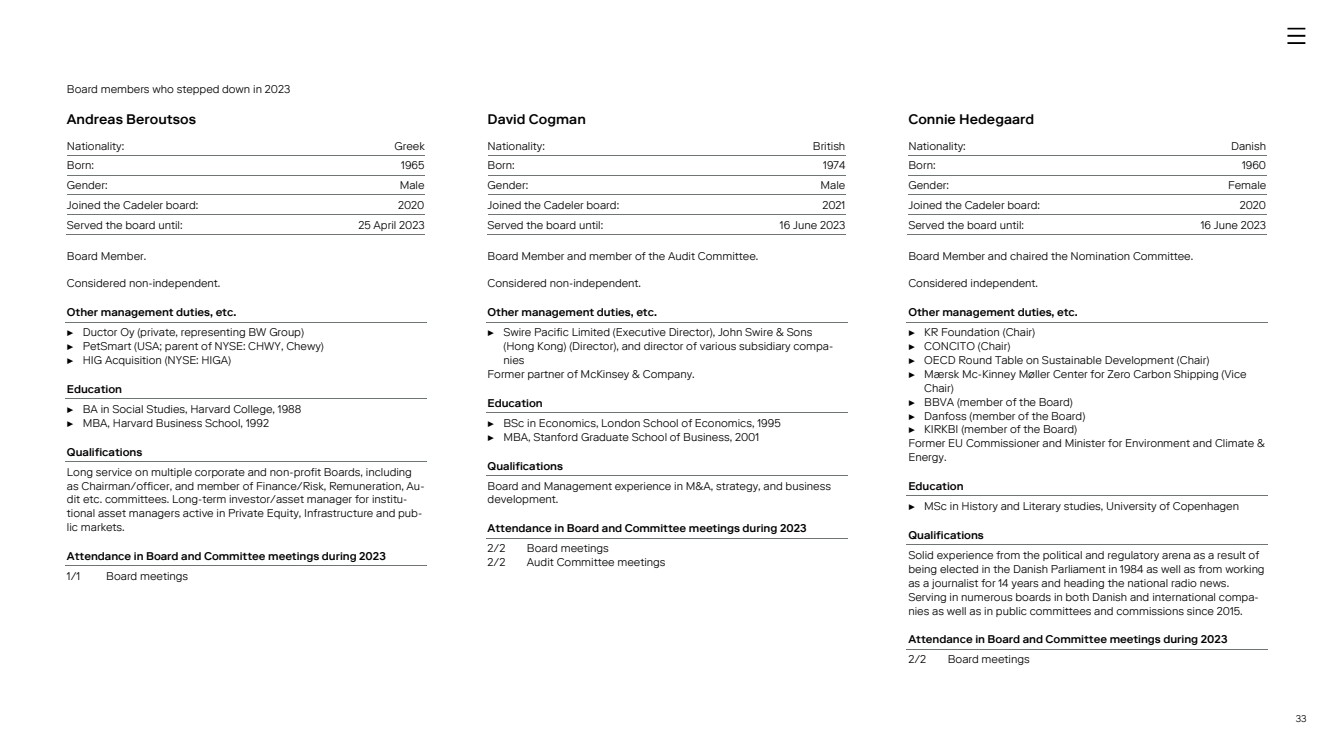
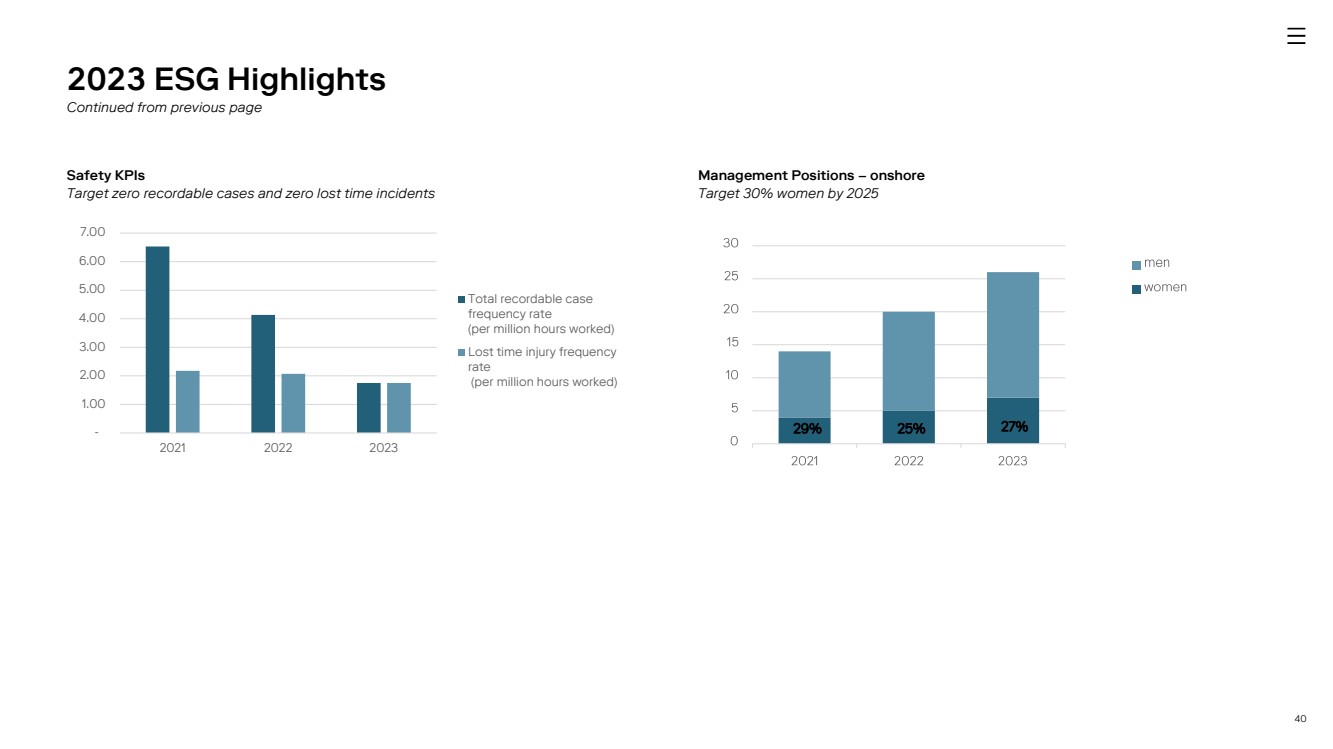
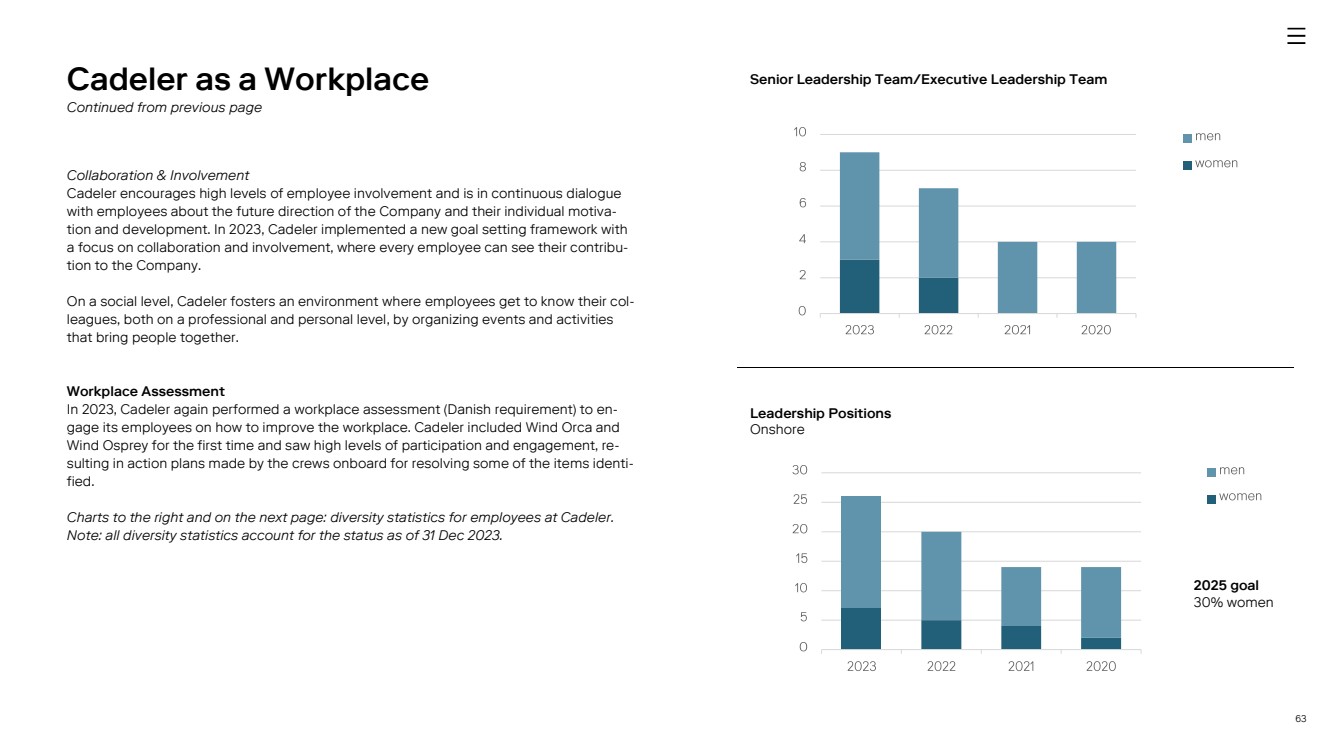
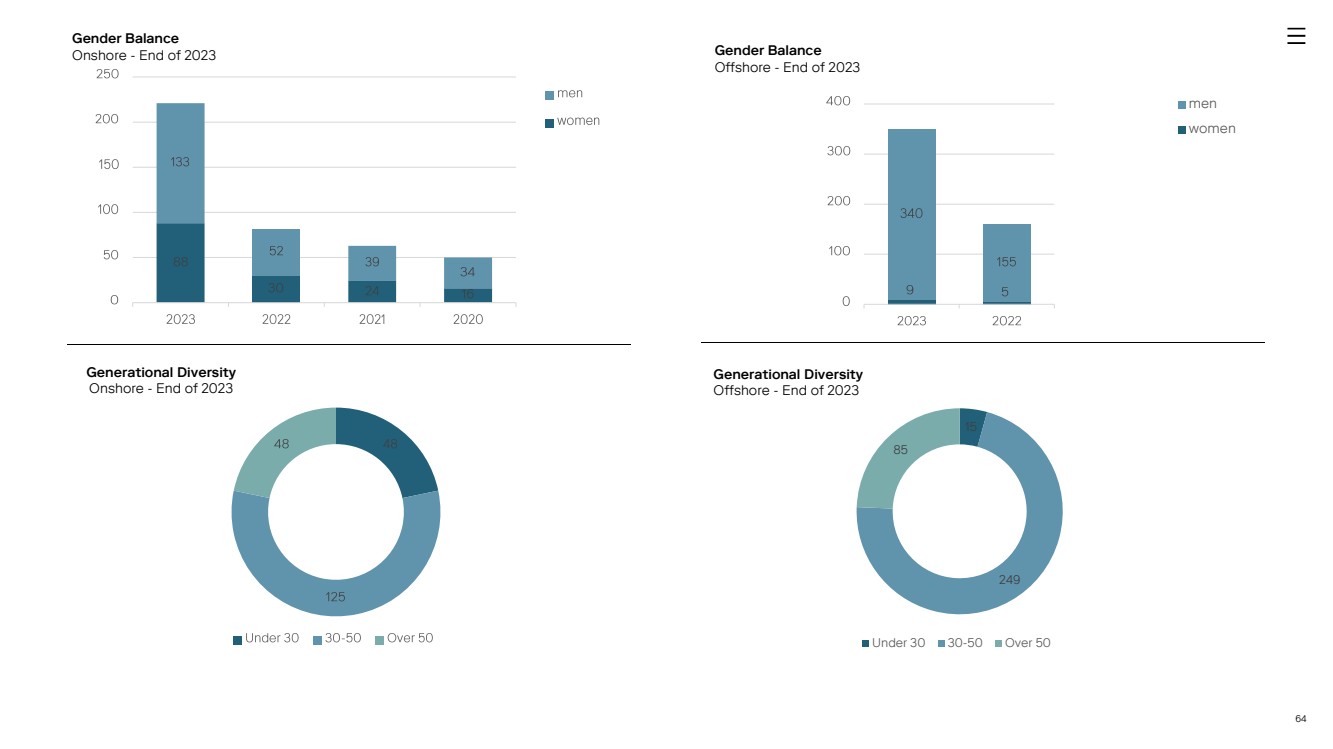
30 Gender composition of Management - statement cf. §99b Cadeler aims to increase the representation of women on the board to at least 25% by the end of 2026. Presently, the board consists of one woman and five men, currently 16.7% women. The Company is actively working towards achieving its objective of having two women on its Board of Directors, which was not achieved by the end of 2023 as originally intended. Andreas Beroutsos stepped down from the board effective 25 April 2023. On the same date, Andrea Abt joined, briefly meeting during Q2 2023 our diversity target of having two women on the board. David Peter Cogman and Connie Hedegaard stepped down from the board on 16 June 2023, facilitating the execution of the business combination agreement. Subsequently on 20 February 2024, following the business combination, Emanuele Lauro and James Nish were elected to the Board by the general meeting of Cadeler. Cadeler has set a goal to increase the number of women in managerial positions to 30% by the end of 2025, this will include all managers with staff responsibility and include Ex-ecutive and other CXO level management. Cadeler made slight progress towards this target in 2023, but low levels of management turnover and similar diversity levels in Eneti management resulted in little change to the overall gender distribution of managers. During 2023, seven of our onshore managers at other managerial positions were women (five in 2022) and nineteen were men (fifteen in 2022), equal to 27% women. Cadeler is committed to fostering diversity and inclusion by prioritizing a safe, respectful workplace. Our zero-tolerance policy for harassment ensures all employees, regardless of gender, feel included and safe. By fostering mutual respect, we aim to attract and retain a di-verse workforce, reflecting a range of gender, ethnicity, backgrounds and experiences. Last 4 year overview (end of year) of gender composition of management, cf. §99b Corporate Governance 1 Other managerial positions include the (first management level) senior leadership team, currently consisting of nine people in the Executive management and other CXO level management, and (second management level) per-sons with staff responsibilities who report to a member of the senior leadership team. 2020 2021 2022 2023 Top managerial posi-tion (Board of Direc-tors) Total number of mem-bers 6 6 6 6 Underrepresented gen-der in pct. 16.7 16.7 16.7 16.7 Target figure in pct. 33 33 25 25 Year for fulfilment of tar-get figure 2022 2022 2026 2026 Other managerial po-sitions1 Total number of mem-bers 14 14 20 26 Underrepresented gen-der in pct. 16.7 29 25 27 Target figure in pct. 30 30 30 30 Year for fulfilment of tar-get figure 2025 2025 2025 2025 |
|
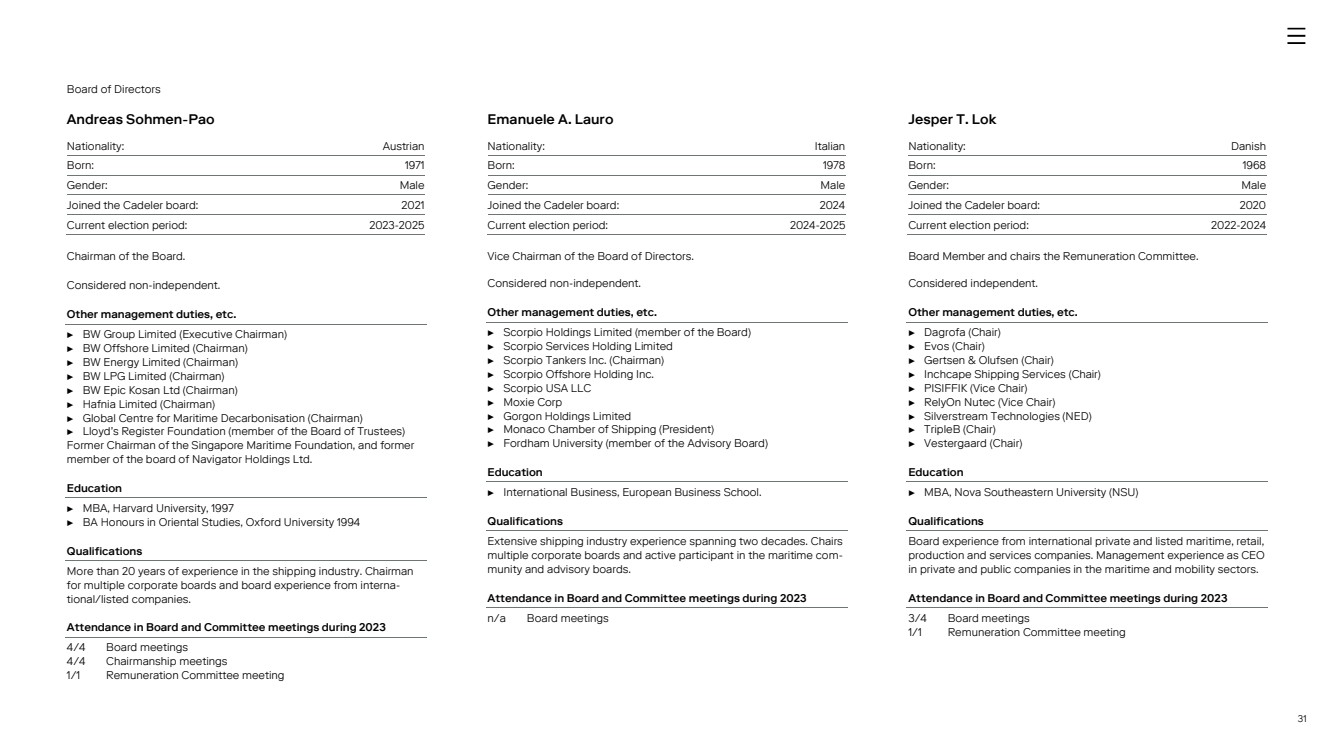
31 Board of Directors Andreas Sohmen-Pao Nationality: Austrian Born: 1971 Gender: Male Joined the Cadeler board: 2021 Current election period: 2023-2025 Chairman of the Board. Considered non-independent. Other management duties, etc. ▶ BW Group Limited (Executive Chairman) ▶ BW Offshore Limited (Chairman) ▶ BW Energy Limited (Chairman) ▶ BW LPG Limited (Chairman) ▶ BW Epic Kosan Ltd (Chairman) ▶ Hafnia Limited (Chairman) ▶ Global Centre for Maritime Decarbonisation (Chairman) ▶ Lloyd’s Register Foundation (member of the Board of Trustees) Former Chairman of the Singapore Maritime Foundation, and former member of the board of Navigator Holdings Ltd. Education ▶ MBA, Harvard University, 1997 ▶ BA Honours in Oriental Studies, Oxford University 1994 Qualifications More than 20 years of experience in the shipping industry. Chairman for multiple corporate boards and board experience from interna-tional/listed companies. Attendance in Board and Committee meetings during 2023 4/4 Board meetings 4/4 Chairmanship meetings 1/1 Remuneration Committee meeting Emanuele A. Lauro Nationality: Italian Born: 1978 Gender: Male Joined the Cadeler board: 2024 Current election period: 2024-2025 Vice Chairman of the Board of Directors. Considered non-independent. Other management duties, etc. ▶ Scorpio Holdings Limited (member of the Board) ▶ Scorpio Services Holding Limited ▶ Scorpio Tankers Inc. (Chairman) ▶ Scorpio Offshore Holding Inc. ▶ Scorpio USA LLC ▶ Moxie Corp ▶ Gorgon Holdings Limited ▶ Monaco Chamber of Shipping (President) ▶ Fordham University (member of the Advisory Board) Education ▶ International Business, European Business School. Qualifications Extensive shipping industry experience spanning two decades. Chairs multiple corporate boards and active participant in the maritime com-munity and advisory boards. Attendance in Board and Committee meetings during 2023 n/a Board meetings Jesper T. Lok Nationality: Danish Born: 1968 Gender: Male Joined the Cadeler board: 2020 Current election period: 2022-2024 Board Member and chairs the Remuneration Committee. Considered independent. Other management duties, etc. ▶ Dagrofa (Chair) ▶ Evos (Chair) ▶ Gertsen & Olufsen (Chair) ▶ Inchcape Shipping Services (Chair) ▶ PISIFFIK (Vice Chair) ▶ RelyOn Nutec (Vice Chair) ▶ Silverstream Technologies (NED) ▶ TripleB (Chair) ▶ Vestergaard (Chair) Education ▶ MBA, Nova Southeastern University (NSU) Qualifications Board experience from international private and listed maritime, retail, production and services companies. Management experience as CEO in private and public companies in the maritime and mobility sectors. Attendance in Board and Committee meetings during 2023 3/4 Board meetings 1/1 Remuneration Committee meeting |
|
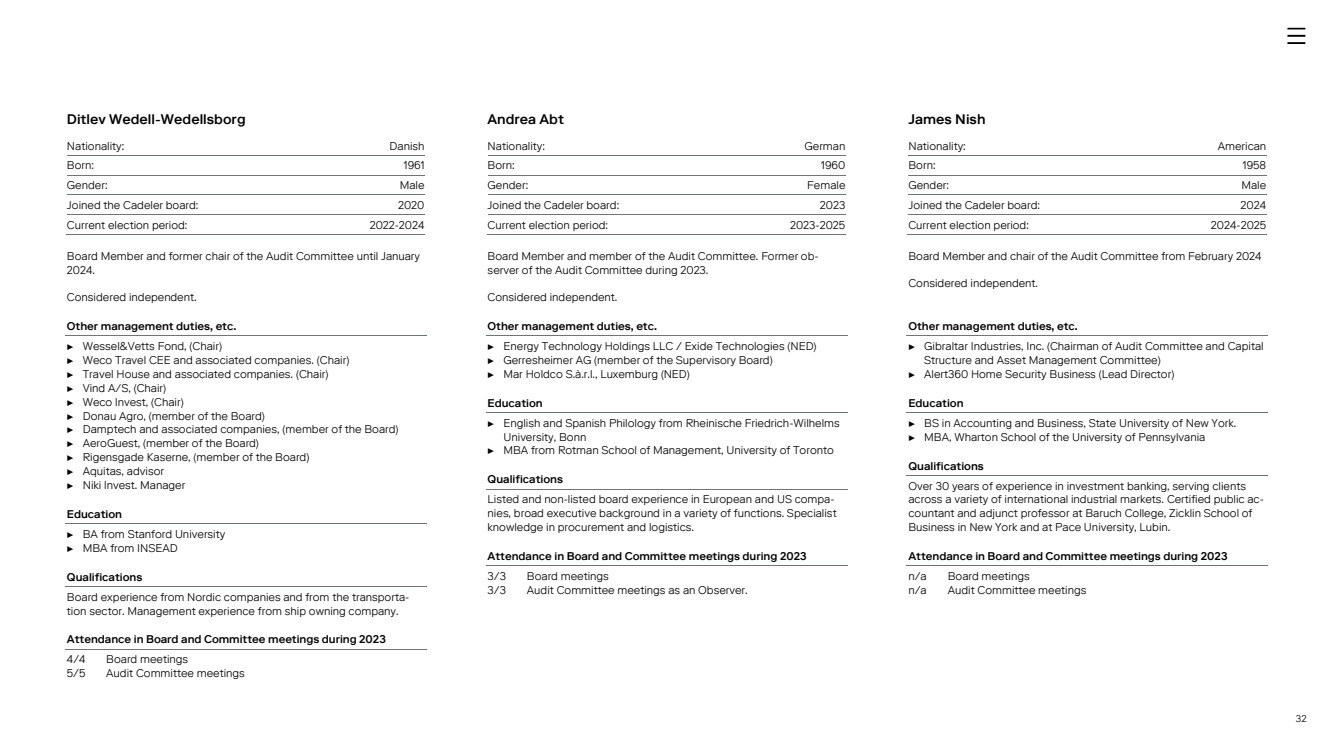
32 Ditlev Wedell-Wedellsborg Nationality: Danish Born: 1961 Gender: Male Joined the Cadeler board: 2020 Current election period: 2022-2024 Board Member and former chair of the Audit Committee until January 2024. Considered independent. Other management duties, etc. ▶ Wessel&Vetts Fond, (Chair) ▶ Weco Travel CEE and associated companies. (Chair) ▶ Travel House and associated companies. (Chair) ▶ Vind A/S, (Chair) ▶ Weco lnvest, (Chair) ▶ Donau Agro, (member of the Board) ▶ Damptech and associated companies, (member of the Board) ▶ AeroGuest, (member of the Board) ▶ Rigensgade Kaserne, (member of the Board) ▶ Aquitas, advisor ▶ Niki lnvest. Manager Education ▶ BA from Stanford University ▶ MBA from INSEAD Qualifications Board experience from Nordic companies and from the transporta-tion sector. Management experience from ship owning company. Attendance in Board and Committee meetings during 2023 4/4 Board meetings 5/5 Audit Committee meetings Andrea Abt Nationality: German Born: 1960 Gender: Female Joined the Cadeler board: 2023 Current election period: 2023-2025 Board Member and member of the Audit Committee. Former ob-server of the Audit Committee during 2023. Considered independent. Other management duties, etc. ▶ Energy Technology Holdings LLC / Exide Technologies (NED) ▶ Gerresheimer AG (member of the Supervisory Board) ▶ Mar Holdco S.à.r.l., Luxemburg (NED) Education ▶ English and Spanish Philology from Rheinische Friedrich-Wilhelms University, Bonn ▶ MBA from Rotman School of Management, University of Toronto Qualifications Listed and non-listed board experience in European and US compa-nies, broad executive background in a variety of functions. Specialist knowledge in procurement and logistics. Attendance in Board and Committee meetings during 2023 3/3 Board meetings 3/3 Audit Committee meetings as an Observer. James Nish Nationality: American Born: 1958 Gender: Male Joined the Cadeler board: 2024 Current election period: 2024-2025 Board Member and chair of the Audit Committee from February 2024 Considered independent. Other management duties, etc. ▶ Gibraltar Industries, Inc. (Chairman of Audit Committee and Capital Structure and Asset Management Committee) ▶ Alert360 Home Security Business (Lead Director) Education ▶ BS in Accounting and Business, State University of New York. ▶ MBA, Wharton School of the University of Pennsylvania Qualifications Over 30 years of experience in investment banking, serving clients across a variety of international industrial markets. Certified public ac-countant and adjunct professor at Baruch College, Zicklin School of Business in New York and at Pace University, Lubin. Attendance in Board and Committee meetings during 2023 n/a Board meetings n/a Audit Committee meetings |
|
33 Board members who stepped down in 2023 Andreas Beroutsos Nationality: Greek Born: 1965 Gender: Male Joined the Cadeler board: 2020 Served the board until: 25 April 2023 Board Member. Considered non-independent. Other management duties, etc. ▶ Ductor Oy (private, representing BW Group) ▶ PetSmart (USA; parent of NYSE: CHWY, Chewy) ▶ HIG Acquisition (NYSE: HIGA) Education ▶ BA in Social Studies, Harvard College, 1988 ▶ MBA, Harvard Business School, 1992 Qualifications Long service on multiple corporate and non-profit Boards, including as Chairman/officer, and member of Finance/Risk, Remuneration, Au-dit etc. committees. Long-term investor/asset manager for institu-tional asset managers active in Private Equity, Infrastructure and pub-lic markets. Attendance in Board and Committee meetings during 2023 1/1 Board meetings David Cogman Nationality: British Born: 1974 Gender: Male Joined the Cadeler board: 2021 Served the board until: 16 June 2023 Board Member and member of the Audit Committee. Considered non-independent. Other management duties, etc. ▶ Swire Pacific Limited (Executive Director), John Swire & Sons (Hong Kong) (Director), and director of various subsidiary compa-nies Former partner of McKinsey & Company. Education ▶ BSc in Economics, London School of Economics, 1995 ▶ MBA, Stanford Graduate School of Business, 2001 Qualifications Board and Management experience in M&A, strategy, and business development. Attendance in Board and Committee meetings during 2023 2/2 Board meetings 2/2 Audit Committee meetings Connie Hedegaard Nationality: Danish Born: 1960 Gender: Female Joined the Cadeler board: 2020 Served the board until: 16 June 2023 Board Member and chaired the Nomination Committee. Considered independent. Other management duties, etc. ▶ KR Foundation (Chair) ▶ CONCITO (Chair) ▶ OECD Round Table on Sustainable Development (Chair) ▶ Mærsk Mc-Kinney Møller Center for Zero Carbon Shipping (Vice Chair) ▶ BBVA (member of the Board) ▶ Danfoss (member of the Board) ▶ KIRKBI (member of the Board) Former EU Commissioner and Minister for Environment and Climate & Energy. Education ▶ MSc in History and Literary studies, University of Copenhagen Qualifications Solid experience from the political and regulatory arena as a result of being elected in the Danish Parliament in 1984 as well as from working as a journalist for 14 years and heading the national radio news. Serving in numerous boards in both Danish and international compa-nies as well as in public committees and commissions since 2015. Attendance in Board and Committee meetings during 2023 2/2 Board meetings |
|
34 Executive Management Mikkel Gleerup Nationality: Danish Born: 1978 Gender: Male Joined Cadeler: 2017 Chief Executive Officer (CEO) Mikkel Gleerup does not have other roles or positions of trust outside the Company. Education ▶ MBA, INSEAD, 2016 ▶ MSc in Transportation and Maritime Management, University of Southern Denmark, 2008 Qualifications Experience from working within the offshore wind segment for more than 17 years inter alia with Siemens Wind Power, Global Marine Sys-tems Ltd. and A.P. Møller-Maersk. Peter Brogaard Nationality: Danish Born: 1965 Gender: Male Joined Cadeler: 2022 Chief Financial Officer (CFO) Peter Brogaard does not have other roles or positions of trust outside the Company. Education ▶ MSc in Accounting and Auditing, Aarhus University, 1995 Qualifications Significant experience from the shipping industry and finance, among others from working as Vice President, Group Finance at the product tanker shipping company TORM Plc. where he worked prior to joining the Company. He has also held various board positions in the Torm’s subsidiaries. 34 |
|
35 Largest shareholders As per 26 March 2024, three shareholders held shares in excess of 5% of the total share capital of Cadeler. BW Altor Pte. Ltd. held 19.57%, Scorpio Holdings Limited held 12.09% and Swire Pacific Limited held 8.51% of the total share capital. Share capital increases and issuance of shares In December 2023, in connection with the share exchange offer, Cadeler issued 113.8 mil-lion shares priced at NOK 45.76 per share, corresponding to 28.4 million Cadeler Ameri-can Depositary Shares. In addition to the 197.6 million shares at the beginning of the re-porting period, the Company has 311.4 million shares in issue as of 31 December 2023. Purchase of own shares At the general meeting held on 25 April 2023, the board of directors was granted an au-thorisation in the period until 24 April 2027 to purchase own shares of the Company. The Company does not plan to repurchase any own shares for the time being other than for the purpose of satisfying its obligations under the Company’s share based incentive pro-grammes but will consider repurchasing own shares if considered preferable for the pur-pose of delivery of existing shares in connection with growth initiatives. Voting rights As per 31 December 2023, there were 311,409,868 issued shares in Cadeler. At the gen-eral meeting, each share of the nominal value of DKK 1 shall carry one vote. No share-holders have any special or different voting rights pursuant to the Articles of Association. Resolutions at general meetings shall be passed by a simple majority of votes cast, un-less otherwise prescribed under the Danish Companies Act or by the Articles of Associa-tion. Adoption of changes to the Articles of Association, dissolution of the Company, merger or demerger requires that the resolution is adopted by at least 2/3 of the votes cast as well as of the share capital represented at the general meeting. The provisions in the Articles of Association relating to a change of the rights of shareholders or a change to the capital are not more stringent than required by the Danish Companies Act. Change of control The New Debt Facility has a change of control clause which is triggered: if any person or group, excluding Swire Pacific, the BW Group, and their affiliates, gains control of 25% or more of voting and/or ordinary shares. The Holdco Facility change of control is triggered if BW Altor Pt. Ltd. and its subsidiaries (the “BW Group”) own less than 20%, or if any other entity gets 25% or more of Cadeler's shares or voting rights. This applies unless BW Group's ownership drops due to merging with a similar company, as long as they still own at least 17.5% of Cadeler, as is now the case due to the business combination with Eneti. Additionally, the P-Class Facility outlines a change of control if any individual or group, excluding Swire Pacific and the BW Group, acquires more than 25% of Cadeler's issued and outstanding share capital or voting share capital. The Credit Facility for the M-Class vessels, signed before the completion of the Eneti business combination, incor-porated provisions accommodating such an event. Despite containing a change control provision, it did not trigger amidst the business combination. Customer contracts may include change of control clauses, which are considered customary for the industry. Anti-corruption Cadeler also has a Supply Chain Sustainability Code of Conduct that outlines our expec-tations for the companies we work with. There is both a business and a moral case for ensuring that human rights and anti-corruption principles are upheld during our operation and throughout our value chain. In order to further reduce any risk of poor practice within our supply chains, we are strengthening our system for ensuring our suppliers comply with our requirements. Corporate Governance Continued from previous page |
|
36 Cadeler will continue to provide construction, maintenance, decommissioning and other services for the renewable offshore wind industry. The financial performance of the Group for 2024 is expected to result in a revenue of between EUR 225 million and EUR 245 million, compared with a revenue of EUR 109 million in 2023. EBITDA is expected to be in the range of EUR 105 million to EUR 125 million in 2024 (in 2023 EUR 43 million, and EUR 51 million for Adjusted EBITDA). Management expects that Cadeler’s performance, as a Parent Company, will result in a revenue of between EUR 123 million and EUR 143 million, which is higher than its perfor-mance in 2023, EUR 109 million. The difference in the Group’s revenue is driven by inter-company charges to its subsidiaries. In 2024, Cadeler is positioned to benefit from strong demand and growth in the offshore wind industry. The rapidly expanding contract backlog presents an appealing opportunity for significant revenue generation. The Company has signed contracts that will provide a steady, continuous flow of projects from 2024 to 2031. The contract backlog, as of 26 March 2024, will deliver a total value of EUR 1,580 million with options included at 50%. The Company’s strategic plan to expand its fleet with six new vessels, comprising two P-Class, two M-Class, and two A-Class installation vessels, will bolster its capacity to meet this demand. The delivery of these new vessels, between 2024 and 2026, will further consolidate Cadeler’s market position. Furthermore, the projected shortfall of capable offshore wind turbine and foundation in-stallation vessels from 2026 to 2027 provides Cadeler with an additional opportunity to secure more contracts. The recent merger with Eneti has extended Cadeler’s global reach and the expected realisation of significant merger synergies materialising between 2024 and 2026 will contribute to the Company’s growth and profitability. Additionally, Cadeler’s focus on enhancing utilisation and trimming costs through initiatives such as cross-utilisation of equipment, sea fastenings and tooling is expected to bring in im-proved operational efficiency and cost savings. Overall, these factors are poised to pro-pel Cadeler’s continued success in 2024. The world’s capacity to generate renewable electricity is expanding faster than at any time during the last three decades. There is a real chance of tripling global capacity by 2030 – a goal set by governments at the COP28 climate change conference in Dubai in December 2023. The offshore sector and Cadeler are looking ahead with optimism, aim-ing to overcome the value chain bottlenecks and inflation experienced in recent months. To date, Cadeler has successfully navigated the uncertainties generated by increasing interest and inflation rates, geopolitical tensions, and supply chain constraints. The Com-pany has strategies in place to further improve the customer value proposition with the largest and most flexible fleet. Given that the Group is currently in a fleet expansion phase, during which it is investing in new vessels and equipment to facilitate future growth, the Group does not expect to make dividend payments in the medium term. Cadeler's guidance for 2024 is subject to risks and uncertainties, many of which are be-yond its control. One-off market-shaping events such as strikes, embargoes, political in-stability or adverse weather conditions, could have a substantial impact on the business. There could also be off-hire periods as a consequence of accidents, technical break-down or non-performance. The cancellation or postponement of one or more vessel em-ployment contracts could have a material adverse impact on the earnings of the Com-pany. 2024 Outlook |
|
37 Reporting on Sustainability This section constitutes Cadeler’s statutory reporting on corporate responsibility cf. §99a and §107d of the Danish Financial Statements Act Also see pages 212-221 for the ESG Appendices, which contain KPIs and accounting practices related to Cadeler’s Statutory reporting 37 |
|
38 As the world faces the urgent need to combat climate change and transition towards re-newable energy sources, the offshore wind industry plays a pivotal role in steering this transformation towards a more sustainable future. With its vast potential and capacity for clean energy generation, offshore wind power has emerged as one of the predomi-nant energy sources in the global trajectory towards net zero emissions by 2050. Unlike traditional fossil fuel-based energy sources, offshore wind energy is abundant, re-newable, and emits zero greenhouse gases during operation. This makes it a crucial component in efforts to decarbonise electricity generation, reduce reliance on fossil fuels, and achieve ambitious climate targets set forth in international agreements such as the Paris Agreement. However, the industry must rapidly increase its efforts in making the entire value chain more sustainable, from a life-cycle perspective. Dedicated to serving the current and future offshore wind industry in the most sustaina-ble and efficient manner, Cadeler is a leader and key supplier in the industry for the trans-portation, installation and maintenance of offshore wind turbine generators and their foundations. Owning and operating the industry’s largest WTIVs fleet, Cadeler under-stands its pivotal role and responsibility in the outreach of reliable, sustainable, and af-fordable energy. As part of its growth strategy, in 2023 Cadeler underwent a business combination with Eneti. Starting in 2024, Cadeler’s fleet is expanding with six new wind installation vessels ordered, and the installation of upgraded cranes for the existing O-Class vessels is well under way. The investment in expanding and improving the fleet shows commitment to maintaining the Company’s status as a leading player in the offshore wind industry. As Cadeler expands, so does its capacity to bring renewable energy to customers across Europe and around the world, but the enlarged Company footprint also requires in-creased emphasis on the importance of ensuring the net environmental and social im-pacts from operations remain positive. By the end of 2023, Cadeler had installed 1324 wind turbines and 853 wind turbine foundations. Our mission is to create value for our stakeholders and the entire industry’s ecosystem. Continuous improvement of the Company’s governance, policies and procedures are more important than ever to ensure growth is sustainable and continues to benefit soci-ety. Through this approach, Cadeler strives to support the generation of more clean en-ergy than ever before while minimising any negative impacts from operations, while sup-porting our customers and shareholders meet their own ESG ambitions. Moreover, the offshore wind industry holds the promise of economic growth, job crea-tion, and technological innovation. From coastal communities to industrial hubs, offshore wind projects stimulate local economies, create employment opportunities, and drive in-vestments in research and development, boosting global competitiveness and driving forward technological advancements. Empowering the Green Horizon |
|
39 Scope 1 absolute emissions (tCO2e) Target net zero by 2035 Scope 1 emission intensity (tCO2e per MW installed or serviced) Target 50% reduction by 2030 36,846 24,905 25,479 0 5000 10000 15000 20000 25000 30000 35000 40000 2021 2022 2023 tCO2e 2023 ESG Highlights |
|
40 Safety KPIs Target zero recordable cases and zero lost time incidents Management Positions – onshore Target 30% women by 2025 - 1.00 2.00 3.00 4.00 5.00 6.00 7.00 2021 2022 2023 Total recordable case frequency rate (per million hours worked) Lost time injury frequency rate (per million hours worked) 27% 2023 ESG Highlights Continued from previous page 29% 25% |
|
41 Our Sustainable Development Framework Mission Targets Areas covered UN SDG Environment Fewer emissions for every wind turbine in-stalled, both for Cadeler as well as its sharehold-ers Commitment to presenting full overview of scope 3 emissions and Scope 3 reduction targets in next annual report Decarbonisation 7, 13, 17 Reduction of company-wide scope 1 and 2 emission in-tensity by 50% by 2030 Biodiversity 14 Cadeler commits to sourcing 100% of its electricity con-sumption from renewable sources by 2030 Circularity 12 Cadeler aims to reduce waste from its own operations by 50% by 2030 Climate Risk 13 Net-zero operations by 2035 Zero spills to the marine environment Responsible con-sumption 12 Social Maintain a safe, engag-ing, diverse and inclusive work environment on and offshore Aim for zero lost time incidents and zero recordable cases Health 3 Safety 3 2025: 30% women in leadership positions Positive workplace environment 8 Diversity 10 Governance Operate our business ethically and aim to im-plement practices that also hold our supply chain to the same stand-ard Work towards having all of Cadeler’s key suppliers com-mit to our Supply Chain Sustainability Code of Conduct by 2030 Corporate Respon-sibility and Compli-ance 10, 12 Business Ethics 12 Responsible Pro-curement 10, 12 Sustainable Development Highlights 1. Signatory of the UN Global Compact: Cadeler supports its 10 principles along with the 17 UN Sustainable Development Goals (SDGs) and commits to integrating basic principles related to human rights, worker rights, environmental protection, and anti-corruption into our business prac-tices. 2. Formally established a dedicated Sustaina-bility and Decarbonisation team in Cadeler 3. Designed a Decarbonisation Strategy dur-ing 2023 to expand on the ESG Framework of the Company and set a clear pathway towards meeting the Company’s targets. 4. Update of the accounting guidelines to ac-count for all vessel marine gas oil emis-sions as Scope 1 and take greater owner-ship of our vessels’ impact on the environ-ment. |
|
42 This year, we would like to recognise the importance of SDG 17, partnerships for the goals, and add it as a focus area in our improvement journey. Collaboration and partner-ships within the maritime ecosystem play a vital role in accelerating the offshore wind value chain decarbonisation efforts. Through development projects, joint research and pilot testing, standardisation initiatives, and knowledge sharing, stakeholders can lever-age their respective expertise and resources to overcome barriers, drive innovation, and scale up low -carbon technologies. No single entity can drive change and the industry’s transition alone. By working together with our stakeholders, Cadeler aims to collectively address chal-lenges such as infrastructure development, supply chain integration, and regulatory compliance, paving the way for a more sustainable and resilient maritime industry. Col-laboration and partnerships are not only key enablers of maritime decarbonisation, and at a higher pace, but also essential for achieving broader sustainability goals and ensur-ing a prosperous future for the maritime sector and the planet as a whole. Renewable energy companies, technology providers, governments, research institutions must join efforts to deliver on the development and adoption of innovative solutions. As a result of our ambitions, in 2023, Cadeler joined the EMRED joint industry project led by DNV. The project aims to establish a standardised monitoring and reporting frame-work for assessing greenhouse gas (GHG) emissions in the offshore wind installation sector. By developing these metrics and baselines, the project partners intend to offer a set of indicators that will enable standardisation and contribute to driving emissions re-ductions across the industry. Towards the end of 2023, Cadeler also began its involve-ment in a project led by Danish Shipping and ReFlow focused on development of a digi-tal tool for assessing lifecycle emissions of vessels. We have high ambitions to continue expanding our ESG cooperation across the industry during 2024. Partnerships to reach the Sustainable Development Goals 42 |
|
43 Throughout 2023, and ahead of the applicability of EU CSRD regulation, Cadeler has conducted a preliminary Materiality Assessment to identify and prioritise the most signif-icant environmental, social, and governance (ESG) issues relevant to our business and stakeholders. This assessment has involved analysing and engaging with a wide range of internal and external stakeholders, including employees, investors, customers, and regulators, amongst others, to gather insights into their concerns, expectations, and interests. By analysing these insights alongside our Company’s ambitions and strategy, we have been able to identify the most material ESG topics that have the potential to impact our long-term sustainability performance and stakeholder relationships. The Materiality Assess-ment serves as a critical foundation for our sustainability strategy. Through transparently reporting on these material topics, we demonstrate our commitment to addressing key sustainability challenges and driving positive impacts across our operations and value chain. Steps taken to define material topics: 1. Identifying salient environmental, social and governance issues for which the Com-pany has potential positive or negative impacts, as well as issues which may have fi-nancial materiality for the Company. 2. Identifying internal and external stakeholders (Cadeler’s list in 2023 included key cli-ents, contractors, our employees, investors, ESG rating agencies, and regulatory bodies) 3. Extracting information from internal and external stakeholders about the ESG topics they view as material to Cadeler. This was performed using a combination of direct discussions; taking note of which topics were prioritised in requests for information and questionnaires received from clients and investors throughout the year; and a materiality survey sent out to management within Cadeler. 4. Evaluating the various sources of information to identify the critical ESG topics The findings from the Materiality Assessment enabled Cadeler to adapt the Sustainable Development Strategy and reporting template to cover all topics highlighted as material issues. No major changes were made in 2023 as the results were largely consistent with the 2022 results. However, two topics were added to the list of material topics: (1) energy intensity of operations and (2) opportunities for training and education at Cadeler. Lastly, no topics were removed from the list of material issues in 2023. Materiality Material topics as defined by the 2023 assessment Environment GHG emissions Energy intensity of operations Compliance with environmental regulations Vessel improvements Use of resources/waste Marine pollution Social Occupational health and safety Diversity and equal opportunity Human rights Opportunities for training and education Governance Management of ESG topics in the supply chain Anti-corruption Business ethics |
|
44 Environment 44 |
|
45 It has become increasingly evident that the world is facing a climate emergency. At Cadeler we recognise the gravity of the climate challenge and are conscious of the ur-gent need to take decisive and immediate action. The offshore wind industry plays a vital role in shaping a more sustainable future. As an industry leader in the transport and installation of offshore wind farms, we understand the critical role that our operations play in enabling the global transition to renewable en-ergy, and we are committed to playing our part in addressing this crisis by mitigating the impacts of our operations on our planet and communities. Guided by our commitment to environmental protection, in 2021 we set the most ambi-tious climate targets in the industry. These are reflecting our commitment and efforts to leading by example and making tangible progress towards a low-carbon economy, pre-serving the health of our planet for future generations. This approach comes both with opportunities as well as challenges for Cadeler, and for that we have defined a strategy to support our journey. Key Targets: Renewable electricity commitment Cadeler commits to sourcing 100% of its electricity consumption from renewable sources by 2030. Emissions reduction target Cadeler strives to reduce the carbon intensity of operations by 50% by 2030, ensuring its contribution is in line with the International Maritime Organisation (IMO) goals. Net zero greenhouse gas emissions target Cadeler aims to achieve net-zero emissions from its own operations by 2035. Achieving this goal requires emission reductions across the fleet, innovations in operations, and re-search into reliable solutions for sequestering the greenhouse gases that the Company cannot avoid emitting. Our Decarbonisation Strategy in Response to the Climate Emergency |
|
46 The offshore wind market is recognising the importance of monitoring and tackling the GHG emissions from a life-cycle perspective. Accordingly, we have experienced a rapid surge in our customer’s interest for carbon-reduced solutions from our part of the value chain. In order to live up to our climate commitments and support our customers in reaching their climate ambitions, we have continued mapping the available solutions and taken a more accelerated approach. Establishment of a Decarbonisation and Sustainability Department In 2023, Cadeler formally established a department within the organisation solely fo-cused on the issues of decarbonisation and sustainable development. Sponsored by executive management, in this function resides the responsibility for de-signing the strategy and roadmaps for decarbonisation, as well as its execution and im-plementation. This strategic decision was a consequence of the Company’s acknowl-edgement of both the importance and complexity of meeting the challenges within these areas. Strategy for decarbonising our operations We have designed our Decarbonisation Model, as we understand that being at the fore-front of the industry’s decarbonisation journey and in order to deliver on our long-term climate action requires a clearly defined approach. Cadeler will continue to focus on reducing its emissions intensity and will intensify its de-carbonisation efforts through three key levers; 1) optimizing energy consumption 2) ena-bling direct electrification, and 3) adopting green fuels. Optimizing Energy Consumption: Unlocking the vast potential of optimizing our energy consumption across the fleet, will continue to be one of Cadeler’s priorities in the short-term. This requires continuously in-vestigating and implementing energy efficient solutions (both operational and techno-logical) on existing assets, to further reduce carbon intensity. However, understanding how energy is consumed onboard the vessels is a key driver for Cadeler towards improving energy efficiency. During 2023 we continued expanding on our fuel monitoring systems, enabling sufficient real-time data to be utilised to drive im-provement actions Additionally, a heavy focus has been put on delivering new-build assets with a signifi-cantly higher level of efficiencies by design. All these initiatives will form the foundation of a future low-carbon fleet for Cadeler. Enabling direct electrification: Due to the nature of Cadeler’s cycle-based operations, electrifying our vessels through shore-power connection while loading and unloading at port will be an essential driver to cut our emissions. This solution, which will be enabled both onboard the O-class vessels and our new-builds, is estimated to result in up to 15% emissions reduction yearly. Benefiting from renewable power sources while at berth, however, requires the port and grid infrastructure to be developed and enabled, providing reliable and green power to the vessel. For this, Cadeler’s focus will also be on identifying and working closely to-gether with its major service ports and customers, and support and promote the readi-ness for adoption of green electricity. Our climate progress in 2023 |
|
47 Adopting green fuels: Transitioning to the use of green fuels in our vessels will be essential for Cadeler’s decar-bonisation journey, as they provide the unique pathway towards our net-zero commit-ments, providing up to 95% GHG emissions reduction. During 2023, Cadeler commenced exploring the update of certified biofuels and renewa-ble diesel in our current O-class vessels, as these provide a readily available solution to-wards reducing emissions related to engine combustion, replacing fossil fuels. Addition-ally, these blend-in fuels don’t require our vessels to undergo major retrofits, enabling a smooth and immediate adoption. Another major focus of Cadeler, however, is on building a fleet of vessels able to run on alternative fuels in the future. With the ordering of six new-builds, significant resources have been allocated during 2023 into preparing these vessels to ensure they are ready for conversion to run on these fuels. Green methanol has been identified as the soonest available option, following the increased demand for this fuel in the shipping sector, en-couraging the entire supply infrastructure to be developed within coming years. Several fuel pathways have been explored, however, and during 2024 we will continue following and investigating the alternatives in the market. Our Decarbonisation Model to meet Cadeler’s 2030 and 2035 climate targets: Cadeler views reduction of emissions at the source as a more effective and responsible strategy than reliance on carbon offsetting to achieve reduction of its carbon footprint. We don’t envision it as a linear decrease of emissions but believe that decarbonisation will be a transition with continuous improvements and upgrades until 2035 and beyond, based on the technical readiness and the Company’s growth projections. Our climate progress in 2023 Continued from previous page |
|
48 Based on Cadeler’s decarbonisation strategy presented in the previous section, our fleet has continuously been adopting low-emission solutions. P-class vessels, Wind Pace and Wind Peak Cadeler previously announced plans to build two new wind farm installation vessels. The Company confirms its intention to deliver vessels that are more eco-friendly than Wind Orca and Wind Osprey. A decade of innovative solutions since the delivery of the O-class vessels will enable us to implement energy efficiency and emission reduction technolo-gies. Improvements to the design include shore power connections (expected to reduce fuel consumption by up to 15%), fuel-efficient engines and optimised engine sizing. Other refinements include an onboard power-saving system, which includes batteries covering >10% of energy required for crane operations and ~10% of energy required for DP and manoeuvring, regeneration of power from the jacking system and variable frequency drives. Cadeler has intentions to move towards alternative fuels when the right technol-ogies are commercially available and has already invested resources in ensuring the newbuild vessels can undergo a conversion to alternative fuels in the future. The Com-pany has built readiness for conversion to alternative fuels into the design of the P-Class newbuild vessels. A-class vessels, Wind Ace and Wind Ally In 2022, Cadeler announced the further expansion of its fleet to include two jack-up foundation installation vessels designed with a hybrid purpose, allowing the vessels to convert from being foundation installation units to WTIVs within a short period of time. Both A-class vessels will be equipped with the same green design elements as the P-class. Cadeler has intentions to move towards alternative fuels when the right technolo-gies are commercially available and has already invested resources in ensuring the new-build vessels can undergo a conversion to alternative fuels in the future. The Company has built readiness for conversion to alternative fuels into the design of the A-Class ves-sels. M-Class newbuilds, previously the Eneti newbuild programme Cadeler took over management of the newbuilding processes for the M-Class vessels at the end of 2023. The vessels are expected to be equipped with shore power connec-tions, a closed ring/bus system for improved power management and improved effi-ciency, staggered sized diesel generators (allowing for running of engines at more opti-mal loads for fuel to energy efficiency), a battery energy storage system with regenera-tion from the jacking system, and implementation of LED type lighting. Cadeler will con-tinue to evaluate and expects to be able to provide more details estimating the im-proved CO2e emission performance of these vessels in the future. O-Class, Wind Orca and Wind Osprey The Company previously announced the intention to invest in improved fuel tracking sys-tems for our O-class vessels. The fuel monitoring systems were installed in the first half of 2023, and we are now working on our processes for using the data as a tool in our decar-bonisation journey. Installation of these systems is expected to be an improvement that will enable the vessels to track fuel consumption more accurately, identify operational ar-eas for improvements, and set best practice standards for engine efficiency. In last year’s report, Cadeler also announced its intention to install shore power connections on the O-class vessels. Implementation of shore power on the vessels is in the planning process, and the installation is expected to progress during Q1 2025. Wind Scylla and Wind Zaratan Cadeler took on management of these vessels at the end of 2023, and in future report-ing, we will also include statements on initiatives taken to reduce CO2e emissions and other environmental impacts from these vessels. Fleet decarbonisation overview |
|
49 Scope 1 Scope 2 Scope 3 2023 emissions Scope 1 - direct emission sources Scope 2 - indirect emission sources Scope 3 - indirect emission sources Tonnes CO2e 25,479.30 Tonnes CO2e 22.66 Tonnes CO2e 780.85 % of Cadeler's emissions in 2023 96.94% % of Cadeler's emissions in 2023 0.09% % of Cadeler's emissions in 2023 2.97% Vessel marine gas oil (MGO) and all lube oil consumption (tank to wake emissions), fuel for company cars, vessel F-gas related emissions. Cadeler has updated its accounting guidelines to ac-count for all vessel MGO related emissions as Scope 1. Some on hire periods were categorised as Scope 3 in past years. While we still don’t have control over every operational decision on certain contracts, we believe, by categorizing all vessel MGO emissions as scope 1, we take greater ownership of our vessels’ impact on the environment. Office electricity consumption, office heat consumption, electricity for company electric cars Currently limited accounting, air travel for vessel and office personnel, helicopter crew changes, to be expanded in 2024 reporting to capture emissions more fully. |
|
50 Cadeler views every MW of wind power installed or repaired as a service providing socie-tal benefit, so the aim is to maximise the Company’s positive impact against the nega-tive impact of greenhouse gas emissions from operations. To improve upon this metric, Cadeler strives to maximise the usage of its vessels for projects which support the en-ergy transition, while reducing the emissions from operations via improvements to the technical systems on our existing and future vessels, improve its operational practices, and ensure its vessels maintain their ability to serve the requirements of the offshore wind market. In line with the Company-wide net zero goal, Cadeler will aim to approach zero tonnes of CO2e emitted from our vessel engines per MW installed or serviced by 2035, from a 2021 baseline. Cadeler is working to reduce the emissions intensity of its operations and improve the performance of its assets. In order to achieve this target, the Company needs a baseline upon which it can improve. Our baseline year has been defined as 2021, the first full year Cadeler operations as an independent entity. Last year, Cadeler defined two new metrics for tracking emissions intensity: 1) Emissions per MW installed or serviced and 2) Emissions per Revenue. We intend to report these metrics on an annual basis. This year, we will slightly adapt these metrics from focusing on vessel engine emissions to all scope 1 emissions. This is the consequence of Cadeler redefining the split between scope 1 and scope 3 emissions in 2023; this change has moved all vessel engine related emissions into the scope 1 category and therefore pro-vides a simpler definition going forward. The majority of scope 1 emissions are attributa-ble to running of the vessel engines, so the figures presented here are very comparable to the data presented last year. KPI 1: GHG Emissions per MW installed or serviced (tCO2e/MW) → Scope 1 CO2e emis-sions versus our annual installation of wind turbine generators and foundations and maintenance of offshore wind power capacity. The core purpose of Cadeler is to support the transition to a renewables-based energy grid. Hence, we see importance in judging vessel performance based on the efficiency of supporting the installation and maintenance of turbines in terms of how much carbon the vessel emits (negative impact) per MW of offshore wind power installed or serviced (positive impact). Scope 1 emissions (tCO2e) per MW installed or serviced Emissions Intensity |
|
51 KPI 2: GHG emissions per EUR revenue (tCO2e/Million EUR) → Scope 1 CO2e emissions versus our annual revenue has been incorporated in 2023 as a key metric for Cadeler. This KPI reflects our commitment to drive decarbonisation strategies that align with our Company’s growth objectives, driving innovation and efficiency across our operations. Measuring and managing our environmental footprint in a transparent manner that inte-grates sustainability with our business success is our way to show accountability. Scope 1 emissions (tCO2e) per Revenue (mEUR) Emissions Intensity Continued from previous page 51 |
|
52 Environmental Performance Data unit 2023 2022 2021 2020 Scope 1 CO2e* Tonnes 25479.30 24905.21 36845.50 23190.03 Scope 2 CO2e Tonnes 22.66 22.15 15.65 7.78 Scope 3 CO2e* Tonnes 780.85 666.38 418.85 270.00 Total CO2e Tonnes 26282.81 25593.74 37280.00 23467.81 SOx Tonnes 155.97 151.34 224.57 133.12 NOx Tonnes 451.52 330.68 490.68 290.85 Particulates - PM10 Tonnes 8.34 - - - Particulates - PM2.5 Tonnes 7.10 - - - NMVOCs Tonnes 14.50 73.40 108.92 64.56 Fresh water consumed m3 11152.75 9856.65 11672.00 12769.00 Plastic waste disposed (vessels) m3 180.90 182.80 279.40 195.64 HFC-134A Kg 0.52 0.78 1.00 15.00 HFC-404A (We have phased out use of HFC-404A from 2020) Kg - - - - HFC-407C Kg 23.50 52.90 19.00 80.20 HFC-407F Kg 7.00 20.65 - - HFC-410A Kg - - - - HFC-R32 Kg - - - - HFC-452A Kg - - - - Uncontained Spills (hydrocarbon or chemical) Occurrences 1.00 2.00 - - * Scope 1 and Scope 3 redefined in 2023 to consider all emissions related to combustion of MGO in vessel engines as Scope 1. 2020, 2021, and 2022 restatements available in table above |
|
53 Protecting the marine environment Cadeler is committed to meeting all environmental regulations for the operation of its vessels in accordance with the laws under which it operates and the Danish Flag State. Aiming for zero spills The Company has placed a high priority on ensuring zero spills of hydrocarbons and other toxic substances into the marine environment. Checks are performed to ensure proper storage of chemicals and hydrocarbons on board and that sufficient secondary containment is available. Each vessel carries a shipboard marine pollution emergency plan (SMPEP) and regularly performs ship oil pollution emergency plan drills (SOPEP). Cadeler had one minor spill on a quayside in 2023 (approximately 1 litre). We are uncer-tain whether any oil entered the water but have decided to categorise this incident a spill to the marine environment for transparency. Ballast water protocols To prevent the spread of invasive aquatic species, Cadeler complies with the Ballast Wa-ter Management Convention. The vessels have a ballast water management plan, keep a ballast water record book and have an international ballast water management certifi-cate. In 2021, ballast water treatment plants were installed on board, ensuring compli-ance with the D-2 Ballast Water Performance Standard. All newbuilds will be delivered with ballast water treatment plants. After the incorporation of Eneti into the Cadeler busi-ness, Cadeler still maintains a fleet with 100% utilisation of ballast water treatment plants onboard. Focus on circularity and reducing our consumption of resources The use of resources and the production of waste across our operations will receive a greater focus, as there is potential for improvement and the Company’s stakeholders have highlighted the topic as an important area for improvement. Overall improvement target By 2030, Cadeler aims to reduce waste from its own operations by 50%. We intend to achieve this target by avoiding production of waste where possible and improving our rates of recycling and reusing waste. Waste production and management Cadeler previously highlighted the use of single-use plastics, as this is a waste category with elevated potential to negatively affect the marine environment. Cadeler will con-tinue its aim to avoid single-use plastics wherever substitutes can be found and will also expand its attention to all categories of waste. Cadeler intends to place a greater focus on reducing the production of waste from its operations and supply chain. Cadeler also intends to put more effort into ensuring the recycling and reuse of waste, wherever pos-sible. Cadeler will consider whether improvements require an update to our garbage management plan during 2024. Installation of new tap water systems Cadeler installed new Hatenboer tap water systems onboard Wind Orca and Wind Os-prey in 2023. The Company implemented the change with the intention of reducing plas-tic waste. The system ensures crews and clients have access to fresh drinking water us-ing the vessels potable water system, eliminating the requirement for delivery of fresh water in plastic drums to the vessels. Environmental Improvement Programme |
|
54 Consider end of life for assets and project equipment It is important that the Company also find solutions for the eventual recycling and reuse of components from its vessels and the major components used for operations, such as sea fastening. Cadeler will consider whether a second life can be found for any key com-ponents and will investigate how it can ensure that eventual recycling of its assets is per-formed in a responsible manner. Additionally, as we enter the foundation installation space, on some contracts, Cadeler expects to gain responsibility for the design and delivery of secondary steel structures that serve as the connection point between offshore wind turbines and the monopiles they are installed. We commit to investigating, alongside our clients, how these struc-tures can be designed and delivered with a lower overall environmental footprint. Sale of O-Class cranes The disassembled 1200 t cranes of Wind Orca and Wind Osprey got a second life instead of being scrapped. Cadeler signed the sale of both cranes of Wind Orca and Wind Os-prey to Hapo International Barges. The sales give the cranes a second life destined to perform heavy load lifting for years to come. “The sale is one of those absolute win-win situations for both parties. As far as we’re in-formed, this is the first-time cranes from a WTIVs are being sold to fulfil a meaningful second life – a solution that is in line with our target to place greater focus on circularity. We’re very appreciative of Hapo International Barges’ commitment to expand the life-time for these great cranes that heroically have served Cadeler and the green transition to renewable wind energy”, said Cadeler’s CEO Mikkel Gleerup. ▶ The cranes are each capable of lifting 1200 t with a boom length of 115 m. ▶ The cranes were sold including all spare parts in Cadeler storage in Esbjerg. ▶ The new owner is Hapo International Barges, a specialist in providing heavy lift ca-pacity, pontoons, and crane barges around the world. ▶ The current plan is that the cranes will be retrofitted to shallow water barges. ▶ Significant engineering work is required to fit the new barge concept. ▶ The retrofitting process will take approx. 9-12 months. Environmental Improvement Programme Continued from previous page |
|
55 Cadeler works to meet the environmental legal requirements of the countries in which it operates. The Company aims to deliver effective monitoring of its impact on the environ-ment, ensuring risks associated with operations are appropriately identified and man-aged. To sufficiently manage environmental impact, an organisation must consider all environmental issues relevant to its operations, such as air pollution, water pollution, sewage management, waste management, soil contamination, climate change mitiga-tion and adaptation, and resource use and efficiency. To control and improve environmental performance, Cadeler has a management manual, HSEQ policy and sustainable development policy in place. These documents outline cor-porate practices for working towards a sustainable future, by maximising positive envi-ronmental impacts, minimising negative impacts, and holding ourselves accountable for any damage we may cause. Cadeler’s ISO 14001:2015 certified environmental manage-ment system establishes the set of formal policies, processes and requirements imple-mented to minimise environmental impacts from our operations. It covers all Cadeler’s vessels, operational sites, offices and activities. Emissions for scope 1 and 2 activities are tracked and reported annually. Emissions from some scope 3 activities are also tracked and reported annually on a limited basis, and in the coming year, the Company aims to expand its scope 3 reporting towards fully captur-ing the upstream and downstream impacts related to operations. To report on emis-sions, Cadeler looks to the GHG Protocol Corporate Standard as its guide. The Company uses the definition of operational control to set our organisational boundary, so Cadeler aims to account for emissions from all facilities and assets where it has authority to in-troduce and implement operating policies, as scope 1 emissions. Cadeler has equipment in place on board the vessels for tracking the consumption of fuel, lube oils and other substances that eventually result in the release of CO2 and other gases into the atmosphere. The marine gas oil purchased is required to meet the sulphur emission caps in the North Sea and Baltic regions (0.1% concentration). Additionally, NOx emissions from the vessels may not exceed the upper limits set in MARPOL Annex VI. Cadeler records and manages other impacts related to its offshore operations. The Company monitors consumption of F-gases used as refrigerants. Cadeler also has a wa-ter management plan in place, under which consumption of fresh water is tracked and any discharges of ballast water or grey water from the vessels are recorded. Another core part of environmental management on board the vessels is the garbage manage-ment plan. Cadeler records its total waste production and ensures segregation of waste onboard so that it can be properly managed when offloaded on the quayside. The ves-sels also have a shipboard marine pollution emergency plan, which outlines the practices intended to prevent spills into the ocean. It ensures the crews know how to act if any in-cident should occur and have the necessary clean-up equipment available. The operation of the vessels is the core source of environmental impact, but Cadeler also records impacts from the onshore segment of the business. Variables tracked in-clude electricity and heat consumption from the offices, fuel and electricity consumption from company cars, freshwater consumption, and emissions from flights booked for business travel. Looking forward, Cadeler intends to continue taking voluntary steps to improve environ-mental performance, measure its environmental performance, and report transparently on the Company’s impact. Cadeler has designated departments responsible for manag-ing decarbonisation, sustainable development and environmental issues. Environmental Management |
|
56 Social 56 |
|
57 Cadeler’s number -one priority remains the health and safety of the people on board its vessels and in its offices. The Company continuously works to improve its health and safety processes, ensuring its employees and project partners have a secure workspace. After the incorporation of Eneti into Cadeler, the focus on health and safety is even higher as we aim to ensure the same standards are reached on every vessel in our fleet, that best practices from both sides are implemented, and we speak the same language around safety across the entire organisation. Cadeler believes all employees contribute towards the maintenance of a safe working environment and operates an intervention policy. Every person at a Cadeler work site has the authority and the responsibility to in-tervene in any job, activity, or scenario, wherever there is a concern for safety. Cadeler operates with the objective s of ensuring safety at sea, preventing human injury and loss of life, and avoiding negative impacts on the environment. The safety manage-ment objectives of Cadeler remain focused on defining safe practices for vessel opera-tions by controlling all identified risks to the Company’s ships, personnel, and the envi-ronment; and establishing appropriate safeguards. Cadeler’s safety management system promotes safe operations by ensuring compliance with the mandatory rules and regulations of relevant international jurisdictions and flag state legislation. DNV and Lloyds Register have audited and issued certification that Cadeler’s systems, processes and operations comply with the requirements of ISO 9001/14001/45001. The relevant flag states, or entities authorised by them, have issued a ‘Document of Compliance’ that Cadeler operates vessels in compliance with ISM code requirements. Cadeler continues to improve and customise its management system so that it better meets the unique needs of its business, providing operations as a transpor-tation and installation contractor. Since the combination with Eneti in Dec 2023, Cadeler has operated on separate systems, but we are working to integrate the management system s and m erge KPI reporting during 2024. Commitment to Health and Safety 57 |
|
58 Health, Safety, Environment and Quality (HSEQ): Statistics1 12023 figures include Eneti performance for the portion of the year after the merger (after 19 December 2023) 2Total person working hours: for office employees, calculated based on monthly hours worked as per contract. For seafarers, calculated as vessel days x 12hrs. 3Total recordable case frequency rate = total recordable cases / total person working hours x 1,000,000. 4Lost time injury frequency rate = lost time incidents / total person working hours x 1,000,000. 5Statistics cover Cadeler’s seafarers and shoreside employees while working at sites for which Cadeler is re-sponsible (in our office, onboard our vessels, on the quayside reserved for our project works). 20231 2022 2021 2020 2019 Total person working hours2 570,700 483,494 459,544 264,672 363,329 Fatalities 0 - - - - Lost time incidents 1 1 1 - - Total recordable cases 1 2 3 1 1 Total recordable case frequency rate (per million hours worked)3 1.75 4.14 6.53 3.78 2.75 Lost time injury frequency rate (per million hours worked)4 1.75 2.07 2.18 0.00 - Cadeler uses two metrics as primary indicators of overall safety performance: total recordable case frequency (TRCF) and lost time injury frequency (LTIF). |
|
59 Cadeler aims for continuous improvement in its HSEQ performance. This requires a cul-ture of learning both from internal experience and from industry experience. The Com-pany constantly strives to update processes and performance in the areas where it sees the most potential for improving safety. Towards the end of 2022, Cadeler initiated a safety leadership programme focused at further strengthening the safety culture within the Company. This programme was intro-duced to all seafarers on the O-Class vessels and across relevant departments in Febru-ary and March 2023, and the programme will be introduced on Wind Scylla and Wind Zaratan in 2024. The safety leadership programme aims at continuous improvement of the core HSEQ controls in the Company, combined with a concept developed to pro-mote employee behaviours and attitudes that lead to improved safety performance. A solid framework to stimulate a strong safety culture is vital as Cadeler grows, and we must ensure we can maintain and improve our safety culture, regardless of how many new colleagues are welcomed to the team. Cadeler continues to maintain a strong focus on safety observations, both proactive and reactive. The offshore crews have shown excellent initiative make observations related to their working environment, noting risks and suggesting potential improvements. To strengthen the effectiveness of this reporting system, Cadeler presents a monthly safety award, encouraging all employees to report their observations and also increase the quality of their reports. This decision has led to better reporting coverage, including more detailed information. This, in turn, has provided a more solid foundation for reporting KPIs, and has continued to be a successful aspect of our safety culture throughout 2023. Cadeler continues to track Yellow/Red Case Frequency as a leading indicator, recording occurrences of high-risk situations that either led to incidents or had the potential to lead to incidents. The Company’s principle is that focusing on reduction of risky behaviours and situations will prevent incidents from taking place. Similarly, Quality fo-cused KPI’s are intended to be established during 2024, and data will be recorded to track progress of our performance in this area. Yellow/Red Case Frequency (YRCF): HSE YRCF definition: Yellow/Red Case Frequency is the number of health, safety and environmental accidents, near misses and observations with a red (high) or yellow (me-dium) risk potential per million person working hours. The risk potential associated with a case is defined by Cadeler’s risk assessment matrix, which accounts for the potential se-verity of risk. 0 2 4 6 8 10 0.00 5.00 10.00 15.00 20.00 25.00 30.00 Number of cases Frequency per million working hours Total HS Yellow cases Total HS Red Cases HS - YRCF (*) HSEQ Improvement |
|
60 Company management system Cadeler operates on an integrated management system that has combined processes and procedures for the management of safety, environmental, and quality related issues across our operations. The system includes company policies, general operating proce-dures, definitions of accountability, emergency plans and risk registers. Post integration with Eneti, Cadeler has worked to merge the Company management systems and will continue to do so during 2024. The Cadeler management system is under continuous improvement, ensuring that all operations are in line with legal requirements, best practices, and stakeholder expecta-tions. All Cadeler’s vessels, operational sites, offices, and activities are covered under the management system and are thereby certified under the standards listed to the right. Company certifications International Safety Management (ISM) Certified by DNVGL and Lloyd’s Register. ISO 14001 Certified by DNVGL and Lloyd’s Register – assurance of our Company environmental management system. ISO 9001 Certified by DNVGL and Lloyd’s Register – assurance of our Company quality manage-ment system. ISO 45001 Certified by DNVGL and Lloyd’s Register – assurance for onshore and offshore sites in addition to ISM. eCMID certification The IMCA eCMID system, which provides the marine and offshore industry with a stand-ardised format for vessel inspection, is performed by accredited independent IMCA in-spectors. It offers a health check of the safety management system. Cadeler has been inspected annually since 2014. Cadeler Certifications and Management Systems |
|
61 Offshore services All of our vessels are staffed by qualified medics and feature onboard clinics that offer services mandated by the flag state. To ensure the well -being of our offshore employ-ees, a mandatory medical examination is conducted every two years, aligning with indus-try standards. This precautionary measure aims to mitigate the risk of individuals going offshore if it poses a threat to their own well -being or the well -being of the rest of the crew and the vessel. In addition to providing onboard health services, Cadeler takes responsibility for promot-ing a healthy lifestyle while onboard. Our vessels are equipped with gyms, facilitating daily exercise, and full -service canteens that ensure our personnel have access to a var-ied diet during extended periods at sea. Onshore offering Cadeler sustains its health initiative Cadeler Care in a variety of different ways to support both physical and mental health. Onshore employees benefit from an annual health check and the opportunity for a comprehensive medical examination every three years. In our offices, where possible, there is an in -house gym accessible to all employees and fresh fruit is available on a daily basis. Furthermore, Cadeler provides all employees, both onshore and offshore, with a supply of vitamins and minerals to match seasonal needs and the option to receive a flu vaccine at the Company's expense. First aid training Offshore personnel are required to participate in recurring training s on administering first ai d. Additionally, office -based employees are offered a first aid course every two years. This commitment ensures that, in the event of a health emergency at any Cadeler worksite, a trained individual in first aid response is readily available. Workplace Health Programme 61 |
|
62 Cadeler not only prioritises a safe and healthy workspace, but also upholds the responsi-bility of fostering a positive, flexible work environment for its employees. This is the re-sponsibility of all Cadelers, with the support from two specialised departments: People and Culture and Marine HR. This division is based on the recognition that Cadeler oper-ates in two distinct work environments, onshore and offshore, each with its own set of unique considerations. Equality, Diversity & Inclusion One of the ways Cadeler fosters a positive work environment is by being an equal oppor-tunity employer and cultivating a diverse and inclusive environment. Cadeler views diver-sity not just as a commitment but as a fundamental aspect of its success. The Company actively promotes equality, acknowledging that diversity in race, gender, sexual orienta-tion, religion, age, national origin, and other characteristics contributes to a healthier and more inspiring work environment. Cadeler is unwavering in its commitment to treating all individuals with dignity and respect, fostering a workplace that champions diversity and inclusion while opposing any form of discrimination or harassment. In 2023, Cadeler revised its parental care policy for employees based in Denmark to sup-port a healthy life balance and promote equal opportunities for all family structures. Cadeler goes above and beyond the statutory laws and regulations in this respect and offer gender-neutral paid leave and gives additional flexibility to balance life. This policy therefore acknowledges that employees, irrespective of their personal identity and their family-constellation, will have the same rights in terms of parental leave, so everyone can have equal opportunities, flexibility, and support. Cadeler is dedicated to maintaining its standing as an appealing employer, ensuring fair and market-competitive remuneration for its workforce. The Company adheres to all rel-evant employment laws and expects the same from the organisations it works with. Company Growth Throughout 2023, Cadeler continued to grow as the Company strengthened its teams with additional resources underwent a merger. As Cadeler grows, it continues to value its workforce and understands that any company is only as strong as its people. Cadeler therefore works to safeguard the culture and remains committed to ensuring the right cultural fit of employees while growing. The Company is continually looking for innovative ways to attract new talent and bring the right people on board. In 2023, Cadeler implemented a new recruitment process to secure a transparent and professional selection of new colleagues and to ensure con-sistency in the evaluation of candidates. Additionally, Cadeler invests in the development of its employees. In 2023, many em-ployees have undergone training to enhance their skills, and several leaders and poten-tial leaders have participated in a leadership programme with the intention to build on their leadership competences to foster stronger teams. Cadeler as a Workplace Average number of Cadeler full time equivalent employees for the reporting year. Figures do not include con-sultants or contractors. Eneti employees, both onshore and offshore, were incorporated by the Company by end of December 2023. Thus, average number of full-time employees as of 2023 reflect the number of employ-ees divided by 12 months. Eneti had 99 onshore full time employees and 181 seafarers by the end of 2023. Employee statistics 2023 2022 2021 2020 2019 Office based employees 113 70 58 42 33 Vessel based employees 182 162 12 - - Total employees¹ 295 232 70 42 33 |
|
63 Senior Leadership Team/Executive Leadership Team Leadership Positions Onshore 2025 goal 30% women Collaboration & Involvement Cadeler encourages high levels of employee involvement and is in continuous dialogue with employees about the future direction of the Company and their individual motiva-tion and development. In 2023, Cadeler implemented a new goal setting framework with a focus on collaboration and involvement, where every employee can see their contribu-tion to the Company. On a social level, Cadeler fosters an environment where employees get to know their col-leagues, both on a professional and personal level, by organizing events and activities that bring people together. Workplace Assessment In 2023, Cadeler again performed a workplace assessment (Danish requirement) to en-gage its employees on how to improve the workplace. Cadeler included Wind Orca and Wind Osprey for the first time and saw high levels of participation and engagement, re-sulting in action plans made by the crews onboard for resolving some of the items identi-fied. Charts to the right and on the next page: diversity statistics for employees at Cadeler. Note: all diversity statistics account for the status as of 31 Dec 2023. Cadeler as a Workplace Continued from previous page |
|
64 Gender Balance Onshore - End of 2023 Gender Balance Offshore - End of 2023 men women Generational Diversity Onshore - End of 2023 15 249 85 Generational Diversity Offshore - End of 2023 Under 30 30-50 Over 50 |
|
65 Governance 65 |
|
66 Cadeler’s framework for corporate governance is intended to decrease business risk, maximise value and utilise our resources in an efficient, sustainable manner, for the ben-efit of shareholders, employees and society at large. Further information on Cadeler’s approach to corporate governance is included in the Corporate Governance section of the Management Review. When it comes to management of CSR topics, some of the responsibilities of Cadeler’s Board of Directors are defined in the Corporate Governance Manual. The Board is re-sponsible for ensuring that Cadeler has sound internal control and systems for risk man-agement (including those in respect of corporate values, ethical guidelines, and guide-lines for corporate social responsibility) that are appropriate and in proportion to the na-ture and extent of the Company's activities. The Board must, at a minimum, carry out an annual review on the Company's exposure and control of risks, including CSR topics. Additionally, the Board is responsible for establishing guidelines for the Company's re-porting of information via the Annual Report, including sustainability reporting. The Board ensures this reflects the Company's corporate social governance performance and strat-egy. The CSR report is issued once per year with the Cadeler Annual Report and covers the period from 1 January to 31 December. In order to manage CSR -related topics on a day -to -day basis, Cadeler has an HSEQ de-partment responsible for matters related to health and safety, a People and Culture de-partment and a Marine HR department responsible for employment matters, and a De-carbonisation and Sustainability department driving the Company’s overall sustainability strategy. A Business Ethics and Legal Compliance Partner joined in Q1 2023. The CEO takes responsibility over important CSR issues and escalates matters to the Board of Di-rectors as necessary. Our Structure and Governance of CSR topics 66 |
|
67 Raising concerns All employees are encouraged to raise concerns wherever they identify activities which are not aligned with Cadeler values and behaviours. Cadeler encourages employees to raise concerns in the first instance directly to line management. In circumstances where this is not possible or it may be more appropriate to do so due to the nature or seriousness of the concern, confidential reporting (Speak Up) channels are available. These can be used by any person with a relationship to Cadeler (including our suppliers and clients) to raise serious concerns about any sus-pected violation of the Cadeler Code of Conduct, our policies and procedures or applica-ble laws and regulations. The reporting channels are supported by procedures that ena-ble concerns to be raised responsibly and securely without fear of adverse conse-quences. In 2023, Cadeler's Board reviewed and approved updates to these procedures to ensure continued alignment with best practice and legislative requirements. A ‘Speak Up’ notice is communicated to employees internally and is also publicly available on our website (www.cadeler.com). Bribery and corruption Cadeler has a zero tolerance for bribery and corrupt payments in whatever form, whether given or received, directly or indirectly, anywhere in the world. We seek to address the risks of bribery and corruption in our value chain through our Supply Chain Sustainability Code of Conduct, which applies to any suppliers who do work on Cadeler’s behalf. The processes and procedures through which Cadeler onboards new suppliers is subject to continuous review and improvement. In 2023 we enhanced our due diligence efforts through the procurement of an electronic due diligence tool to help identify risks associ-ated with financial crime, sanctions, and other responsible business practices within our existing supplier population and as part of the onboarding process for new suppliers. In the coming year, Cadeler intends to integrate this tool to help formalise processes for systematically identifying, assessing, and addressing risks related to responsible busi-ness practices in our supply chain. Fair competition Cadeler is committed to complying with national and international standards for ensuring fair competition. This includes prohibitions on anti-competitive behaviour (such as price-fixing or the exchange of competitively sensitive information with or between competi-tors) which may amount to an infringement of applicable competition laws. Responsible Business |
|
68 Human rights and modern slavery An important part of Cadeler’s commitment to responsible business is respecting human rights in accordance with internationally recognised standards. There is both a business and a moral case for ensuring that human rights principles are upheld during our opera-tions and throughout our value chain. Cadeler recognises that operation of a global busi-ness means that some resources and services might be procured from higher risk re-gions. Cadeler acknowledges the material risk of indirectly contributing to human rights impacts in the supply chain, for example via forced labour or less than fair labour agree-ments. For this reason, Cadeler continues to work to identify, prevent and mitigate any risk of adverse human rights impacts resulting from or caused by our business activities. Our approach is informed by the International Bill of Human Rights, the UN Guiding Principles on Business and Human Rights, and the International Labour Organisation’s Declaration on Fundamental Principles and Rights at Work. Cadeler is also a signatory to the UN Global Compact. Cadeler’s Human Rights Policy sets out our commitment to respecting the human rights of our employees and those who perform work on behalf of Cadeler and prohibits the use of all forms of modern slavery, forced labour and human trafficking. In 2023, there were no reported cases concerning potential human rights violations through Cadeler's confidential reporting (Speak Up) channels, or, to the best of Cadeler's knowledge, through other available channels. Responsible supply chain Cadeler actively seeks to select and work with suppliers who not only comply with laws and regulations, but go beyond by setting standards that are expected of an industry leader. Cadeler has a strong preference to work with suppliers who share the Cadeler commitment to honesty and integrity and who seek to integrate principles of sustainable development into all areas of their business. The Cadeler approach is supported by the Company Sustainable Development Policy and Supply Chain Sustainability Code of Conduct. This commits Cadeler to preferring to work with suppliers who share the same standards and promote sustainable develop-ment. Training and engagement In our 2022 Annual Report, Cadeler committed to ensuring 100% of relevant employees were trained in key responsible business topics, such as anti-bribery and corruption as well as data protection and privacy. In 2023, members of Cadeler's Senior Leadership Team received face-to-face ethics & compliance training on anti-bribery and corruption, data protection and privacy, and competition law. In addition, during the course of 2023, Cadeler's sales teams received tailored face-to-face training on key competition law top-ics. Cadeler intends to continue these types of training on a recurring basis for the Senior Leadership Team and other relevant employees. Responsible Business Continued from previous page |
|
69 Cadeler’s policies outline its social, environmental and corporate responsibilities and es-tablish the key actions that the Company should take to uphold its values and reach its targets. The selection of Company policies highlighted in this section cover the core re-sponsibilities that must be upheld for the Company to operate sustainably. Unless otherwise noted, all Cadeler policies apply to all offshore and onshore employees and other individuals contracted to work for Cadeler. We also encourage all those we do business with to adhere to similar standards. Cadeler reviews company policies on an annual basis for their level of effectiveness, promoting continuous improvement. All policy texts are incorporated as part of the Company management manual. Employ-ees can freely access the documents on the Company intranet. Human Rights Policy Reference to the Human Rights Policy is made in the Responsible Business section above. Cadeler has a responsibility to respect human rights and contribute to positive impacts for the communities in which it operates. The approach is based on the UN Guiding Principles on Business and Human Rights. Cadeler prohibits all forms of modern slavery and the employment of children under the legal minimum age. Cadeler supports diversity, inclusion and fair compensation. Health, safety, environment and quality policy Health & Safety – Cadeler’s top priority is the safe execution of all activities. The ultimate goal is zero harm, and we believe that all incidents are preventable and that all people should return home from Cadeler worksites in the same or in a better condition. Environment – Cadeler strives to minimise its environmental impact, not only looking at the current operations but also at the full asset lifecycle and across its supply chain. Quality – Cadeler is strongly committed to quality and aims to deliver services that con-sistently meet or exceed our customers' expectations. Our approach: Develop, follow and continuously improve our HSEQ processes; use a risk-based approach when conducting our activities; nurture a culture of continuous improve-ment where we learn from activities, successes, failures, incidents and observations; em-power all people to challenge and stop unsafe acts, conditions, and behaviours; prioritise working with contractors and suppliers that have similar HSEQ ambitions and goals to Cadeler. Sustainable development policy Cadeler aims to work towards a sustainable future in everything it does and work towards alignment with the UN Sustainable Development Goals. Cadeler commits to reducing the carbon intensity of our operations, improving the energy efficiency of our assets, mini-mising the use of resources, and working towards a circular economy. Cadeler will pro-vide a working environment that prioritises workers’ rights and promotes an atmosphere of equality and respect. The Company will practise good business ethics, ensure safe-guards against corruption and other unethical behaviour, and protect internationally pro-claimed human rights in its operations and across its supply chains. Responsible Business – Relevant Policies and Procedures |
|
70 Cadeler Code of Conduct The Cadeler Code of Conduct outlines the principles and guidelines essential for main-taining ethical business practices and integrity within the organisation. With a commit-ment to compliance with all applicable laws and regulations, Cadeler emphasises the im-portance of conducting business with honesty, fairness, and professionalism. This ex-tends to interactions with employees, clients, suppliers, and the communities in which Cadeler operates. The Code establishes clear expectations for Cadeler’s employees, of-ficers, and directors to adhere to high standards of business ethics and corporate gov-ernance in their day-to-day operations. Key areas addressed in the Code include conflicts of interest, competition and antitrust laws, anti-bribery and corruption, insider trading, political contributions, and use of com-pany property and information. Cadeler prohibits the acceptance or offering of ad-vantages to influence business dealings, emphasises the importance of observing local laws in all jurisdictions of operation, and outlines procedures for engaging with agents, consultants, and suppliers. Additionally, the Code addresses issues related to procure-ment, record-keeping, confidentiality, social media usage, privacy, and compliance with trade sanctions and anti-money laundering regulations. Compliance with the Cadeler Code of Conduct is mandatory, and it is encouraged to raise concerns related to non-compliance through established reporting channels. The organisation underscores its commitment to addressing such concerns promptly and thoroughly, with potential disciplinary action for individuals found to be in breach of the Code. By upholding these standards, Cadeler aims to foster a culture of integrity, re-spect, and responsibility across its operations. Supply chain sustainability Code of Conduct Cadeler actively seeks to select and work with suppliers who not only comply with laws and regulations, but go beyond by setting standards that are expected of industry lead-ers. We also have a strong preference to work with suppliers who share our commitment to honesty and integrity and who seek to integrate principles of sustainable develop-ment into all areas of their business. The Cadeler supply chain sustainability code of con-duct sets out our expectations around protection of human rights (including labour rights of the workers in our supply value chain), management of environmental impacts, health and safety standards, and requirements for business ethics and community issues. More specifically, the document outlines Cadeler’s expectations on the following topics: Legal and regulatory compliance; not employing forced labour; not employing under-aged workers; compensation and working hours; non-discrimination and employment rights; requirements for a grievance mechanism that is available to employees, compli-ance with EU, US, UK, and Norwegian sanctions; requirements for environmental and safety management systems; and finally, agreement to upholding proper business eth-ics, especially around anti-corruption and anti-bribery practices. To further reduce any risk of poor practice within the supply chains, Cadeler is strength-ening its system for ensuring suppliers comply with its requirements. The Company im-plemented a process in 2022 that utilises a more structured approach for gathering sup-pliers’ agreements to uphold our policies. It also allows for Cadeler or a third party on its behalf to perform audits of key suppliers, ensuring standards are upheld. Additionally, Cadeler has started including adherence to its supply chain code of conduct as a con-tractual obligation for suppliers delivering some critical works. Responsible Business – Relevant Policies and Procedures Continued from previous page |
|
71 Governance Description of Board’s oversight of climate relate risks and opportunities. A review on climate related issues is scheduled at least annually in coordination with the publication of the Company sustainable development report. The Board uses this oppor-tunity to reassess how sustainability is built into the Company's strategy and govern-ance. Other important matters arising throughout the year would be handled on an as needed basis. Any items originating from Cadeler's employees would be introduced to the Board of Directors via the CEO. Management’s role in assessing and managing climate-related risks and opportunities. As with other organisational risks and opportunities, management is expected to review climate related risks and opportunities on an ongoing basis and push material risks and opportunities forward to the Board. Strategy Describe the climate-related risks and opportunities the organisation has identified over the short, medium, and long term. Emerging Regulations: The Company monitors emerging climate-related regulations, such as EU ETS and EU CSRD, and is preparing for potential impacts and educating rele-vant teams to manage and mitigate the forecasted impacts. Technology: Cadeler identifies a significant risk in failing to decarbonise its vessels, con-sidering both competitive and investment perspectives. The Company invests in techno-logical improvements, including shore power, hybrid battery systems, and improved en-gine efficiency, to meet decarbonisation goals. Legal: Cadeler complies with Danish, EU, and IMO regulations related to environmental aspects, recognising the risk of fines for non-compliance with environmental require-ments for its vessel operations. Market: Cadeler sees market-related opportunities with the drive towards renewable en-ergy grid at the core of our business strategy, but we are also pay attention to risks such as fluctuating prices, especially in fuel and energy, affecting overall operational costs and the ability to implement renewable or energy-saving technologies. Reputation: The Company is focused on aligning with its goal to support offshore wind energy development, aiming to avoid economic opportunities in the oil and gas sector for reputational reasons. Cadeler is working on improving sustainability performance and quantifying its impacts. Physical Risks: Cadeler has initiated its first formal climate risk assessment to identify potential risks to assets, operations, and supply chains. This assessment generally identi-fied low vulnerability to Cadeler’s own assets through 2035 and some vulnerabilities in our supply chain due to the risk of severe weather events Describe the impact of climate related risks and opportunities on the organisation’s businesses, strategy, and financial planning. Climate related opportunities, related to the expectation for increased climate change mitigation activities, have largely driven our development with further investments to support the offshore wind industry. Climate Change Risk Management – TCFD recommended disclosures |
|
72 Describe the resilience of the organisation’s strategy, taking into consideration different climate-related scenarios, including a 2°C or lower scenario. Cadeler’s risk assessment for its own operations and supply chains considers the RCP 8.5 pathway, considered the worst case scenario developed by IPCC. Our carbon reduc-tion targets aim to meet the requirements of the Paris Agreement, which calls for reduc-tion of 45% by 2030 and net-zero by 2050 in order to keep global warming under 1.5°C. Risk Management Describe the organisation’s processes for identifying, assessing and managing climate-related risks. Cadeler has designated resources focused on the issues of decarbonisation and sus-tainable development, including climate related risks. At the beginning of 2023, the Com-pany had one sustainability manager, but has established a department focused on this type of issue in the course of 2023. The decarbonisation and sustainability team reports into the Senior Leadership Team via the Chief Technical Officer. In 2023, Cadeler initi-ated a process for identifying climate related physical risks faced by the Company and within its supply chain. Describe how processes for identifying, assessing, and managing climate-related risks are integrated into the organisation’s overall risk management. These processes are currently handled by the decarbonisation and sustainability depart-ment with identified risks being escalated to management and board level on an as-nec-essary basis. In the future, the organisation will benefit from formally integrating manage-ment of climate related risks into the Company annual risk management processes. Metrics and Targets Disclose the metrics used by the organisation to assess climate related risks and oppor-tunities in line with its strategy and risk management process. Scope 1 and 2 greenhouse gas emissions are measured and reported in terms of carbon dioxide equivalence. The Company currently reports scope 3 emissions on a limited ba-sis and is working to present a fuller picture by publication of the 2024 annual report. Disclose Scope 1, Scope 2, and, if appropriate, Scope 3 greenhouse gas (GHG) emis-sions, and the related risks. Please see page 52 Describe the targets used by the organisation to manage climate-related risks and op-portunities and performance against targets. Please see pages 45-55 Climate Change Risk Management – TCFD recommended disclosures Continued from previous page |
|
73 Reporting framework – inspired by GRI standards. The SASB Sustainability Disclosure Topics and Accounting Metrics for Engineering and Construction Services and Marine Transport are covered in Appendices ESG.1 and ESG.2. A GRI Content index is available in Appendix ESG.3. See pages 212-221. The report covers Cadeler’s performance from 1 Jan 2023 until 31 Dec 2023 Boundaries for the scope of this report Not all indirect impacts of our operations are covered in this report. For safety statistics, the data covers Cadeler employees while at work sites for which Cadeler has responsibil-ity. Safety management and improvement processes are focused on keeping all persons safe while present on a Cadeler-controlled work site. The boundaries placed on environ-mental impact are as follows: Cadeler considers direct impact from the operation of its vessels and offices, and the use of company cars. The Company considers indirect im-pact from flights taken by office employees and offshore crew for business purposes, helicopter crew changes, etc. All categories include Eneti data for the few days in 2023 post-merger, but not the period prior to the business combination. Cadeler has not yet accounted for all indirect impact of operations - for example, the environmental impact from our supply chain (i.e. production and transportation of goods and equipment from production sites to our vessels), or the downstream emissions from treatment of waste produced by our operations. The Company intends to begin fuller accounting for indirect scope 3 emissions in by publication of the 2024 report. Emission conversions and calculations Scope 1 CO2e Direct GHG (Kyoto Protocol gases) based on emissions of CO2, CH4, and N2O from com-bustion of marine gas oil (MGO) in our vessel engines and emissions from company cars. All emissions from and consumption of lube oils and SF6, NF3, HFC and HCFC emissions reported as resulting from scope 1 emissions. Carbon intensity factors extracted from UK Government GHG Conversion Factors for Company Reporting. Cadeler fuel records are verified annually by DNV-GL for IMO DCS reporting. Scope 2 CO2e Indirect GHG based on consumed electricity/heat in our offices and electricity consump-tion for company electric cars. CO2e is considered to be the summation of the CO2 equiv-alent emissions for CO2, CH4, and N2O. Carbon intensity (per kWh) is calculated using the emissions data for the Danish electrical grid as published in the annual Environmental Report released by Energinet.dk: https://energinet.dk/om-publikationer/publika-tioner/miljoredegorelse-2021/. Global warming potential for each gas extracted from the US Environmental Protection Agency Website: https://www.epa.gov/ghgemissions/un-derstanding-global-warming-potentials. Scope 3 CO2e Flight GHG data provided by our travel agency, Marine Travel, based on all flights booked for Cadeler seafarers and office personnel in 2023. Marine Travel uses a conversion fac-tor of 0.00018 tonne CO2e/km for flights < 1,000 km and 0.00011 tonne CO2e/km for flights > 1,000 km. Helicopter crew transfer: fuel consumption per flight (stated by flight provider) x percentage of passengers who are Cadeler crew x CO2e emission factor. Addi-tional, fuller reporting of other Scope 3 emissions to be in place by the publication of our 2024 annual report. Sustainability Accounting Principles |
|
74 SOx We only track SOx due to marine gas oil combustion. Cadeler uses MGO with a sulphur content of maximum 0.1% of the fuel weight. Conversion figure, from Lloyd’s Register Engineering Services (1995), given as 20 x fuel sulphur content (kg/tonne) NOx NOx is also only tracked due to marine gas oil combustion. Cadeler has updated its method in 2023. We now refer to the EMEP/EEA air pollutant emission inventory guide-book (2019 database) as the updated source of conversion factors for estimating our NOx emissions. Based on our vessels’ Tier II, medium speed engines, we estimate NOx emissions of 57.9 kg per tonne of MGO combusted. Particulates Also updated to use conversion factors from the EMEP/EEA air pollutant emissions in-ventory guidebook (2019 database). The PM10 emission factor is considered to be 1.07kg/tonne marine gas oil and the PM2.5 emissions factor is considered to be 0.91 kg/tonne marine gas oil. NMVOCs Updated to also refer to refer to the EMEP/EEA air pollutant emission inventory guide-book (2019 database). Emission factor considered to be 1.86 kg/tonne MGO. Sustainability Accounting Principles Continued from previous page |
|
75 EU Taxonomy |
|
76 “The EU Taxonomy is a classification system, establishing a list of environmentally sus-tainable economic activities. It could play an important role helping the EU scale up sus-tainable investment and implement the European green deal. The EU taxonomy would provide companies, investors and policymakers with appropriate definitions for which economic activities can be considered environmentally sustainable. In this way, it should create security for investors, protect private investors from greenwashing, help compa-nies to become more climate-friendly, mitigate market fragmentation and help shift in-vestments where they are most needed.” – from the European Commission Cadeler expects that reporting alignment of economic activities with EU Taxonomy will become a requirement for the Company, based on its profile, from 2024. In late 2022, the Company initiated the process of categorizing its economic activities and ensuring that eligible activities are aligned with EU Taxonomy requirements. Cadeler expects to be able to report on Taxonomy-alignment of its activities in its next annual report. This year, Cadeler still finds value in sharing the Taxonomy-eligibility of its economic activities to give an indication of which proportion of the Company’s activities have potential to be aligned. Cadeler’s core purpose of operation is to support installation of offshore renewable en-ergy sources. This activity supports climate change mitigation and can be aligned with the EU Taxonomy when performed in a way that does no significant harm to the other 5 environmental objectives of the Taxonomy and preserves the social minimum safe-guards. The majority of the Company’s eligible economic activities, relating to installation of offshore wind energy, can be categorised as activity 4.3 – electricity generation from wind power. This activity supports the Taxonomy objective of climate change mitigation. Do no significant harm (DNSH) Cadeler is in the process of assessing compliance with the DNSH requirements for cli-mate change mitigation activity 4.3. Climate Change Adaptation During 2023, Cadeler performed a risk assessment for the impact of climate change on its assets and key parts of its supply chain, including ports and suppliers of key equip-ment for our operations. The assessment considered the representative concentration pathway scenario 8.5 (RCP 8.5), considered the worst case scenario as identified by IPCC, but only considered impacts through 2035, with the timespan based on Cadeler’s visibility on its scope of operations. The Company identified risks related to changing wind patterns, precipitation patterns, and flooding that may impact operations and its supply chain. Vulnerability in our own operations was generally judged to be low as our assets are not in fixed locations, but some vulnerability was identified in our supply chains when it comes to delivery of key equipment and services. Sustainable use and protection of water and marine resources In the case of construction of offshore wind, the activity cannot hamper the achievement of good environmental status as set out in Directive 2008/56/EC of the European Parlia-ment and of the Council, requiring that appropriate measures are taken to prevent or mitigate impacts in relation to the Directive’s Descriptor 11 (Noise/Energy). Cadeler is as-sessing its construction activities and has already highlighted a few measures that miti-gate potential impacts. For example, on foundation installation projects, noise mitigation techniques are used to reduce noise pollution escaping into the surrounding marine en-vironment where environmental impact assessments pre-project have identified ele-vated risk of exposure to marine mammals in the area. EU Taxonomy |
|
77 Transition to a Circular Economy The activity assesses availability of and, where feasible, uses equipment and compo-nents of high durability and recyclability and that are easy to dismantle and refurbish. Cadeler has a garbage management plan for its vessels and has added a focus on circu-larity and the reduced use of resources to its sustainability strategy. The Company will assess whether additional initiatives should be established to ensure it does its part in transitioning to a circular economy. Pollution prevention and control This category is not applicable for alignment with Taxonomy activity 4.3, but Cadeler op-erates its vessels in accordance with MARPOL. Protection and restoration of biodiversity and ecosystems It is legally required that all offshore windfarms in the EU and UK have an environmental impact assessment performed before the approval for construction is granted. Cadeler doesn’t guide the process at the windfarm level, but it does collaborate with its clients concerning operational measures which may address, reduce or mitigate any potentially negative impacts upon biodiversity and the ecosystem. Minimum Safeguards Cadeler has a set of policies in place that outline its commitment to protect human rights, prevent corruption, and promote fair competition and taxation. The Company also has a set of processes and procedures that are intended to engrain its policies into the Company’s systems and working culture. Over the next year, the Company will continue to evaluate and strengthen its processes and procedures to ensure they are robust enough to guarantee that social minimum safeguards are in place. Human rights Cadeler’s safeguards include a Human rights policy, a code of conduct, and supply chain code of conduct, and the policy document which outlines the Company’s due diligence process and documentation of risk assessments performed. Additionally, the Company has designated responsibility in the area of Human Rights and has a policy for remedia-tion and mitigation of any potential human rights impacts. Finally, Cadeler reports annu-ally on its human rights impacts. Grievance Mechanisms Cadeler has a Speak Up hotline in place which is available to our employees and the gen-eral public and allows for anonymous contact. The Company also has an operations manual in place for this grievance mechanism. Consumer Interests Cadeler operates in accordance with EU requirements. Anti-Corruption Cadeler has a code of conduct and relevant policies that informs employees of ex-pected behaviour. The Company also maintains documentation of incidents, conducts internal training, documents risk monitoring processes, has procedures for internal or-ganisational control, and shares necessary information publicly. Competition The Company covers this topic in its code of conduct and offers internal training on competition issues. EU Taxonomy Continued from previous page |
|
78 Taxation Cadeler has a public tax policy which outlines practices and commitment to compliance with tax regulations in all jurisdictions in which it operates. Taxonomy KPIs Taxonomy eligibility and alignment is expressed with three KPIs. These are calculated as the portion of turnover, CapEx and OpEx that is Taxonomy-eligible and Taxonomy-aligned. KPI for Taxonomy-aligned turnover The proportion of Taxonomy-eligible activities has been calculated as net turnover from products and services associated with Taxonomy-aligned activities divided by total net turnover. KPI for Taxonomy-aligned CapEx CapEx is defined as Taxonomy-aligned CapEx divided by total CapEx. The total CapEx consists of additions to tangible and intangible fixed assets before depreciation, amorti-sation, and any re-measurements. It includes acquisitions of property plant and equip-ment, intangible assets, leases with usage rights, and investment properties. KPI for Taxonomy-aligned OpEx OpEx is defined as Taxonomy-aligned OpEx divided by the total OpEx. However, the EU Taxonomy defines OpEx differently than IFRS as it only considers direct costs for: ▶ Research and development, excluding overhead ▶ Building renovation ▶ Short-term lease agreements ▶ Maintenance, upkeep and repairs ▶ Any other direct expenditure related to the routine maintenance of tangible assets by the Company or by any third-party to which activities, that are necessary to ensure the continued and effective functioning of such assets, are outsourced. EU Taxonomy Continued from previous page |
|
79 Substantial contribution criteria DNSH criteria ('Do Not Significant Harm') Economic activities Code(s) Absolute Turnover 2023 (mEUR) Propor-tion of Turnover Climate change mitiga-tion Climate change adap-tation Climate change mitiga-tion Climate change adap-tation Water and ma-rine re-sources Circular economy Pollution Biodi-versity and eco-systems Minimum safe-guards Taxonomy-aligned proportion of Turno-ver 2023 Category (enabling activity) Category (transitional activity) A. TAXONOMY-ELIGIBLE ACTIVITIES A.1. Environmentally sustainable activities (Taxonomy-aligned) 4.3 - Electricity gener-ation from wind power F42.22 0 0% 0% 0% N N N N n/a N N 0% Turnover of environ-mentally sustainable activities (Taxonomy-aligned) (A.1) 0 0% 0% 0% 0% A.2 Taxonomy-Eligible but not environmen-tally sustainable activi-ties (Not Taxonomy-aligned activities) 4.3 - Electricity gener-ation from wind power 108.6 100% 100% 0% Turnover of Taxon-omy-eligible but not environmentally sus-tainable (Not taxon-omy-aligned) (A.2) F42.22 108.6 100% 100% 0% Total (A.1 + A.2) 108.6 100% 100% 0% 0% B. TAXONOMY-NON-ELIGIBLE ACTIVITIES Turnover of Taxon-omy-non-eligible ac-tivities 0 0% Total (A + B) 108.6 100% EU Taxonomy - Turnover |
|
80 EU Taxonomy – CapEx Substantial contribution criteria DNSH criteria ('Do Not Significant Harm') Economic activities Code(s) Absolute CapEx 2023 (mEUR) Propor-tion of Turnover Climate change mitiga-tion Climate change adapta-tion Climate change mitiga-tion Climate change adapta-tion Water and ma-rine re-sources Circular economy Pollution Biodi-versity and eco-systems Minimum safe-guards Taxonomy-aligned proportion of CapEx 2023 Category (enabling activity) Category (transitional activity) A. TAXONOMY-ELIGIBLE ACTIVITIES A.1. Environmentally sustainable activities (Taxonomy-aligned) 4.3 - Electricity gener-ation from wind power F42.2 2 0 0% 0% 0% N N N N n/a N N 0% CapEx of environ-mentally sustainable activities (Taxonomy-aligned) (A.1) 0 0% 0% 0% 0% A.2 Taxonomy-Eligible but not environmen-tally sustainable activi-ties (Not Taxonomy-aligned activities) 4.3 - Electricity gener-ation from wind power 514.9 100% 100% 0% CapEx of Taxonomy-eligible but not envi-ronmentally sustaina-ble (Not taxonomy-aligned) (A.2) F42.2 2 514.9 100% 100% 0% Total (A.1 + A.2) 514.9 100% 100% 0% 0% B. TAXONOMY-NON-ELIGIBLE ACTIVITIES CapEx of Taxonomy-non-eligible activities 0 0% Total (A + B) 514.9 100% |
|
81 Substantial contribution criteria DNSH criteria ('Do Not Significant Harm') Economic activities Code(s) Absolute OpEx 2023 (mEUR) Propor-tion of Turnover Climate change mitiga-tion Climate change adap-tation Climate change mitiga-tion Climate change adapta-tion Water and ma-rine re-sources Circular economy Pollution Biodi-versity and eco-systems Minimum safe-guards Taxonomy-aligned proportion of OpEx 2023 Category (enabling activity) Category (transitional activity) A. TAXONOMY-ELIGIBLE ACTIVITIES A.1. Environmentally sustainable activities (Taxonomy-aligned) 4.3 - Electricity gener-ation from wind power F42.22 0 0% 0% 0% N N N N n/a N N 0% OpEx of environmen-tally sustainable ac-tivities (Taxonomy-aligned) (A.1) 0 0% 0% 0% 0% A.2 Taxonomy-Eligible but not environmen-tally sustainable activi-ties (Not Taxonomy-aligned activities) 4.3 - Electricity gener-ation from wind power 6.6 10% 100% 0% OpEx of Taxonomy-eligible but not envi-ronmentally sustaina-ble (Not taxonomy-aligned) (A.2) F42.22 6.6 10% 100% 0% Total (A.1 + A.2) 6.6 10% 100% 0% 0% B. TAXONOMY-NON-ELIGIBLE ACTIVITIES OpEx of Taxonomy-non-eligible activities 59.7 90% Total (A + B) 66.3 100% EU Taxonomy - OpEx |
|
82 Green Finance Report |
|
83 Green Loan Facilities Green finance instruments are issued to finance or re-finance eligible green projects, in whole or in part, that promote the transition towards a low-carbon and climate-resilient society. The green financing is supported by the previously announced updated Green Finance Framework and a Second Party Opinion issued by S&P Global re-confirming a Medium Green Rating. Annual Green Financing Reporting To keep investors, lenders and other stakeholders informed about the progress of the Green Projects funded by Green Finance Instruments, Cadeler has agreed to publish a Green Finance Report on the Company website, either as a separate document or as in-formation integrated in the Company’s annual sustainability reporting. The Green Fi-nance Report includes an Allocation Report and an Impact Report and will be published annually as long as there are Green Finance Instruments outstanding. At this stage, Cadeler will publish the Green Finance Report as part of the Annual Report. If any change is made to the location of reporting in future years, a statement will be in-cluded in the Annual Report. Impact Reporting Impact reporting aims to disclose the environmental impact of the Green Projects fi-nanced under this Framework, and will, where possible, be measured, otherwise esti-mated. Impact reporting will, to some extent, be aggregated and depending on data availability, calculations will be made on a best intention basis. Allocation Reporting Cadeler will continue to publish an annual allocation report as long as there are green fi-nance instruments outstanding. Cadeler intends to produce an annual statement includ-ing the following information: the amounts allocated to each of the Green Project cate-gories and the share of new financing versus refinancing, examples of Green Projects that have been funded by Green Finance Instruments, the nominal amount of Green Fi-nance Instruments outstanding and the split between Green Bonds and Green Loans, and the amount of net proceeds awaiting allocation to Green Projects (if any). Cadeler and Green Finance |
|
84 In December 2023, Cadeler announced the signing of a EUR 550 million Senior Secured Green Facilities, The “New Debt Facility”, with a group of banks led by DNB and sup-ported by Rabobank, Credit Agricole, Danske Bank, Oversea-Chinese Banking Corpora-tion (“OCBC”), Standard Chartered Bank and Société Générale. The purpose of the New Debt Facility is to refinance existing vessels in Cadeler and Eneti following the business combination between the two companies, as previously announced, to finance crane up-grades of Cadeler’s two existing O-Class vessels and to fund general corporate and working capital purposes. The New Debt Facility is made up of two RCFs amounting to EUR 350 million, a EUR 100 million term loan guaranteed by The Danish Export and Investment Fund of Denmark (EIFO) and a EUR 100 million uncommitted Guarantee facility. In November 2023, Cadeler also entered into an unsecured green loan facility with HSBC, the Holdco Facility. A main purpose of the facility is to fund Cadeler’s construction of the P-Class and A-Class newbuild vessels and upgrade of the existing O-Class vessels with new cranes. The financing includes a non-committed accordion option of up to EUR 50 million. This underlines Cadeler’s strategic market position. Company Impact Report – Key Performance Indicators Green Loan Criteria/Company Eligibility Criteria For Green Company Financings qualifying as Green Finance Instruments, an externally verified Compliance Certificate, outlining alignment with the Green Company Eligibility Criteria will be shared with the relevant lenders. Green Company Financing 2023 Share of annual revenue from renewable energy projects 100% Share of annual revenue from new/existing oil and gas installations 0% Share of CapEx and OpEx aligned with the green project categories of the Green Finance Framework 100% Unit 2023 Number of installed offshore wind turbine foundations number 0 Number of installed offshore wind turbines number 136 Number of serviced offshore wind turbines number 20 Installed power generation capacity MW 1412 Serviced power generation capacity MW 196.2 GHG emissions and/or fuel consumption from offshore wind installation activities - Scope 1 t CO2e 25479 Scope 1 emissions (tCO2e) per MW installed or serviced t CO2e/MW 16.1 |
|
85 In December 2023, Cadeler announced the signing of a Sinosure-backed Senior Secured Green Term Loan Facility of up to EUR 425 million P-Class Facility, with a group of banks led by DNB and supported by Rabobank, Santander, Credit Agricole, CIC, HSBC, KfW-IPEX, OCBC, Sparebank 1 SR-Bank, Standard Chartered Bank and Société Générale. The purpose of the P-Class Facility is to part finance Cadeler’s two newbuilds, Wind Peak and Wind Pace, to be delivered in Q3 2024 and Q2 2025. The P-Class Facility is 90% insured by China Export & Credit Insurance Corporation (“Si-nosure”) and will be made available in two loans when the newbuilds are delivered from COSCO Shipping (Qidong) Offshore Co. Ltd. For Green Project Financing, an independent auditor appointed by Cadeler will on an an-nual basis provide a limited assurance report confirming that an amount equal to the net proceeds from such Green Finance Instruments have been allocated to Green Projects. Allocation Report Impact Report The 425 million facility is financing for vessels that are not yet in operation. Once Wind Peak and Wind Pace are in operation, Cadeler will provide a report on the impacts of these specific vessels. Until then, please refer to our impact metrics reported on Com-pany-wide basis on page 84. Green Company Financing Continued from previous page Allocation Project Category Debt Issue Issued Maturity Proceeds Proceeds allocated To be allocated Installation and maintenance vessels Key enabling equipment Weather stations Waste and wastewater management Project funded Senior Secured Green Term Loan Facility 22/12/2023 12 yrs EUR 425m EUR 425m EUR 0m 100% Wind Peak and Wind Pace Newbuilds |
|
86 Consolidated Financial Statements |
|
87 Consolidated Statement of Profit and Loss and Other Comprehensive Income EUR’000 Note 2023 2022 2021 Revenue 3 108,622 106,424 60,938 Cost of sales 4 (59,858) (49,537) (38,879) Gross profit 48,764 56,887 22,059 Other operating income and expenses 5 137 - - Administrative expenses 4 (34,458) (15,696) (10,925) Operating profit 14,443 41,191 11,134 Finance income 10 1,541 4,031 1,795 Finance costs 10 (4,486) (9,681) (5,491) Profit before income tax 11,498 35,541 7,438 Income tax credit/expense 11 - - 13 Profit for the period 11,498 35,541 7,451 Profit for the period attributable to: Equity holders of the parent 12 11,498 35,541 7,451 11,498 35,541 7,451 Earnings per share Basic, profit/loss for the period attributable to ordinary equity holders of the parent (EUR per share) 12 0.06 0.22 0.06 Diluted, profit/loss for the period attributable to ordinary equity holders of the parent (EUR per share) 12 0.06 0.22 0.06 EUR’000 Note 2023 2022 2021 Other comprehensive income Items that may be reclassified to profit or loss Exchange differences on translation of for-eign operations (6,724) - - Cash flow hedges - changes in fair value 25 (18,505) 905 - Cash flow hedges - interest recycled 25 (776) 438 - Cash flow hedges - cost of hedging 25 (3,621) - - Other comprehensive income after tax (29,626) 1,343 - Total comprehensive income for the period, net of tax (18,128) 36,884 7,451 Total comprehensive income attributable to: Equity holders of the parent 12 (18,128) 36,884 7,451 (18,128) 36,884 7,451 |
|
88 Consolidated Balance Sheet EUR'000 Note 2023 2022 2021 Intangible Assets 17 16,947 419 402 Property, plant and equipment 18 1,085,632 606,204 399,087 Rights-of-use assets 19 973 287 464 Leasehold deposits 19 1,220 238 195 Derivative assets 24, 25 338 3,376 - Total non-current assets 1,105,110 610,524 400,148 Inventories 15 1,836 549 440 Trade receivables 14 30,552 18,235 19,530 Contract assets 14 8,880 19,999 843 Prepayments 16 9,562 1,699 1,497 Current Income tax receivable 12 12 - Cash and cash equivalents 13 96,608 19,012 2,308 Total current assets 147,450 59,506 24,618 Total assets 1,252,560 670,030 424,766 EUR'000 Note 2023 2022 2021 Share capital 22 41,839 26,575 18,641 Share premium 952,858 509,542 339,400 Reserves (28,283) 1,343 - Retained earnings / (Accumulated losses) (7,373) 3,108 (32,785) Total equity 959,041 540,568 325,256 Provisions 20 4,813 - - Lease liabilities 24 392 - 209 Deferred tax liabilities 11 10,191 - - Deferred charter hire income 3 1,778 1,326 969 Debt to credit institutions 26 204,773 114,230 44,476 Derivative liabilities 24, 25 17,957 2,108 - Total non-current liabilities 239,904 117,664 45,654 Trade and other payables 20 32,636 8,822 9,703 Current provisions 20 2,086 - - Payables to related parties 27 162 89 63 Current deferred charter hire income 3 12,103 1,831 15,187 Current lease liabilities 24 601 279 298 Current income tax liabilities 1,224 5 6 Current debt to credit institutions 26 799 772 28,599 Current derivative liabilities 24, 25 4,004 - - Total current liabilities 53,615 11,798 53,856 Total liabilities 293,519 129,462 99,510 Total equity and liabilities 1,252,560 670,030 424,766 |
|
89 Reserves EUR’000 Share capital Share premium Hedging reserves Cost of hedging reserves Foreign cur-rency transla-tion reserve (Accumulated losses)/ retained earnings Total 2023 Beginning of financial year 26,575 509,542 1,343 - - 3,108 540,568 Profit for the year - - - - - 11,498 11,498 Other comprehensive income for the year - - (19,281) (3,621) (6,724) - (29,626) Total comprehensive profit for the year - - (19,281) (3,621) (6,724) 11,498 (18,128) Registration of new shares in relation to business combination 15,264 450,271 465,535 Costs incurred in connection with listing - (6,955) (6,955) Changes from business combination - (23,113) (23,113) Share-based payments - - - - 1,134 1,134 End of financial year 41,839 952,858 (17,938) (3,621) (6,724) (7,373) 959,041 2022 Beginning of financial year 18,641 339,400 - - - (32,785) 325,256 Profit for the year - - - - - 35,541 35,541 Other comprehensive income for the year - - 1,343 - - - 1,343 Total comprehensive profit for the year - - 1,343 - - 35,541 36,884 Capital increase May 2022 3,518 81,234 - - - - 84,752 Costs incurred in connection with May 2022 capital increase - (2,305) - - - - (2,305) Capital increase October 2022 4,416 94,082 - - - - 98,498 Costs incurred in connection with October 2022 capital increase - (2,869) - - - - (2,869) Share-based payments - - - - - 352 352 End of financial year 26,575 509,542 1,343 - - 3,108 540,568 Consolidated Statement of Changes in Equity |
|
90 Reserves EUR’000 Share capital Share premium Hedging reserves Cost of hedging reserves Foreign cur-rency transla-tion reserve (Accumulated losses)/ retained earnings Total 2021 Beginning of financial year 15,557 265,742 - - - (40,236) 241,063 Profit for the year - - - - - 7,451 7,451 Other comprehensive income for the year, net of tax - - - - - - - Total comprehensive profit for the year - - - - - 7,451 7,451 Capital increase April 2021 3,084 76,134 - - - - 79,218 Costs incurred in connection with April 2021 capital increase - (2,155) - - - - (2,155) Share-based payments - (321) - - - - (321) End of financial year 18,641 339,400 - - - (32,785) 325,256 Consolidated Statement of Changes in Equity Continued from previous page |
|
91 EUR’000 Note 2023 2022 2021 Cash flow from operating activities Profit for the period 11,498 35,541 7,451 Adjustments for: Depreciation and amortisation 4 23,048 22,684 16,479 Impairment of fixed assets 18 5,000 - - Interest expenses 10 1,898 923 4,506 Other operating income and expenses, net 5 (137) - - Fair value change of derivatives instruments through profit or loss 10 766 - - Share-based payment expenses 1,134 352 (321) 43,207 59,500 28,115 Changes in working capital: Inventories (1,140) (109) (128) Trade receivables and contract assets 28,541 (18,029) (9,883) Trade and other payables (16,087) 660 2,448 Receivables from related parties - - 7,463 Payables to related parties 73 26 (5,319) Deferred charter hire income 8,787 (12,999) 7,346 Net change in working capital 20,174 (30,451) 1,927 Income tax paid 2 (13) 158 Net cash provided by operating activities 63,383 29,036 30,200 Consolidated Statement of Cash Flows |
|
92 EUR’000 Note 2023 2022 2021 Cash flow from investing activities Cash acquired in a business combination, net 6 10,403 - - Additions to property, plant and equipment 18 (66,899) (224,606) (162,941) Disposal of property, plant and equipment 18 1,800 - - Additions to intangibles 17 (31) (228) (434) Movement to right of use assets - (574) - Net cash (used in) investing activities (54,727) (225,408) (163,375) Cash flow from financing activities Principal repayment of lease liabilities 24 (569) (228) (285) Interest paid 18 (7,143) (4,234) (3,930) Proceeds from issue of share capital - 183,250 79,218 Transaction costs on issues of shares (6,955) (5,174) (2,154) Proceeds from borrowing net of bank fees (of EUR 12 million in 2023 and EUR 2 million in 2022) 24 199,935 113,459 - Proceeds from overdraft 24 - 16,067 8,998 Repayment of loan 24 (115,000) (65,000) (10,000) Repayment of overdraft 24 - (25,065) - Net cash provided by financing activities 70,268 213,075 71,847 Net increase/(decrease) in cash and cash equivalents 78,924 16,704 (61,328) Cash and cash equivalents at beginning of the period 13 19,012 2,308 63,636 Net foreign exchange difference (1,328) - - Cash and cash equivalents at end of the period 96,608 19,012 2,308 Consolidated Statement of Cash Flows Continued from previous page Continued from previous page |
|
93 Notes to the Consolidated Financial Statements |
|
94 Note 1 General Information .................................................................................................................. 96 Note 2 Material Accounting Policies Information..........................................................................97 Note 3 Revenue.........................................................................................................................................114 Note 4 Expenses by Nature.................................................................................................................. 117 Note 5 Other Operating Income and Expenses ............................................................................119 Note 6 Business combination.............................................................................................................120 Note 7 Employee Compensation.......................................................................................................123 Note 8 Long Term Incentive Programs............................................................................................124 Note 9 Board of Directors and Management Compensation................................................. 127 Note 10 Finance Income and Expenses............................................................................................128 Note 11 Income Taxes .............................................................................................................................129 Note 12 Earnings Per Share (EPS).........................................................................................................131 Note 13 Cash and Bank Balances........................................................................................................132 Note 14 Trade and Other Receivables...............................................................................................133 Note 15 Inventories ...................................................................................................................................134 Note 16 Prepayments...............................................................................................................................134 Notes to the Consolidated Financial Statements |
|
95 Note 17 Intangible Assets.......................................................................................................................135 Note 18 Property Plant and Equipment.............................................................................................136 Note 19 Right of Use Assets..................................................................................................................143 Note 20 Provisions, Trade and Other Payables ..............................................................................145 Note 21 Deferred Income Taxes ..........................................................................................................146 Note 22 Issued Share Capital ................................................................................................................ 147 Note 23 Commitments and Pledges ..................................................................................................148 Note 24 Financial Risk Management..................................................................................................150 Note 25 Derivative Financial Instruments .........................................................................................156 Note 26 Financial Liabilities: Interest-bearing Loans and Borrowings ...................................160 Note 27 Related Party Transactions ...................................................................................................162 Note 28 Group Information..................................................................................................................... 167 Note 29 Events After Reporting Period .............................................................................................170 Note 30 Authorisation of Financial Statements..............................................................................170 |
|
96 Corporate information Cadeler A/S (the “Company” or the “Group”) is incorporated and domiciled in Denmark. The address of its registered office is Kalvebod Brygge 43, DK-1560 Copenhagen, Den-mark. The Company is listed on the Oslo Stock Exchange (ticker code: CADLR) and on the New York Stock Exchange (ticker code: CDLR). The Group is a leading offshore wind farm transportation and installation (T&I) contrac-tor headquartered in Copenhagen, Denmark. The Group owns and operates four offshore jack-up windfarm installation vessels, Wind Orca, Wind Osprey, Wind Scylla and Wind Zaratan. In addition to wind farm installation, these vessels can perform maintenance, construction, decommissioning, and other tasks within the offshore industry. The consolidated financial statements of the Group is composed of the Financial State-ments of Cadeler A/S and its subsidiaries (which are fully owned by the Parent Company Cadeler A/S). For more information on the subsidiaries of Cadeler A/S please refer to Note 28. Note 1 General Information 96 |
|
97 2.1. Basis for preparation The consolidated financial statements included in this Annual Report have been pre-pared in accordance with IFRS Accounting Standards (IFRS) as issued by the Interna-tional Accounting Standards Board (IASB) and as endorsed by the EU and further re-quirements in the Danish Financial Statements Act. The preparation of these consolidated financial statements in conformity with IFRS re-quires management to exercise its judgement in the process of applying the Company’s accounting policies. It also requires the use of certain critical accounting estimates and assumptions. Areas involving a higher degree of judgement or complexity, or areas where estimates and assumptions are significant to the consolidated financial state-ments are further described in note 2.26. The consolidated financial statements are presented in euros and all values are rounded to the nearest thousands, except when otherwise indicated. The accounting policies set out in the notes have been applied consistently in the prepa-ration of the consolidated financial statement for all the years presented unless stated otherwise below. Going concern assessment The Company’s Board of Directors and Executive Directors have at the time of ap-proving the consolidated financial statements, a reasonable expectation that the Group has adequate resources to continue in operational existence for the foreseea-ble future. Thus, the Group continues to adopt the going concern basis of accounting in prepar-ing the consolidated financial statements. Principles of consolidation The consolidated financial statements include the parent company, Cadeler A/S, and all enterprises over which the parent company has control. Control of an enterprise exists when the Company has exposure, or rights to, variable returns from its involvement with the enterprise and has the ability to control those returns through its power over the en-terprise. Accordingly, the consolidated financial statements of the Group are composed of the Financial Statements of the Company Cadeler A/S and its subsidiaries (which are fully owned by the Parent Company, Cadeler A/S). All intra-group assets and liabilities, equity, income, expenses and cash flows relating to transactions between group enterprises are eliminated in full on consolidation. Subsidiaries apply accounting policies in line with the Company’s accounting policies. When necessary, adjustments are made to bring the entities’ accounting policies in line with those of the Company. Note 2 Material Accounting Policies Information |
|
98 European Single Electronic Format (ESEF) As a group with securities listed on a regulated market within the EEA, Cadeler A/S is re-quired to prepare its official Annual Report in the XHTML format and to tag the main con-solidated financial statements using inline eXtensible Business Reporting Language (iXBRL) applying a specific ESEF taxonomy. The annual report submitted to the Danish Financial Supervisory Authority consists of the XHTML document together with required technical files, all included in a ZIP file named cadeler-2023-12-31-en.zip. As such, the Annual Report is therefore both human- and machine-readable. A separate assurance report on the iXBRL tagging of the consolidated financial state-ments is issued by Cadeler's independent auditors and included on page 201. For gen-eral use, a PDF version of the Annual Report is published in line with previous years. 2.2. Changes in accounting policies and disclosures The Group has adopted standards and interpretations effective as of 1 January 2023. Adoption of new and amended standards and interpretations had no impact on the con-solidated financial statements. IASB has issued a number of new or amended accounting standards (IFRS) and interpre-tations (IFRIC), such as IAS 12 amendments International Tax Reform, Pillar Two Models Rules. The Group has assessed these accounting standards and interpretations, and does not anticipate the new standards to have any material impact on either the group’s figures or disclosures in 2024. The Group has not early adopted any other standard, interpretation or amendments that have been issued but are not yet effective. The new and amended standards and interpretations that are issued, but not yet effec-tive, up to the date of issuance of the Group’s financial statements are not expected to have a material impact on the Group. 2.3. Revenue recognition When accounting for revenue recognition, an assessment is performed on a con-tract-by-contract basis at contract inception. Overall, the Group’s contracts with customers comprise: • Revenue from time charter contracts and time charter related activities (re-ferred to as time charter revenue) and • Revenue from transportation and installation (referred to as transportation and installation revenue stream). The Group’s accounting policies for each revenue stream are disclosed below. 2.3.1. Time charter revenue The Group recognises time charter revenue when its customer obtains control of prom-ised goods or services, in an amount that reflects the consideration that the Group ex-pects to receive in exchange for those goods or services. Revenue from time charter contracts is generated from two distinct activities: 1) leasing of vessels and 2) provision of services within wind farming projects, e.g. catering and ac-commodation, mobilisation and demobilisation. As such, a time charter contract consists of a leasing component (the element relating to hire of the vessel) and a service compo-nent. The service component is within the scope of IFRS 15, while the leasing component is within the scope of IFRS 16. Refer to Note 2.13 on accounting policy for leases. Note 2 Material Accounting Policies Information Continued from previous page |
|
99 2.3.1.1 Leasing of vessels The leasing component is recognised as revenue over time over the charter period. Pay-ments from customers for the bareboat hire element are recognised over time in accord-ance with the length of the customer contract. Prepayments from customers for the leasing component are recognised as deferred charter hire income. Refer to Note 2 2.18 for accounting policy on deferred charter hire income. 2.3.1.2 Provision of services within wind farming projects, e.g. catering and accommoda-tion, mobilisation and demobilisation To determine revenue recognition for the service component of the time charter ar-rangements, the Group performs, in line with the requirements of IFRS 15, the following five steps: (i) identify the contract(s) with a customer; (ii) identify the performance obliga-tions in the contract; (iii) determine the transaction price; (iv) allocate the transaction price to the performance obligations in the contract; and (v) recognise revenue when (or as) the entity satisfies a performance obligation. Revenue from contracts with customers is recognised when control of the goods or ser-vices are transferred to the customer at an amount that reflects the consideration to which the Group expects to be entitled in exchange for those goods or services. At con-tract inception, once the service component within the time charter contract is deter-mined to be within the scope of IFRS 15, the Group assesses the goods and services promised within each contract and identifies as a performance obligation each good or service that is distinct. Revenue is recognised in the amount of the transaction price that is allocated to the respective performance obligation when (or as) the performance obli-gation is satisfied. In respect of time charter service components, the main promises to the customers gen-erally include catering and accommodation, mobilisation, demobilisation and bunker ser-vices. While the contracts contain several promises, these are usually considered highly inter-dependent and highly interrelated and as such considered as one single performance obligation recognised over time applying a relevant measure of progress. Assessment hereof is performed on a contract-by-contract basis. Prepayments from customers for which the service component has yet to be provided are recognised as deferred income. Revenue is recognised as the service is being pro-vided, being over the term of the related time charter contract. The Group recognise de-ferred contract costs for upfront costs of fulfilling a contract. 2.3.2. Time charter related activities 2.3.2.1 Bunker services The Group is sometimes providing bunker services to help the customers ensure that sufficient bunker is available to operate the vessels at the right time and in the right qual-ity and quantity. As such, for certain projects the Group provides bunker procurement services and assumes responsibility for the logistics and handling of procured bunker. Management’s assessment of whether a principal or agent relationship exists is based upon whether the Group has the ability to control the goods before they are transferred to the customer. This assessment is performed on a contract-by-contract basis at con-tract inception and takes into account various factors such as whether the Group takes legal title of the bunker and has the ability to direct the use of the bunker. 2.3.2.2 Variable consideration related to time charter related activities Variable consideration, for example in respect of weather days and extension of time, is constrained at contract inception to the extent that it is highly probable that a significant reversal in the amount of cumulative revenue recognised will not occur when the uncer-tainty associated with the variable consideration is subsequently resolved. Note 2 Material Accounting Policies Information Continued from previous page |
|
100 2.3.3. Transportation & Installation (T&I) revenue Revenue from T&I consist of installation and transportation of offshore wind turbine foundations, including activities such as heavy lifting operations, decommissioning and planning and engineering. Revenue from T&I contracts is generated from two distinct activities: 1) leasing of vessels and 2) T&I service components. As such, those contracts consist of a leasing component (the element relating to hire of the vessel) and a service component. The service compo-nent is within the scope of IFRS 15, while the leasing component is within the scope of IFRS 16, as described above. To determine revenue recognition for T&I service components, the Group performs in line with the requirements of IFRS 15 the following five steps: (i) identify the contract(s) with a customer; (ii) identify the performance obligations in the contract; (iii) determine the transaction price; (iv) allocate the transaction price to the performance obligations in the contract; and (v) recognise revenue when (or as) the entity satisfies a performance obligation. Revenue from contracts with customers is recognised when control of the goods or services are transferred to the customer at an amount that reflects the consid-eration to which the Group expects to be entitled in exchange for those goods or ser-vices. At contract inception, once the T&I contract is determined to be within the scope of IFRS 15, the Group assesses the goods and services promised within each contract and identifies as a performance obligation each good or service that is distinct. Revenue is recognised in the amount of the transaction price that is allocated to the respective performance obligation when (or as) the performance obligation is satisfied. In respect of T&I service components, the following main promises apply: • Planning and engineering, • Transport of monopiles and secondary steel from supply port to feeder port, • Installation of monopiles and secondary steel offshore, • Storage and handling at feeder port, • Warranty While the contracts contain several distinct promises, these are considered less interde-pendent and interrelated and as such considered multiple performance obligation. As-sessment hereof is performed on a contract-by-contract basis. Revenue is recognised over time as the service is being provided using a cost-to-cost method or straight-line recognition, depending on what better depicts the progress of each separate performance obligation. Prepayments from customers for which the ser-vice component has yet to be provided are recognised as deferred income and recog-nised as revenue over the period during which the services are performed. The Group recognise deferred contract costs for upfront costs of fulfilling a contract. 2.3.3.1 Planning and engineering The Group provides planning and engineering services to the customer. Such revenue is recognised over time is based upon percentage-of-completion whereby total costs in-curred to date are compared with total forecast costs at completion of the planning and engineering services. 2.3.3.3 Transportation of monopiles and secondary steel from supply port to feeder port The Group is engaged with transportation of monopiles and secondary steel from supply port to feeder port. Such revenue is recognised over time based upon percentage-of-completion whereby total time spend on transportation is compared with total forecast time at completion of the transportation. Note 2 Material Accounting Policies Information Continued from previous page |
|
101 2.3.3.3 Storage and handling at feeder port The Group has been tasked with the storage and handling of the material used in the in-stallation. Such revenue is recognised over time is based upon percentage-of-comple-tion whereby total time spend on storage is compared with total forecast time at com-pletion of the storage. 2.3.3.4 Installation of monopiles and secondary steel offshore The Group has been tasked with the installation of the monopiles and secondary steel offshore. Such revenue is recognised over time based upon percentage-of-completion whereby total costs incurred to date are compared with total forecast costs at comple-tion of the planning and engineering services. 2.3.3.5 Warranty obligations The Group provides warranties for the repair of defects which are identified during the contract and within a defined period thereafter. All are assurance-type warranties, as de-fined within IFRS 15, which the Group recognises under IAS 37. The Group does not have any contractual obligations for service-type warranties. 2.3.3.6 Variable consideration related to installation and transportation activities Variable consideration, for example in respect of steel prices, bunker prices etc., is con-strained at contract inception to the extent that it is highly probable that a significant re-versal in the amount of cumulative revenue recognised will not occur when the uncer-tainty associated with the variable consideration is subsequently resolved. 2.4. Cost of sales and administrative expenses Cost of sales consists of expenses directly attributable to the Group’s core activities, in-cluding seafarers payroll, vessel depreciation, and the operation and maintenance of vessels. Administrative expenses, which include administrative staff costs, share-based compen-sation, management costs, office expenses, business combination transaction costs and other administration related expenses, are expensed as they are incurred 2.5. Other operating income and expenses Other operating income and expenses, include transactions not related to the opera-tions of the Group, like, gains and losses on sale of non-current assets, and is generally recognised when it is probable that the benefits and losses associated with the transac-tion will flow to the Company and if the significant risks and rewards have been trans-ferred to the buyer (generally when the transaction is finalised). 2.6. Business combinations and Goodwill 2.6.1. Business combinations Acquired businesses are recognised using the acquisition method. Assets, liabilities, and contingent liabilities of the acquired businesses are measured at fair value at the acquisition date. The fair values of vessels included in property, plant and equipment are determined using broker valuations. The fair values of other assets and liabilities are valued using the approach assessed to be most relevant for the individ-ual item, which can be either a market approach, an income approach, a cost approach or a combination of methods. Note 2 Material Accounting Policies Information Continued from previous page |
|
102 The purchase price comprises the fair value of the consideration payable/receivable. This includes the fair value of the consideration already paid/received including the shares issued, deferred consideration and contingent consideration. The purchase price is allocated to the identified assets, liabilities and contingent liabilities (net assets) based on their fair values at the acquisition date and any excess of the purchase price over the net assets is recognised in the balance sheet as goodwill within intangible assets. In the event the purchase price is lower than the net assets, the difference is recognised in the income statement (a gain from a bargain purchase). 2.6.2. Goodwill Goodwill arises from business combinations and is determined as the excess of the pur-chase price over the fair value of the net assets acquired, including contingent liabilities. Goodwill is allocated to the cash generating unit as determined by Management. Good-will is not amortised but is tested for impairment at least once a year or sooner if impair-ment indication arises. 2.7. Employee compensation Employee benefits are recognised as an expense, unless the cost qualifies to be capital-ised as an asset. Employee compensations include wages and salaries, including compensated absence and pensions, as well as other social security contributions made to the entity’s employ-ees or public & government authorities. The item is net of support schemes made by public & government authorities. 2.8. Financial income and expense Finance income and expenses comprise interest income and expenses and realised and unrealised exchange rate gains and losses on transactions denominated in foreign cur-rencies as well as fair value adjustments related to the ineffective part of the financial in-struments. Interest income and interest expenses are stated on an accrual basis using the principal and the effective interest rate. The effective interest rate is the discount rate that is used to discount expected future cash payments or receipts through the expected life of the financial asset or financial liability to the amortised cost (the carrying value) of such asset or liability. 2.9. Borrowing costs Borrowing costs are capitalised in accordance with IAS 23, where borrowing costs di-rectly attributable to the construction of assets are capitalised until such a time as the asset is substantially ready for its intended use. Borrowing costs consist of interest and other costs that the Group incurs in connection with the borrowing of funds, including fees for guarantees provided by related parties. 2.10. Taxes 2.10.1. Pillar Two Tax Effects In October 2021, more than 130 countries agreed on a two-pillar approach to reform the international tax system. The so-called Pillar Two rules are designed to compel multina-tional corporations with EUR 750 million or more in annual revenue to pay a minimum ef-fective corporate tax rate of 15% on income received in each jurisdiction in which they operate. Note 2 Material Accounting Policies Information Continued from previous page |
|
103 The principal jurisdictions in which the Group may be exposed to additional taxation as a result of the Pillar Two rules include Denmark and the United Kingdom (each of which has enacted legislation implementing the Pillar Two rules), as well as Cyprus (where public consultation on draft legislation is ongoing). In light of the Group’s total revenue, at 31 December 2023, the Group does not expect to be in scope of the Pillar Two rules in 2024. The Group is actively assessing the potential future impact of the Pillar Two rules on the Group’s business. It is the Group’s initial assessment that a portion of its revenues in each of the relevant jurisdictions will be subject to top-up tax under the Pillar Two rules as shipping income, which is generally excluded from the computation of income under Pillar Two. Certain other exclusions may also be applicable and the Group’s analysis of such exclusions is ongoing. 2.10.2. Income tax Current income tax for current and prior periods is recognised at the amount expected to be paid to or recovered from the tax authorities, using the tax rates and tax laws that have been enacted or substantively enacted by the balance sheet date. Management periodically evaluates positions taken in tax returns with respect to situa-tions in which applicable tax regulation is subject to interpretation. It establishes provi-sions, where appropriate, on the basis of amounts expected to be paid to the tax author-ities. Deferred income tax is recognised for all temporary differences arising between the tax bases of assets and liabilities and their carrying amounts in the financial statements ex-cept when the deferred income tax arises from the initial recognition of an asset or liability that affects neither accounting nor taxable profit or loss at the time of the trans-action. Deferred income tax is measured at the tax rates that are expected to apply when the related deferred income tax asset is realised or the deferred income tax liability is set-tled, based on tax rates and tax laws that have been enacted or substantively enacted by the balance sheet date. Current and deferred income taxes are recognised as income or expenses in profit or loss, except to the extent that the tax arises from a transaction which is recognised di-rectly in equity. 2.10.3. Tonnage tax Under the scheme, ship-owners (or bareboat charterers) pay a fixed tax amount per net tonne at their disposal rather than paying taxes based on income, expenses, and depre-ciation. The Company participates in the Danish scheme from 27 November 2020. As the vessels are owned and registered by subsidiaries in jurisdictions different than Denmark, the Group is also subject to tonnage taxation in such jurisdictions. This ton-nage taxation income is calculated based on a fixed tax amount per tonne. This scheme is on a notional income derived from tonnage capacity and not based on the entities' actual income and expenses, the Group does not consider the scheme to fall under the rules of IAS 12. Consequently, the tonnage tax expenses are not presented as part of tax expense in the statement of profit and loss, but are recognised under costs of sales. Note 2 Material Accounting Policies Information Continued from previous page |
|
104 2.11. Inventories Inventories are carried at the lower of cost and net realisable value. Cost is determined using the first-in, first-out basis. Net realisable value is the estimated selling price in the ordinary course of business, less applicable variable selling expenses. Inventory mainly covers fuel and oil. 2.12. Property, plant and equipment Property, plant and equipment are recognised at cost less accumulated depreciation and accumulated impairment losses. The cost of an item of property, plant and equipment initially recognised includes its pur-chase price and any costs that are directly attributable to bringing the asset to the loca-tion and condition necessary for it to be capable of operating in the manner intended by management. Subsequent expenditure relating to property, plant and equipment that has already been recognised is added to the carrying amount of the asset only when it is probable that fu-ture economic benefits associated with the item will flow to the Group and the cost of the item can be measured reliably. All other repair and maintenance expenses are recog-nised in profit or loss when incurred. To keep performing their operational activity, the vessels have an obligation to go through drydock procedures every five years. The costs of the drydock procedures are capitalised per their purchase price and any costs that are directly attributable to bring-ing the vessels to the location and condition necessary for the drydock procedures. Depreciation is calculated using the straight-line method to allocate their depreciable amounts over the assets’ estimated useful life. The estimated useful life is as follows: Useful life Vessels and furnished equipment Up to 25 years Drydock 5 years Cars 5 years Other fixtures and fittings 2 to 3 years The estimated useful life of the vessels of 25 years has been estimated by an external consultant through a determined fatigue analysis based on the technical specification of the vessels. Prior to their acquisition, the vessels had already been in use for 8 years, therefore the remaining useful life of the vessels is estimated at 17 years for all compo-nents except jacking system and main crane with a remaining useful life of 3 years from the acquisition of the vessels. Hull and steel have a salvage value of EUR 10 million per vessel by the end of their useful life. Depreciation is based on costs less the estimated residual value. Residual value is estimated as the lightweight tonnage of each vessel multiplied by the scrap value per ton. More information can be found in Material accounting judgements, estimates and as-sumptions section with regards of acquired vessels trough the business combination. The residual value, useful life, and methods of depreciation of property, plant, and equip-ment are reviewed at each financial year end and adjusted accordingly, if appropriate. Note 2 Material Accounting Policies Information Continued from previous page |
|
105 2.13. Leases When the Group is the lessor Lessor – operating leases The Group leases vessels (the bareboat element relating to hire of the vessel as part of the time charter contracts) under operating leases to non-related parties. This is classi-fied as an operational lease, as such leases do not cover a significant part of the eco-nomic life of the vessels and the Group retains substantially all risks and rewards inci-dental to ownership of the vessels. Rental income from operating leases is recognised in profit or loss on an over time basis over the charter period and included in revenue as stated in Material Accounting Policies section under 2.3.1.1. Initial direct costs incurred by the Group in negotiating and arranging operating leases are capitalised and recognised as an expense in profit or loss over the lease term on the same basis as the lease income. When the Group is the lessee At the inception of the contract, the Group assesses if the contract contains a lease. A contract contains a lease if the contract conveys the right to control the use of an identi-fied asset for a period of time in exchange for consideration. Reassessment is only re-quired when the terms and conditions of the contract are changed. a. Right-of-use assets The Group recognises a right-of-use asset and lease liability at the date which the under-lying asset is available for use. Right-of-use assets are measured at cost which com-prises the initial measurement of lease liabilities using an incremental borrowing rate ad-justed for any lease payments made at or before the commencement date and lease incentive received. Any initial direct costs that would not have been incurred if the lease had not been obtained are added to the carrying amount of the right-of-use assets. The right-of-use asset is subsequently measured at cost, less any accumulated depreci-ation and impairment losses, and adjusted for any remeasurement of lease liability. Right-of-use assets are depreciated on a straight-line basis lease term. b. Lease liabilities At the commencement date of the lease, the Group recognises lease liabilities meas-ured at the present value of lease payments to be made over the lease term. The lease payments include fixed payments (including in-substance fixed payments) less any lease incentives receivable, variable lease payments that depend on an index or a rate, and amounts expected to be paid under residual value guarantees. Variable lease payments that do not depend on an index or a rate are recognised as ex-penses in the period in which the event or condition that triggers the payment occurs. Utilisation lease fees can be classified as a variable fee. In calculating the present value of lease payments, the Group uses its incremental bor-rowing rate at the lease commencement date because the interest rate implicit in the lease is not readily determinable. After the commencement date, the amount of lease liabilities is increased to reflect the accretion of interest and reduced for the lease pay-ments made. Note 2 Material Accounting Policies Information Continued from previous page |
|
106 In addition, the carrying amount of lease liabilities is remeasured if there is a modifica-tion, a change in the lease term, a change in the lease payments (e.g., changes to future payments resulting from a change in an index or rate used to determine such lease pay-ments) or a change in the assessment of an option to purchase the underlying asset. c. Short-term and low-value leases The Group has elected to not recognise right-of-use assets and lease liabilities for short-term leases that have lease terms of 12 months or less and leases of low value-leases. Lease payments relating to these leases are expensed to profit or loss on a straight-line basis over the lease term. Short-term and low-value leases consists of cars, coffee ma-chines, office premises and AV equipment. 2.14. Impairment of non–financial assets Goodwill Goodwill is tested for impairment at least once a year or sooner if impairment indication arises. Impairment testing is performed for each cash-generating unit to which goodwill is allocated, as determined by Management. If the carrying amount of intangible assets exceeds the recoverable, an impairment loss is recognised in profit or loss. Goodwill impairment losses are not subsequently reversed. Property, plant and equipment and right-of-use-assets Property, plant and equipment and right-of-use assets are tested for impairment when-ever there is any objective evidence or indication that these assets may be impaired. For the purpose of impairment testing of assets, recoverable amount (i.e. the higher of the fair value less cost to sell and the value in use) is determined on an individual asset basis unless the asset does not generate cash flows that are largely independent of those from other assets. If this is the case, the recoverable amount is determined for the cash-generating unit (CGU) to which the asset belongs. If the recoverable amount of the asset or CGU is estimated to be less than its carrying amount, the carrying amount of the asset or CGU is reduced to its recoverable amount. The difference between the carrying amount and recoverable amount is recognised as an impairment loss in profit or loss. An impairment loss for an asset is reversed if, and only if, there has been a change in the estimates used to determine the asset’s recoverable amount since the last impairment loss was recognised. The carrying amount of this asset is increased to its revised recoverable amount, pro-vided that this amount does not exceed the carrying amount that would have been de-termined (net of accumulated depreciation) had no impairment loss been recognised for the asset in prior years. A reversal of impairment loss for an asset is recognised in profit or loss. 2.15. Financial assets The classification of financial assets depends on the Group’s business model for manag-ing the financial assets as well as the contractual terms of the cash flows of the financial assets. Note 2 Material Accounting Policies Information Continued from previous page |
|
107 The Group reclassifies financial assets when and only when its business model for man-aging those assets changes. (i) At initial recognition At initial recognition, the Group measures a financial asset at its fair value plus, in the case of a financial asset not at fair value through profit or loss, transaction costs that are directly attributable to the acquisition of the financial assets. Transaction costs of finan-cial assets carried at fair value through profit or loss are expensed in profit or loss. (ii) At subsequent measurement Financial assets Financial assets of the Group mainly comprise of cash and bank balances, trade receiva-bles and other current assets. Interest income from these financial assets are recognised using the effective interest rate method. The Group assesses on forward looking basis the expected credit losses associated with its financial assets carried at amortised cost. For trade and other receivables, the Group applied the simplified approach permitted by IFRS 9, which requires expected lifetime losses to be recognised from initial recognition of the receivables. 2.16. Cash and cash equivalents Cash and cash equivalents are measured at amortised cost. 2.17. Trade and other payables Trade and other payables represent liabilities for goods and services provided to the Group prior to the end of the financial year which are unpaid. They are classified as cur-rent liabilities if payment is due within one year or less (or in the normal operating cycle of the business, if longer). Otherwise, they are presented as non-current liabilities. Trade and other payables are initially recognised at fair value, and subsequently carried at amortised cost, using the effective interest method. 2.18. Deferred income Time charter revenue received in advance and reservation fees are deferred and recog-nised as current liabilities if the service is due within one year or less. Otherwise, they are presented as non-current liabilities. Deferred charter hire income is recognised as reve-nue in profit or loss over time over the period during which the related service is per-formed. 2.19. Financial liabilities Debt to credit institutions etc. is recognised at the time of borrowing at fair value after deduction of transaction costs incurred. Subsequently, the financial liabilities are meas-ured at amortised cost using the "effective interest method", so that the difference be-tween the proceeds and the nominal value is recognised in the income statement under financial expenses over the loan period. A financial liability is derecognised when the obligation under the liability is discharged, cancelled or expires. Note 2 Material Accounting Policies Information Continued from previous page |
|
108 When an existing financial liability is replaced by another from the same lender on sub-stantially different terms, or the terms of an existing liability are substantially modified, such an exchange or modification is treated as the derecognition of the original liability and the recognition of a new liability. The difference in the respective carrying amounts of the asset and the liability is recog-nised in the statement of profit and loss. 2.20. Derivatives and hedge accounting Derivative financial instruments are initially recognised at fair value on the date on which a derivative contract is entered into and subsequently remeasured at fair value over profit and loss. Derivatives are carried as financial assets, presented under derivatives assets, when the fair value is positive and as financial liabilities, presented under deriva-tives liabilities, when the fair value is negative. At the inception of a hedge relationship, the Group formally designates and documents the hedge relationship and the risk management objective and strategy for undertaking the hedge. Changes in the fair value of derivative financial instruments designated as cash flow hedges are recognised in other comprehensive income and presented under “Hedging reserves” (equity). Where the expected future transactions results in the acquisition of non-financial assets, any amounts deferred under equity are transferred from equity to the cost of the asset. Where expected future transaction results in income or expense, amount deferred under equity are transferred from equity to the income statement in the same item as the hedged transaction as a reclassification adjustment. Further, the entity may transfer the cumulative fair value change recognised within equity upon derecogni-tion of the hedged item. Borrowing facilities are derecognised when the obligation under the liability is discharged or cancelled or expires. When an existing financial liability is replaced by another from the same lender on substantially different terms, or the terms of an existing liability are substantially modified, such an exchange or modification is treated as the derecognition of the original liability and the recognition of a new liability. Changes in the fair value of derivative financial instruments not designated as hedges are recognised in the income statement. Certain borrowing facilities when undrawn do not qualify for hedge accounting. Changes in fair value of these derivative financial in-struments are therefore recognised in the income statement under “Financial income” or “Financial expenses” for interest rate swaps. The amount included in the hedging reserve is the lower of, in absolute amounts, of the cumulative fair value adjustment of the hedging instrument and the hedged item. Inef-fectiveness is recognised in the consolidated statement of profit and loss. Further, in case any modifications occur in the hedged risk, the Group will conduct a comprehen-sive review and assessment of the hedge relationship. In a recent evaluation, adjust-ments in debt were carefully assessed in accordance with hedge accounting standards, resulting in no material changes or implications on hedge accounting. 2.21. Share capital Ordinary shares are classified as equity. When there is a capital increase through the is-suance of new shares, these shares are recorded at their nominal value. 2.22. Share premium reserve and retained earnings Capital increase is categorised as equity. Share premium reserve signifies the capital contributed by investors exceeding the nominal value of the shares issued, net of any in-cremental costs directly associated with the issuance of new shares. Retained earnings include results from previous periods, changes to equity arising from business combina-tion purchase price, and share-based payments. Note 2 Material Accounting Policies Information Continued from previous page |
|
109 2.23. Share based payments Employees (including senior executives) of the Group receive remuneration in the form of share-based payments, whereby employees render services as consideration for eq-uity instruments (equity-settled transactions). Equity-settled transactions The cost of equity-settled transactions is determined by the fair value at the date when the grant is made using an appropriate valuation model. That cost is recognised in employee benefits expenses, together with a corresponding increase in equity (retained earnings), over the period in which the service and, where ap-plicable, the performance conditions are fulfilled (the vesting period). The cumulative ex-pense recognised for equity-settled transactions at each reporting date until the vesting date reflects the extent to which the vesting period has expired and the Group’s best es-timate of the number of equity instruments that will ultimately vest. The expense or credit in the statement of profit or loss for a period represents the movement in cumula-tive expense recognised as at the beginning and end of that period. Service and non-market performance conditions are not taken into account when deter-mining the grant date fair value of awards, but the likelihood of the conditions being met is assessed as part of the Group’s best estimate of the number of equity instruments that will ultimately vest. Market performance conditions are reflected within the grant date fair value. Any other conditions attached to an award, but without an associated service require-ment, are considered to be non-vesting conditions. Non-vesting conditions are reflected in the fair value of an award and lead to an immediate expensing of an award unless there are also service and/or performance conditions. No expense is recognised for awards that do not ultimately vest because non-market performance and/or service conditions have not been met. Where awards include a market or non-vesting condition, the transactions are treated as vested irrespective of whether the market or non-vesting condition is satisfied, provided that all other performance and/or service conditions are satisfied. The dilutive effect of outstanding options is reflected as additional share dilution in the computation of diluted earnings per share in a loss situation only if loss per share de-creases. 2.24. Currency translation The financial statements are presented in Euro (EUR), which is also the functional cur-rency of the Parent Company. For each entity in the Group, the Group determines the functional currency and items included in the financial statements of each entity are measured using that functional currency. Transactions in a currency other than the EUR (“foreign currency”) are translated into EUR using the exchange rates at the dates of the transactions. Currency exchange dif-ferences resulting from the settlement of such transactions and from the translation of monetary assets and liabilities denominated in foreign currencies at the closing rates at the balance sheet are recognised in profit or loss. Non-monetary items measured at fair values in foreign currencies are translated using the exchange rates at the date when the fair values are determined. Foreign exchange gains and losses impacting profit or loss are presented in the income statement within finance income or finance expenses. Note 2 Material Accounting Policies Information Continued from previous page |
|
110 On consolidation, the assets and liabilities of foreign operations are translated into euros at the rate of exchange prevailing at the reporting date and their statements of profit or loss are translated at exchange rates prevailing at the dates of the transactions. The ex-change differences arising on translation for consolidation are recognised in other com-prehensive income. On disposal of a foreign operation, the component of other compre-hensive income relating to that particular foreign operation is reclassified to profit or loss. 2.25. Cash flow statement Statement of cash flows The statement of cash flows shows the Group’s cash flows for the year distributed on operating, investing and financing activities, net changes for the year in cash and cash equivalents as well as the Group’s cash and cash equivalents at the beginning and end of the year. Positive amounts indicate cash inflows, whereas negative amounts indicate cash out-flows. Cash flows from operating activities Cash flows from operating activities are stated as the profit/loss for the year adjusted for non-cash operating items such as depreciation, changes in working capital and in-come tax paid or received. Working capital includes current assets less current liabilities, excluding cash and cash equivalents. Cash flows from investing activities Cash flows from investing activities comprise cash flows from the acquisition and sale of non-current assets and businesses. Cash flows from financing activities Cash flows from financing activities comprise cash flows from instalments on lease liabil-ities, and interest paid as well as proceeds from issue of shares and debt as well as pre-payment of borrowings. 2.26. Material accounting judgements, estimates and assumptions The preparation of the Group’s consolidated financial statements requires management to make judgements, estimates and assumptions that affect the reported amounts of revenues, expenses, assets and liabilities, and the accompanying disclosures, and the disclosure of contingent liabilities. Uncertainty about these assumptions and estimates could result in outcomes that require a material adjustment to the carrying amount of as-sets or liabilities affected in future periods. The key assumptions concerning the future and other key sources of estimation uncer-tainty at the reporting date, that have a significant risk of causing a material adjustment to the carrying amounts of assets and liabilities within the next financial year, are de-scribed below. The Group based its assumptions and estimates on parameters available when the consolidated financial statements were prepared. Existing circumstances and assumptions about future developments, however, may change due to market changes or circumstances arising that are beyond the control of the Group. Such changes are re-flected in the assumptions when they occur. Estimates Useful life of vessels The estimation made regarding the duration of the useful life of the vessels has been based on, among other things, an analysis made by an external expert. The determined fatigue analysis is based on the technical specification of the wind turbine installation vessels (“WTIV”) and comparable vessels, the useful life of the vessels is estimated at 25 years. Note 2 Material Accounting Policies Information Continued from previous page |
|
111 In 2020, the Group acquired two vessels which had already been in use for 8 years. Therefore, the remaining useful life of these vessels is estimated at 17 years for all com-ponents except the jacking system and main crane. These components have a remain-ing useful life of 3 years from the acquisition of the vessels. In the current year, the main crane of these vessels is undergoing an upgrade. The old main crane has been disposed of, and the new main crane is expected to be activated in the new year, matching the re-maining useful life of the vessels. In 2023, as part of the business combination, the Group acquired two additional vessels. One of these vessels was delivered in 2015 and the other in 2012. Similar to the vessels acquired in 2020, the estimated useful life of these vessels, 25 years when first acquired, depend on initial delivery. Therefore its useful life is 17 and 14 years, and all components will have the same useful life. The depreciation will be calculated over the remaining use-ful life of these vessels. The residual value, useful life, and methods of depreciation of property, plant, and equip-ment are reviewed at each financial year end and adjusted accordingly, if appropriate. Impairment of non-financial assets Management is responsible for the identification of internal and external indicators of im-pairment related to non-financial assets. If indicators of impairment are identified, an im-pairment test must be performed. Impairment exists when the carrying value of an asset including right-of-use assets or CGU exceeds its recoverable amount, which is the higher of fair value less costs of dis-posal and its value in use. The fair value less costs of disposal calculation is based on available sales transactions conducted at arm’s length terms, if available. The value in use calculation is based on a DCF model. The cash flows are derived from the budget and the most recent project pipeline. These cash flows do not include restructuring ac-tivities or significant future investments which will enhance the performance of the as-sets or CGU being tested. The recoverable amount is sensitive to the discount rate used in the DCF model as well as future cash in-flows and growth rate assumptions, for further information please refer to Note 18. Purchase price allocation In the application of the acquisition method, estimates play a pivotal role in determining the fair values of acquired assets and assumed liabilities, given the absence of observa-ble market prices. Valuation techniques primarily involve assessing the present value of uncertain future cash flows or events at the acquisition date, with more significant esti-mates typically applied to property, plant, and equipment. Due to inherent uncertainties in fair value estimation, adjustments during the measurement period may be necessary. Valuation techniques considered include market-based, income-based, and cost-based methodologies, prioritised in that order. Key assumptions, such as the remaining useful life of vessels, inflation, utilisation rates, and day rates, are integral to these methodolo-gies. Judgements Identification of CGU for the purpose of goodwill impairment For the purpose of testing the Group's vessels the impairment test is performed on a vessel-by-vessel basis. Note 2 Material Accounting Policies Information Continued from previous page |
|
112 For the purpose of testing goodwill for impairment, management has assessed that Cadeler has two cash generating units (CGUs), being • the transport and installation of offshore wind turbine generators and founda-tions installation vessels (WTGFIV) and • the maintenance of offshore wind turbine generators (O&MV) The WTGFIV CGU is comprised of Cadeler’s O-class vessels and Scylla, which are largely interchangeable, and the cash flows generated by them are interdependent. These ves-sels are operated collectively, employed interchangeably, and actively managed to meet the needs of our customers in that market. Given the technical specifications of vessels, the WTGFIV vessels are relatively homogenous with a very high degree of interoperabil-ity. The O&MV CGU is comprised of the vessel Zaratan which has different specifica-tions, has independent and separable cash flows from the other vessels. Revenue recognition Judgement is performed when determining if a contract contains one or more perfor-mance obligations. Judgements is performed as complexities arise when several types of customer contracts are bundled. Evaluating the criteria for revenue recognition requires management's judgement to as-sess and identify performance obligations within the contract. This includes assessing the nature of performance obligations and whether they are distinct or should be com-bined with other performance obligations to determine whether the performance obliga-tions are satisfied over time or at a point in time. In contracts where many activities are bundled judgement is applied in the determination of the most adequate recognition method and the most adequate measure of progress. Both of the judgements have a primary impact on the timing and amount of revenue to be recognised. Evaluating the criteria for revenue recognition with contract with customer requires Man-agement's judgement to assess and determine the following: • Identification of performance obligations within the contract. This includes assessing the nature of performance obligations and whether they are distinct or should be com-bined with other performance obligations to determine whether the performance obliga-tions are satisfied over time or at a point in time. • Determine the transaction price, including an assessment of variable consideration in the contract. • In contract where many performance obligation are bundled, the allocation of transac-tion price to performance obligations to determine the stand-alone selling price of each performance obligation identified in the contract using key assumptions which may in-clude observable market and expected margin in the activities. Macroeconomic factors and climate risks As part of our commitment to transparency and thorough risk management, Cadeler rec-ognises the significance of macroeconomic factors and climate risks in our financial evaluations. In navigating an ever-evolving operational landscape, we acknowledge the importance of factoring in these elements when assessing the useful lives of assets, de-termining residual values, and conducting Discounted Cash Flow (DCF) analyses for im-pairment assessments. Management does not currently consider climate risks to have a material effect on the accounting estimates and judgements for the 2023 consolidate and parent company financial statements. Note 2 Material Accounting Policies Information Continued from previous page |
|
113 Cadeler's strategic investments in offshore wind assets are in line with our dedication to sustainability and our contribution to progressing towards a climate-neutral future. We comprehend the potential impact of climate-related considerations on our operations, including vulnerabilities within our supply chain due to severe weather events. Further-more, we acknowledge the uncertainties in macroeconomic conditions arising from global economic growth rates, political dynamics within the energy sector, currency fluc-tuations, interest rates, and inflation. Additionally, geopolitical tensions introduce further complexities that may influence market prospects and pose risks to our operations, par-ticularly in relation to cyber threats to energy supply. Through diligent assessment and ongoing review processes, Cadeler remains vigilant in integrating these factors into our financial evaluations. We are committed to ensuring that our accounting policies reflect a comprehensive understanding of both macroeco-nomic factors and climate risks, thereby enhancing the robustness of our impairment analyses and financial reporting practices. Note 2 Material Accounting Policies Information Continued from previous page |
|
114 Disaggregation of revenue from contracts with customers by activity The following table provides information about disaggregated revenue. For the year ended 31 December 2023, lease component, included within time charter services and transportation and installation, amounts to EUR 79 million (2022: EUR 91 million; 2021: EUR 43 million). Time charter and time charter related revenue Revenues are recognised over time. Revenue from time charter hire services are con-tracts with customers where the Group utilises its vessels, equipment and crew to deliver a service to the customer based on either a fixed day rate or milestone deliverables. Contracts may also include other promises such as mobilisation and demobilisation, ca-tering and accommodation. Transportation and installation revenue Revenue from Transportation and installation are contracts with customers where the Group utilises its vessels, equipment and crew to perform the transportation and installa-tion of offshore wind turbine foundations as well as heavy lifting operations, decommis-sioning and planning and engineering. Revenue from transportation and installation activities may, depending on the contract, represent one or more performance obligations. Usually a fixed price milestone payment schedule will be agreed upon. The transaction price may include variable elements, such as related to fuel, commodities, etc. Payment terms with customers are considered industry standard and do not include a significant financing component. To the extent possible we obtain payment guarantees to minimise the credit risk during the contract term. Note 3 Revenue EUR’000 2023 2022 2021 Revenue disaggregation Time charter services and transportation and installa-tion services 99,841 104,578 56,449 Other revenue, including fees earned for early termina-tion by customers of contracts 8,781 1,846 4,489 Total revenue 108,622 106,424 60,938 |
|
115 Lease and non-lease components of revenue Revenue from time charter and T&I services include both a lease component (use of the vessels) and a service component. These components are not treated or priced sepa-rately in the contracts, nor does the Group offer either of the services separately. The service component of time charter contracts is primarily derived from crewing costs with a markup, where the residual is deemed to be the lease component. Contract assets and liabilities Customers are typically invoiced on a monthly basis, when the vessels are on contract. Sometimes contracts will accrue revenue for work performed and it will be reported as a contract asset until it is invoiced. For more information about contract assets at the re-porting period, refer to Note 14. The contract liabilities relate to consideration received from customers for the unsatis-fied performance obligation in the charter contracts. Revenue will be recognised when the related services are provided to the customers. Major customers For the year ended 31 December 2023, revenue with three customers each exceeded 10% of total revenue. The revenue derived from these three customers was EUR 44.5 million, EUR 28.5 and EUR 22.7 million respectively. For the year ended 31 December 2022, revenue with two customers each exceeded 10% of total revenue. The revenue derived from these two customers was EUR 52.4 million and EUR 53.2 million respectively. Note 3 Revenue Continued from previous page EUR’000 2023 2022 2021 Beginning of financial year 3,157 16,156 8,810 Acquisition of businesses 1,913 - - Deferred during the year 10,670 2,857 9,097 Recognised as revenue during the year (1,859) (15,856) (1,751) Total liabilities at end of period 13,881 3,157 16,156 |
|
116 For the year ended 31 December 2021, revenue with two customers also each exceeded 10% of total revenue. The revenue derived from these two customers was EUR 24.6 mil-lion and EUR 29.1 million respectively. Operating segments and geographical information The Group operates four windfarm installation vessels, which are viewed as one seg-ment. The vessels operate in a global market and are often redeployed to different re-gions due to changing customers or contracts. Accordingly, we report our operations as a single reportable segment. Contract backlog The Group's order backlog as of the reported date amount to EUR 1,557 million (2022: EUR 780 million; 2021: EUR 409). The table below includes announced contracts as of 31 December. EUR 192 million of the backlog pertains to contracts that management ex-pect to recognise in 2024. EUR million 2023 2022² 2021² Contract backlog as of 31 December¹ Within one year 192 84 110 After one year 1,365 696 299 Total 1,557 780 409 Note 3 Revenue Continued from previous page 1 Contract backlog (excluding bunker) is split between, EUR 1,379 million firm and EUR 178 million options. 2 Contract backlog (excluding bunker) for 2022 was split between, EUR 653 million firm and EUR 127 million op-tions and for 2021, EUR 351 million firm and EUR 58 million options. 116 |
|
117 EUR’000 Note 2023 2022 2021 Cost of sales Right of use asset depreciation 19 30 - - Insurance 1,573 1,933 1,772 Vessel depreciation 18 22,484 21,664 16,077 Impairment of property, plant and equip-ment 18 5,000 - - Crewing costs paid to a related party and an external party 27 - 61 11,517 Seafarer payroll 7 15,921 13,089 1,159 Fuel and oil 711 1,113 892 Maintenance 5,121 4,039 2,305 Messing costs 1,448 1,428 1,224 Seafarer travel 2,835 2,589 1,876 Specific charter costs 4,052 2,623 1,239 Utilities 389 689 541 Other operating expenses 294 309 260 Tonnage tax - - 17 Total cost of sales 59,858 49,537 38,879 EUR’000 Note 2023 2022 2021 Administrative expenses Depreciation and amortisation 17, 18, 19 534 1,020 414 Employee compensation 7 18,889 9,905 7,603 Repair and maintenance expenses 1,123 796 161 Legal and professional fees 2,122 1,047 564 Transaction costs 6 7,707 - - Rental expenses 751 582 584 Travel expense 985 612 305 Management fees to related party 27 - - 115 Marketing and entertainment expenses 602 788 159 Other expenses 1,745 946 1,020 Total administrative expenses 34,458 15,696 10,925 Note 4 Expenses by Nature |
|
118 Auditor remuneration Administrative expenses include fees to the auditors appointed by the shareholder at the Annual General Meeting: EUR’000 2023 2022 2021 Statutory audit 474 125 92 Other assurance services 1,608 - 8 Tax services 2 105 50 Other services 606 51 14 Total 2,690 281 164 Statutory audit services consist of fees for professional services rendered by EY for the audit of our annual consolidated financial statements and services that are provided by the auditor in connection with statutory audit. Other assurance services including PCAOB re-audits and assurance reports in respect of pro-forma financial information in in connection with regulatory filings, and review of in-terim financial information. Tax services consists of Tax compliance services. Other services consists of services provided for other permitted services, including fees for work performed in connection with the U.S. listing in December 2023. Note 4 Expenses by Nature Continued from previous page 118 |
|
119 Other operating income and expenses includes the net gain from the sale of the main cranes and spare parts of both O-class vessels. The contract agreement signed for the sale of both main cranes states a purchase price of EUR 1.5 million for each main crane. In the case of Wind Orca, the book value of the main crane had been written down, reflecting the value that was expected from the dis-posal of the assets. Thus, an impairment loss of EUR 5 million was reflected in the profit and loss. The Osprey main crane had been kept at its carrying amount since there was a gain from the disposal. The sale of both main cranes is driven by the main crane up-grades to the O-Class vessels. Note 5 Other Operating Income and Expenses EUR’000 2023 2022 2021 Other operating income 3,000 - - Other operating expenses (2,863) - - Net other operating income and expenses 137 - - |
|
120 On 19 December 2023, Cadeler acquired 86.39% of shares in Eneti Inc. via a share ex-change offer. The remaining shares were acquired through a squeeze-out merger on 29 December 2023. About Eneti Eneti Inc. has been listed for trading on the NYSE since 12 December 2013 and was an in-ternational shipping company focused on serving the offshore wind and marine-based renewable energy industry by providing installation and maintenance services through the operation WTIVs. WTIVs are vessels specifically designed for the transport and instal-lation of offshore wind turbines, which are power generating devices driven by the kinetic energy of the wind near-shore or further offshore on coastlines for commercial electricity generation, onto pre-prepared foundations. Eneti operated its marine energy business internationally, primarily in Europe and Asia. Eneti generated revenues of USD 141 million in 2023 with close to 300 employees. Strategic rationale and synergies The business combination with Eneti has to combine two leading offshore wind compa-nies. The combination represents a significant step up in the ability to meet the in-creased demand globally for larger and more complex projects. Cadeler and Eneti are a strong match with many potential synergies as a result of similarities in business models, services and strategies. Additionally, scale remains one of the key competitive ad-vantages in the offshore installation market with significant expected operational and commercial benefits driven by an increase in scale, a complementary fleet, and deep in-dustry relationships, to support the needed green transition. Consideration transferred The consideration transferred for the shares in Eneti has been made in Cadeler shares by offering 3.409 ordinary Cadeler shares for one Eneti share. A total of 113,809,868 Cadeler shares have been exchanged, in return of 86% ownership of Eneti, at a fair value of EUR 441.2 million based on the acquisition date share closing price of NOK 44.10 on the Oslo Stock Exchange. In addition, in order to acquire shares not tendered, a squeeze out mer-ger payment of EUR 54.7 million has been settled in cash, in return of 14% ownership of Eneti. Furthermore, an Eneti financing arrangement was settled by Cadeler immediately prior to closing. The payment made by Cadeler of EUR 40.9m, has been adjusted in the transaction price. The total consideration transferred amounts to EUR 536.9 million. Ad-justed for the fair value of cash and cash equivalents acquired and non-cash considera-tion, the net cash purchase price received amounts to EUR 10.4 million. Earnings impact The acquisition of Eneti has contributed revenues of approximately EUR 3.4 million and net loss of approximately EUR (1.1) million to the Group for the period 19 December to 31 December 2023. If the acquisition had occurred on 1 January 2023, the consolidated pro forma revenue and net loss of the combined Group for the year ended 31 December 2023 would have been approximately EUR 234 million and EUR (92) million, respectively. Note 6 Business combination |
|
121 Transaction costs Total transaction costs recognised amount to EUR 14.7 million, of which EUR 7.7 million have been recognised as Administrative expenses in the Consolidated Statement of Profit and Loss and EUR 7.0 million recognised in Equity in the Consolidated Balance Sheet in relation to issuing of Cadeler shares issued for settling the share-for-share ex-change offer. Fair value of acquired net assets and recognised goodwill As the closing of the acquisition was 19 December 2023, the acquisition accounting for the Eneti acquisition is ongoing, thus net assets, goodwill and contingent assets and lia-bilities recognised at the reporting date are to some extent still provisional. Adjustments may be applied to these amounts for a period of up to twelve months from the acquisi-tion date in accordance with IFRS 3 (revised). Goodwill arising from the acquisition has not yet been allocated to the cash generating unit. Goodwill recognised mainly relates to the operational efficiencies and expected syner-gies from the integration of Eneti into the Cadeler Group. Recognised goodwill is non-deductible for tax purposes. Fair value measurement Material net assets acquired for which significant estimates have been applied in the fair value assessment have been recognised using the following valuation techniques: Property, plant and equipment Fair value of property, plant and equipment relating to mainly vessels is measured based on external market valuations at the time of the acquisition carried out by professional appraisers, substantiated by an income approach, based on the present values of the expected cash flows. Receivables The fair value of acquired trade and other receivables and contract assets amounts to EUR 29.4 million. Collectability of receivables has been assessed and no adjustments to the contractual cash flows have been made. As such, it is expected that contractual amounts can be collected. Note 6 Business combination Continued from previous page |
|
122 The provisional fair value of identified net assets and goodwill recognised comprises as follows: Fair value of assets acquired and liabilities assumed Note 6 Business combination Continued from previous page 122 EUR’000 19 December 2023 Provisions 6,987 Deferred tax liabilities 10,315 Trade and other payables 40,271 Lease liabilities 1,300 Deferred charter hire income 1,937 Current income tax liabilities 1,217 Total liabilities 62,027 Total identifiable net assets at fair value 519,962 Goodwill arising on acquisition 16,919 Purchase price transferred 536,881 Cash and cash equivalents acquired 106,056 Consideration paid in shares 441,228 Net cash purchase price (10,403) EUR’000 19 December 2023 Vessels including dry docks 296,707 Vessel under construction 144,219 Other fixtures & fittings 598 Right-of-use assets 1,033 Trade and other receivables 29,408 Inventories 147 Prepayments 3,821 Cash and cash equivalents 106,056 Total assets 581,989 |
|
123 Onshore - presented within administra-tive expenses EUR’000 Note 2023 2022 2021 Wages and salaries 16,957 8,873 6,637 Employer's contribution to defined contribu-tion plans 847 502 350 Share based payment expense 8 1,134 352 360 Other short-term benefits 611 178 145 19,549 9,905 7,492 Average number of full time employees 113 70 58 Employee compensation includes EUR 660 thousands related to bonus paid, included in transaction cost. For more information relate administrative expenses (Note 4). Eneti employees, both onshore and offshore, joined the Group by the end of December 2023. Thus, average number of full-time employees as of 2023 reflect the number of em-ployees divided by 12 months. Eneti had 99 onshore full time employees and 176 seafar-ers by the end of 2023. Offshore crew was hired directly by the Company by the end of November 2021. Average number of full-time employees as of 2021 reflect the number of seafarers. The Company had 148 seafarers by the end of 2021. Labor costs related to certain employees who are working on the management of the newbuilding process have been capitalised. These capitalised costs amount to EUR 1.1 in 2023 and EUR 900 thousands in 2022. Note 7 Employee Compensation Offshore - presented within cost of sales EUR’000 Note 2023 2022 2021 Wages and salaries 14,056 11,693 1,097 Employer's contribution to defined contribu-tion plans 1,124 1,082 60 Other short-term benefits 741 314 2 Total offshore employee compensation 15,921 13,089 1,159 Average number of full time employees 182 162 12 Total EUR’000 Note 2023 2022 2021 Wages and salaries 31,013 20,566 7,734 Employer's contribution to defined contribu-tion plans 1,971 1,584 410 Share based payment expense 8 1,134 352 360 Other short-term benefits 1,352 492 147 Total employee compensation 35,470 22,994 8,651 Average number of full time employees 295 232 70 Number of employees at the end of the re-porting period 570 232 206 |
|
124 In December 2021, a new remuneration scheme was agreed starting in January 2022 and replacing the existing share-based incentive schemes for the majority of eligible employ-ees. The terms of the programme initiated in December 2021 are: (i) with effect from 2021, an annual cash bonus up to 12 months of salary for the CEO, and up to 6 months for selected employees. This bonus is at the discretion of the board and paid in cash the following January. Bonuses regarding selected employees is expensed in 2023. (ii) with effect from 2021, an annual cash bonus up to 3 months of salary for other em-ployees. This bonus paid based on Company, team and individual performance. The bo-nus is paid in cash at the end of the calendar year. (iii) in January 2022, the executive management and selected employees were granted from 10,393 to 55,430 Restricted Share Units (RSU) which will vest July 2024 and are con-ditional upon continued employment within Cadeler. The total value of the RSU alloca-tion is calculated based on the Company's closing share price on Nasdaq Copenhagen A/S on the day of the grant and the value is EUR 394 thousand (EUR 3.3 per RSU). The expense recognised in profit and loss for the year amounts to EUR 143 thousand (EUR 157 thousand in 2022). The average remaining contractual life as of 31 December 2023 is 0.5 years. (iv) in January 2022, the executive management and selected employees were granted from 10,393 to 55,430 Options in Cadeler shares which will vest May 2024 and expire in April 2027. The strike price will range from NOK 36.02 to NOK 38.42 depending on the ex-ercise period and are conditional upon continued employment within Cadeler. The fair value of these granted options was determined using the Black-Scholes model and the value is EUR 160 thousand (EUR 1.3 per RSU). The expense recognised in profit and loss for the year amounts to EUR 62 thousand (EUR 69 thousand in 2022). The average re-maining contractual life for the options as of 31 December 2023 is 3.3 years. For the programmes described in (iii) and (iv) the annualised volatility of the shares 48.1% is based on the historical volatility of the price of shares, annual risk free interest rate of 1%, dividend yield of zero, expected life until expiration date and average share price of EUR 3.7. (v) in May 2022, the executive management and selected employees were granted from 43,420 to 221,719 Options in Cadeler shares which will vest in May 2025 and expire in May 2028. The strike price will be NOK 40.24 and is conditional upon continued employment within Cadeler. The fair value of these granted options was determined using the Black-Scholes model and the value is EUR 761 thousand (EUR 1.3 per RSU). The expense recog-nised in profit and loss for the year amounts to EUR 237 thousand. The average remain-ing contractual life for the options as per 31 December 2023 is 4.3 years. The annualised volatility of the shares 42.5% is based on the historical volatility of the price of shares, annual risk free interest rate of 2.8%, dividend yield of zero, expected life until expiration date and average share price of EUR 3.7. (vi) in January 2023, the executive management and selected employees were granted from 19,760 to 130,416 Restricted Share Units which will vest in July 2025 and are condi-tional upon continued employment within Cadeler. The total value of the RSU allocation is calculated based on the Black-Scholes model and the value is EUR 1.2 million (EUR 3.0 per RSU). The expense recognised in profit and loss for the year amounts to EUR 498 thousand. The average remaining contractual life is 1.5 years. The average share price is NOK 36.56. Note 8 Long Term Incentive Programs |
|
125 (vii) In August 2023, the executive management and selected employees were granted from 88,920 to 385,320 Options in Cadeler shares which will vest in August 2026 and ex-pire in August 2029. The strike price will be NOK 45.49 and is conditional upon continued employment within Cadeler. The fair value of these granted options was determined us-ing the Black-Scholes model and the value is EUR 2.2 million (EUR 1.8 per RSU). The ex-pense recognised in profit and loss for the year amounts to EUR 250 thousand. The aver-age remaining contractual life for the options as of 31 December 2023 is 5.5 years. The annualised volatility of the shares 61.0% is based on the historical volatility of the price of shares, annual risk free interest rate of 2.68%, dividend yield of zero, expected life until expiration date and average share price of EUR 3.7. The Group previously had a share-based incentive scheme for its key employees in con-nection with the IPO, with the following key terms: (viii) an incentive varying from 1 to 8 months of salary of the key employee paid in shares in the event the Offering is successful. The gross monthly salary and share price for the basis of calculation of the shares to be issued is based on the gross monthly salary of the employee and share price on the first day of trading of the shares. The initial share price was set at observable input 27 November 2020 (146,626 shares) and was paid out in cash at the share price after the vesting period 27 November 2021. The initial cost was calculated to EUR 504 thousand but was paid out at EUR 734 thou-sand. The charge to equity amounts to EUR 230 thousand. (ix) an incentive varying from 2 to 4 months of salary of the key employee paid in shares for the continuous employment of the employee for each full calendar year of 2020 and 2021. The incentive will be paid with the employee’s salary in June in the following year, i.e., in June 2021 and June 2022. The gross monthly salary and share price for the basis of calculation of the shares to be issued is based on the gross monthly salary of the em-ployee and share price on the date the incentive will be paid in June 2021 and June 2022. As stated above this programme was terminated for most of employees and this part is reversed in equity and in profit and loss as well. The amount reversed regarding 2020 is EUR 3 thousand and 2021 EUR 167 thousand. (x) with effect from 2021, a tiered annual bonus scheme for the CEO of the Company linked to KPIs and business profitability, which is capped at 8 months of gross monthly salary of the CEO paid in shares. The gross monthly salary and share price for the basis of calculation of the shares to be issued is based on the gross monthly salary of the CEO and shares price on the date falling 30 days from the date of filing of the audited ac-counts of the Company for the financial year. As stated above this programme is terminated and was replaced with a cash bonus. The programme was accounted for as a cash-based incentive programme for 2021 and the full cash bonus was expensed for in 2021. None of these instruments are exercisable at the reporting period. Note 8 Long Term Incentive Programs Continued from previous page |
|
126 2023 2022 Executive management Other employees Executive management Other employees Outstanding instruments - Options Number WAEP¹ Number WAEP¹ Number WAEP¹ Number WAEP¹ Outstanding at 1 January 344,589 3.16 330,963 3.15 - - - - Granted during the year 622,440 3.64 563,160 3.64 344,589 3.16 330,963 3.15 Forfeited during the year - - - - - - - - Exercised during the year - - - - - - - - Expired during the year - - - - - - - - Outstanding at 31 December 967,029 3.47 894,123 3.46 344,589 3.16 330,963 3.15 2023 2022 Executive management Other employees Executive management Other employees Outstanding instruments - RSU Number WAEP¹ Number WAEP¹ Number WAEP¹ Number WAEP¹ Outstanding at 1 January 55,430 - 65,823 - - - - - Granted during the year 189,696 - 205,504 - 55,430 - 65,823 - Forfeited during the year - - - - - - - - Exercised during the year - - - - - - - - Expired during the year - - - - - - - - Outstanding at 31 December 245,126 - 271,327 - 55,430 - 65,823 - Note 8 Long Term Incentive Programs Continued from previous page 1EUR Weighted average exercise price (WAEP). |
|
127 2023 2022 2021 EUR’000 Board of directors Executive management Total Board of directors Executive management Total Board of directors Executive management Total Wages, salaries and board fees 183 850 1,033 180 683 863 180 650 830 Share based payment - 588 588 - 173 173 - 164 164 Other short-term benefits - 55 55 - 36 36 - 23 23 Cash bonus - 1,155 1,155 - 482 482 - 314 314 Total management compensation 183 2,648 2,831 180 1,374 1,554 180 1,151 1,331 Executive management Executive management means the members of the executive management which were registered with the Danish business authority and who have the authority and responsi-bility for the planning, directing and controlling activities of the Company as defined by IAS 24. In 2021, Key management also included personnel who supported executive man-agement, for the planning, directing and controlling activities of the Company. Board of directors Andreas Sohmen-Pao and Andreas Beroutsos are employed by the BW Group. These board members have not received remuneration from Cadeler in 2021, 2022 and 2023. Andreas Beroutsos stepped down from the Board with effect from 25 April 2023. On the same date, Andrea Abt joined the Board. David Peter Cogman is employed by the Swire Group and has not received remuneration from Cadeler in 2021, 2022 and 2023. David Peter Cogman stepped down from the Board with effect from 16 June 2023 along with Connie Hedegaard. On 20 February 2024, Emanuele Lauro and James Nish joined the Board. Emanuele Lauro is the Director and Chief Executive Officer of Scorpio Holdings Limited considered a related party (See Note 27). Note 9 Board of Directors and Management Compensation |
|
128 EUR’000 2023 2022 2021 Foreign currency gain 109 3,424 1,795 Fair value change of derivative (ineffectiveness) - 363 - Interest gained 1,432 244 - Finance income 1,541 4,031 1,795 EUR’000 2023 2022 2021 Interest expense - Interest linked to debt liabilities 2,851 1,351 2,727 - Interest with related parties - 157 684 Fair value change of derivative (ineffectiveness) 765 - - Lease liabilities 25 21 30 Foreign currency loss 389 7,834 1,692 Bank fees 456 318 358 Finance expenses 4,486 9,681 5,491 Total interest paid in 2023 as per Consolidated Statement of Cash Flows amounts to EUR 7.1 million (2022: EUR 4.2 million) which have been capitalised to Property, Plant and Equipment. For more information refer to Note 18. Total interest linked to debt liabilities include EUR 1.9 million (2022: EUR 0.9) due to write off of loan fees relate to the previous debt facility and an additional EUR 1.0 million from the amendment to that prior facility in June 2023. Note 10 Finance Income and Expenses 128 |
|
129 EUR’000 2023 2022 2021 Income tax expense Tax expense attributable to profit is made up of: Utilisation of non-recognised tax losses offset against Danish Tonnage Tax expense - - (13) Total Income tax expense - - (13) An expansion of the Danish tonnage tax regime to cover wind farm installation vessels was passed in January 2020 with retroactive effect from 2017, inclusive. On 15 December 2020, Cadeler A/S received a binding ruling from the Danish Tax Au-thorities. According to this, Cadeler A/S was able to apply the Danish Tonnage Taxation after the listing of the shares 27 November 2020. Management applied the Danish Ton-nage Taxation since 2021. The recorded tonnage tax expense for 2023 in Denmark and Cyprus amount to EUR 0 thousand and EUR 5 thousand respectively (2022: EUR 0 thou-sand and EUR 5 thousand respectively; 2021: EUR -13 thousand and EUR 5 thousand re-spectively). Cadeler A/S also has material tax losses from previous periods available for carry for-ward. Such tax losses can be utilised against future tonnage taxation income and other income, which does not qualify for tonnage taxation. The tax value of tax losses to be carried forward as of 31 December 2023 are approximately EUR 13 million (EUR 13 and EUR 12 million as of 31 December 2022 and 2021, respectively) and have not been recog-nised as it is not considered probable that the tax loss will be utilised. The tax losses are not subject to expiration. The Company operates in several countries. The Group’s annual tax positions are based on taxable income, statutory rates and allowances, transfer pricing assumptions and the interpretation of the tax laws in the various jurisdictions of its operations. Such positions require significant judgment and the use of estimates and assumptions regarding significant future events such as the amount, timing and tax characterisation of certain transactions, changes in tax laws and treaties, and the timing and amount of profitability in each location in any given year. Additionally, certain of our entities enter into agreements with other of our entities to provide specialised services and equipment to their operations. However, in some juris-dictions the interpretation of tax laws relating to the pricing of transactions between re-lated parties could potentially result in tax authorities asserting additional tax liabilities with no offsetting tax recovery in other jurisdictions. The Company’s tax filings may be subject to regular audits by the tax authorities as ap-plicable to local law. These audits may result in assessments for additional taxes that are resolved with the authorities or, potentially, through the courts. Due to the uncertain and complex application of tax regulations, the ultimate resolution of audits may result in lia-bilities that could be materially different from these estimates. In such an event, the Company will record additional tax expense or tax benefit in the period in which such resolution occurs. The Company reviewed the carrying amount of deferred tax assets at the reporting date and assessed if sufficient taxable profits will be available to allow a deferred tax asset to be utilised either in full or in part. To assess the availability of future taxable profits, man-agement estimates future revenues and costs, capital allowances and tax planning op-portunities. Note 11 Income Taxes |
|
130 After consideration of all the information available, including its historical operating losses over the last three years, management believes that sufficient uncertainty exists with respect to future realisation of deferred tax assets and therefore has not been rec-ognised. The Company assess that such deferred tax assets do not meet the recogni-tion criteria until it can sustain a level of taxable profitability that demonstrates its ability to realise these assets. Deferred tax Deferred tax relates to the following: EUR’000 2023 2022 2021 Reconciliation of deferred tax liabilities, net Beginning of financial year - - - Acquisition of businesses 10,321 - - Exchange differences (130) - - 31 December 2023 10,191 - - Deferred tax positions as at 31 December 2023 relates to vessels. Note 11 Income Taxes Continued from previous page Effective Tax Rate 2023 2022 2021 EUR’000 % EUR’000 % EUR’000 % Tax expense attributable to profit is made up of: Accounting profit before income tax 11,498 35,541 7,450 Adjustment regarding tonnage taxed income (11,498) (35,541) (7,450) Accounting profit before income tax relating to Corporation Tax - - - Calculated tax at statutory tax rate in Denmark, 22 % - 22 - 22 - 22 Tax impact from: Change in impairment of deferred tax assets in the year - 22 - 22 (13) 22 Income tax expense, reported - - - - (13) - Effective tax rate (%) 0.0% 0.0% 0.0% |
|
131 Basic EPS is calculated by dividing the profit for the year attributable to ordinary equity holders of the parent by the weighted average number of ordinary shares outstanding during the year. Diluted EPS is calculated by dividing the profit attributable to ordinary holders of the par-ent by the weighted average number of ordinary shares outstanding during the year plus the weighted average number of ordinary shares that would be issued on conversion of all the dilutive potential ordinary shares into ordinary shares. The weighted average number of ordinary shares takes into account the weighted aver-age effect of share based payments during the year as well as issuance of shares in con-nection with business combination with Eneti. In December 2023, 113 million shares were issued for this business combination. The following table reflects the income and share data used in the basic and diluted EPS calculations: EUR’000 2023 2022 2021 Profit attributable to ordinary equity holders of the parent for basic earnings 11,498 35,541 7,451 Profit attributable to ordinary equity holders of the parent adjusted for the effect of dilution 11,498 35,541 7,451 Thousands 2023 2022 2021 Weighted average number of ordinary shares for basic EPS¹ 201,362 163,219 131,161 Effect of dilution from shared based payments pro-gramme 1,861 676 - Weighted average number of ordinary shares ad-justed for the effect of dilution¹ 203,223 163,895 131,161 Note 12 Earnings Per Share (EPS) There have been no other transactions involving ordinary shares or potential ordinary shares between the reporting date and the date of authorisation of these Financial Statements. 1The weighted average number of shares takes into account the weighted average effect of share based payments during the year. |
|
132 EUR’000 2023 2022 2021 Cash at bank and on hand 96,608 19,012 2,308 The Company is holding cash by 31 December 2023 with the intention of paying asset under construction related instalments in the first half of 2024. Note 13 Cash and Bank Balances 132 |
|
133 EUR’000 2023 2022 2021 Trade receivables from non-related parties 26,802 17,635 18,424 Contract assets 8,880 19,999 843 Receivables from related parties 592 - - Other receivables 3,158 600 1,106 39,432 38,234 20,373 As of 31 December 2023, the Company's receivables include contract assets totalling EUR 8.9 million, a significant decrease from EUR 20 million in 2022. These contract as-sets represent the Company's entitlement to proportional consideration for ongoing pro-jects as of the balance sheet date. Typically, these contract assets are reclassified to trade receivables when the Company fulfils its obligations and the right to consideration becomes unconditional, usually upon completion of the project. Expected credit loss on trade receivables The Group has historically only experienced immaterial losses on trade receivables, if any. Further, a material part of the cash flows in the contracts are prepayments received up front. The Group's assessment remains consistent with its past practices. Although some posi-tions may transition to 30 days overdue, our overall position on credit risk management remains unchanged. This assessment is supported by historical data, a select group of reliable debtors, and our outlook for the future. EUR’000 Trade receivables Contract assets Expected loss Total 31 December 2023 Not due 9,639 8,880 - 18,519 Overdue 1-30 days 14,287 - - 14,287 Overdue 31 to 60 days 603 - - 603 Overdue +61 days 2,273 - - 2,273 Total 26,802 8,880 - 35,682 31 December 2022 Not due 17,197 19,999 - 37,196 Overdue 1-30 days 438 - - 438 Overdue 31 to 60 days - - - - Overdue +61 days - - - - Total 17,635 19,999 - 37,634 31 December 2021 Not due 7,850 843 - 8,693 Overdue 1-30 days 8,962 - - 8,962 Overdue 31 to 60 days 316 - - 316 Overdue +61 days 1,296 - - 1,296 Total 18,424 843 - 19,267 Note 14 Trade and Other Receivables |
|
134 EUR’000 2023 2022 2021 Fuel and oil 1,836 549 440 As of 31 December 2023, the Company's inventories include fuel and oil totalling EUR 1.8 million, a significant increase from EUR 0.5 million in 2022 since three of our four operat-ing vessels were off hire at the end of the reporting period. Note 16 Prepayments Prepayments include deferred costs like bank loan fees, insurance annual premiums and software annual subscriptions. Note 15 Inventories 134 EUR’000 2023 2022 2021 Prepayments 9,562 1,699 1,497 |
|
135 Software additions during 2023 are mainly related to further developments of the Com-pany software solutions. While 2021 additions were mainly implementation costs for Enterprise Resource and Planning (ERP), Vessel and Crew Management software, 2022 additions are mainly fur-ther developments of these initially implemented solutions. Impairment Test Management has performed impairment test of goodwill allocated to each CGU as at December 31, 2023. Goodwill of EUR 16.9 million was recognised on 19 December 2023 relating to the Eneti acquisition. The Group has two CGUs being the transport and installation of offshore wind turbine generators and foundations vessels (WTGFIV), Cadeler’s O-class vessels and Scylla; and the maintenance of offshore wind turbine generators (O&MV) cash-gen-erating unit, comprising Zaratan. At 31 December 2023, Management has not yet con-cluded on the allocation of goodwill, which could be either to a single CGU or to both CGUs'. Management assessed goodwill for impairment on entity level (being both CGUs), which showed no indication of impairment, based on the quoted price of Cadeler’s shares. For more information related to Goodwill recognised and allocation of goodwill to CGU, please refer to Note 6. Note 17 Intangible Assets 2023 2022 2021 EUR'000 Software Goodwill Total Software Software Cost Beginning of period 662 - 662 434 - Acquisition of businesses - 16,919 16,919 Additions 31 - 31 228 434 Exchange differences - (212) (212) 31 December 693 16,707 17,400 662 434 Accumulated depreciation Beginning of period 243 - 243 32 - Depreciation charge 210 210 211 32 31 December 453 - 453 243 32 Net book value 240 16,707 16,947 419 402 |
|
136 Note 18 Property Plant and Equipment EUR'000 Vessels Dry Dock Other fixtures and fittings Assets under Construction Total Cost 2023 Beginning of financial year 282,282 9,261 536 356,163 648,242 Acquisition of businesses 296,536 171 599 144,219 441,525 Additions 227 - 3 73,169 73,399 Disposals (8,002) (291) - - (8,293) Exchange differences (4,683) (6) (159) (1,806) (6,654) 31 December 2023 566,360 9,135 979 571,745 1,148,219 Accumulated depreciation and impairment Beginning of financial year 39,570 2,023 445 - 42,038 Depreciation charge 20,847 1,637 19 - 22,503 Disposals (5,722) (108) - - (5,830) Impairment on disposal 5,000 - - - 5,000 Exchange differences (968) (4) (152) - (1,124) 31 December 2023 58,727 3,548 312 - 62,587 Net book value 507,633 5,587 667 571,745 1,085,632 |
|
137 Due to business combination with Eneti, the Group’s property, plant, and equipment in-creased by EUR 441.5 million in 2023. This primarily comprised the Operating Vessels Wind Scylla and Wind Zaratan (EUR 205,879 and EUR 86,927, respectively) and the new-builds under construction, the M-Class down payments for EUR 144 million. Additions during 2023 are mainly driven by down payments of EUR 42 million for the new P-class installation vessels (EUR 15.4 million), the new A-class foundation installation ves-sels (EUR 3.8 million) and instalments for the main cranes for both Wind Orca (EUR 16.0 million) and Wind Osprey (EUR 6.8 million), represented above on Assets under Construc-tion. In addition, Assets under Construction contains EUR 7.6 million worth of guarantee fees to BW Group related to the A-class and P-class newbuild vessels as well as EUR 5.7 million of assets related to future projects that have not yet started. Borrowing costs for 2023 has been capitalised for a total of EUR 7.1 million (2022: EUR 4.2 million). The capitalisation rate used to determine the amount of borrowing costs to be capitalised is the weighted average interest rate applicable to the Company’s general borrowings during the reported period, in this case 5.5% (2022: 5.7%). Disposals during 2023 are mainly driven by the main cranes upgraded in both O-Class vessels, as well as impairment recognised. For further details, please refer to Note 5. Note 18 Property Plant and Equipment Continued from previous page |
|
138 Additions during 2022 are mainly driven by down payments for EUR 167 million of the two new A-class foundation installation vessels and instalments for the main cranes for both Wind Orca (EUR 10.7 million) and Wind Osprey (EUR 16.3 million), represented above on Assets under Construction. There was also a transfer from assets under construction to additions for EUR 11 million, of which EUR 9 million due to the capitalisation of vessel equipment. Borrowing costs for 2022 has been capitalised for a total of EUR 4.2 million. The capitali-sation rate used to determine the amount of borrowing costs to be capitalised is the weighted average interest rate applicable to the Company’s general borrowings during the reported period, in this case 5.7%. Note 18 Property Plant and Equipment Continued from previous page EUR'000 Vessels Dry Dock Other fixtures and fittings Assets under Construction Total Cost 2022 Beginning of financial year 258,148 1,983 536 158,734 419,401 Additions 15,105 5,281 - 208,455 228,841 Transfer from assets under construction 9,029 1,997 - (11,026) - 31 December 2022 282,282 9,261 536 356,163 648,242 Accumulated depreciation Beginning of financial year 19,629 300 386 - 20,315 Depreciation charge 19,941 1,723 59 - 21,723 31 December 2022 39,570 2,023 445 - 42,038 Net book value 242,712 7,238 91 356,163 606,204 |
|
139 Additions during 2021 are mainly driven by down payments for EUR 137 million of the two new P-Class WTIVs and new crane for Wind Orca (EUR 7 million), represented above on Assets under Construction. Note 18 Property Plant and Equipment Continued from previous page EUR'000 Vessels Dry Dock Other fixtures and fittings Assets under Construction Total Cost 2021 Beginning of financial year 255,030 1,050 379 - 256,459 Additions 3,118 933 157 158,734 162,942 31 December 2021 258,148 1,983 536 158,734 419,401 Accumulated depreciation Beginning of financial year 3,853 - 280 - 4,133 Depreciation charge 15,776 300 106 - 16,182 31 December 2021 19,629 300 386 - 20,315 Net book value 238,520 1,683 150 158,734 399,087 |
|
140 Impairment Test on vessels (excluding goodwill) The Company has neither identified internal nor external impairment indicators. However, on a voluntary basis management performs an impairment test every year. For the pur-pose of testing the Group's vessels the impairment test is performed on a vessel-by-vessel basis. The Company is applying both fair value less costs of disposal (FVLCOD) to determine the arm’s length sale price of an asset at the measurement date and the value-in-use (VIU) method for estimating the expected future cash flows that the asset in the current condition will produce. The VIU method assumes the asset will be recovered principally through its continuing use. The impairment test involves estimating both FVLCOD and VIU and comparing the higher amount to the asset’s carrying amount. The Group has two CGUs being the transport and installation of offshore wind turbine generators and foundations vessels (WTGFIV), comprising Cadeler’s O-class vessels and Scylla; and the maintenance of off-shore wind turbine generators (O&MV) cash-generating units, comprising Zaratan. As of 31 December 2023, Management tested the carrying amount of its two CGUs including goodwill for impairment, cf. note 17, and each vessel on a stand-alone basis as described below. Independent market values on each vessel Two independent evaluations of the market value of the two O-class vessels were re-ceived in the second half of 2023. The first evaluation was made the 9 November 2023 by Clarksons Valuations Limited for an estimation of USD 400-440 million (correspond-ing to EUR 377-415 million), which is 67-84% higher than the carrying amount. The second vessel evaluation was made the 13 November 2023 by Fearnleys Asia (Singapore) Pte Ltd for an estimation of USD 332 million (corresponding to EUR 313 million), which is 34% higher than the carrying amount. In addition, two independent evaluations of the market value of Wind Scylla were re-ceived in November 2023. The first evaluation was made by Clarksons Valuations Limited for an estimation of USD 225-240 million (corresponding to EUR 203-217 million), which is 5% higher than the carrying amount. The second vessel evaluation was made by Pareto for an estimation of USD 285-295 million (corresponding to EUR 258-267 million), which is 25-29% higher than the carrying amount. Two independent evaluations of the market value of Wind Zaratan were performed in the second half of 2023. The first evaluation was made by Clarksons Valuations Limited for an estimation of USD 95-115 million (corresponding to EUR 86-104 million), which is 21% higher than the carrying amount. The second vessel evaluation was made by Pareto for an estimation of USD 95-105 million (corresponding to EUR 86-95 million), which is 10% higher than the carrying amount. The impairment assessment involves comparing net book values with broker valuations. The net book value is below the broker valuations, hence there is headroom all vessels. Management assesses key input inputs used in the independent evaluations to support no impairment indicators as explained below. Note 18 Property Plant and Equipment Continued from previous page |
|
141 VIU calculation As of December 2023, Management has prepared a value-in-use calculation for the ves-sels. For the acquired vessels in December 2023, management relied on input from DCF models in connection with accounting for the business combination, cf. note 6. The discounted cash flow period has been calculated from the remaining useful life of the vessel as this is deemed most representative for the actual value of the vessels. The VIU is calculated based on cash flow projections in financial budgets and business plans as follows: – From 2024 revenue is based on a combination of signed contracts and market estimated day rates and utilisation for O-class vessels (using externally available information) and a yearly increase of 2%. – OPEX includes expected 2024 levels (using internal forecasts) plus an increase for inflation on following years and CAPEX includes full investment on crane up-grades based on investment budget. The discount rate used in the calculation is based on a Weighted Average Cost of Capi-tal (WACC) of 9.5% after tax, (8% after tax in 2022 and 8.5% after tax in 2021). As the Company is subject to the tonnage tax regime, the tax consideration in the WACC calcu-lation for impairment of a vessel is immaterial. Therefore, the before and after tax WACC remain the same for impairment testing purposes. WACC is calculated by using a stand-ard WACC model in which cost of equity, cost of debt and capital structure are the key parameters. The calculation showed no need for impairment as the future value of cashflows were higher than the Net Book Value of the vessels. A sensitivity analysis was also undertaken assuming an increase or decrease in the WACC by 1% as well as an increase or decrease in the revenue by EUR 20 thousand per day. Within this sensitivity analysis the calculations also showed no need for impairment as the future value of cashflows were higher than the Net Book Value of the vessels. The value in use test further showed that headroom is calculated with respect to the in-vestment in new cranes. Newbuilds As for the newbuilds vessels it is management opinion that current signed contracts and the expected day rates in the future support no impairment indicators. Note 18 Property Plant and Equipment Continued from previous page |
|
142 The discount rate used in the calculation is based on a Weighted Average Cost of Capi-tal (WACC) of 9.5% after tax, (8% after tax in 2022 and 8.5% after tax in 2021). As the Company is subject to the tonnage tax regime, the tax consideration in the WACC calcu-lation for impairment of a vessel is immaterial. Therefore, the before and after tax WACC remain the same for impairment testing purposes. WACC is calculated by using a standard WACC model in which cost of equity, cost of debt and capital structure are the key parameters. The calculation showed no need for impairment as the future value of cashflows were higher than the Net Book Value of the vessels. A sensitivity analysis was also undertaken assuming an increase or decrease in the WACC by 1% as well as an increase or decrease in the revenue by EUR 20 thousand per day. Within this sensitivity analysis the calculations also showed no need for impairment as the future value of cashflows were higher than the Net Book Value of the vessels. Sufficient headroom is calculated with respect to the investment in new cranes. The impairment assessment for Wind Scylla and Wind Zaratan involves comparing their net book values with broker valuations. The net book value is below the broker valua-tions, hence there is sufficient headroom for the S-Class and Z-Class vessels. As for all the newbuilds vessels it is management opinion that current signed contracts and the expected day rates in the future support the agreed purchase prices of the vessels. Note 18 Property Plant and Equipment Continued from previous page 142 |
|
143 Nature of the Group leasing activities Leasehold equipment In 2022 the Group started an agreement for the use of vessel equipment for a total con-tract value of EUR 464 thousand during the initial term, plus additional repair and installa-tion costs. The amount was amortised over the initial term which was 13 months, ending in 2023. Office space The Group leases office space for the purpose of office operations. In 2023, the Com-pany has terminated the lease agreement for its headquarters and signed a contract with Castellum Denmark, for a new location from 2024. The lease commitment is pre-sented in Note 23. Warehouse facilities The Group leases a warehouse facility located in the UK. EUR'000 Leasehold equipment Warehouse facilities Office space Total Cost 2023 Beginning of financial year 464 - 1,681 2,145 Acquisition of businesses - 421 612 1,033 Exchange differences - (12) (32) (44) 31 December 2023 464 409 2,261 3,134 Accumulated depreciation Beginning of financial year 381 - 1,477 1,858 Amortisation charge 83 30 221 334 Exchange differences - (6) (25) (31) 31 December 2023 464 24 1,673 2,161 Net book value - 385 588 973 Note 19 Right of Use Assets |
|
144 EUR'000 Leasehold equipment Office space Total Cost 2022 Beginning of financial year - 1,572 1,572 Movement during the year 464 109 573 31 December 2022 464 1,681 2,145 Accumulated depreciation Beginning of financial year - 1,108 1,108 Amortisation charge 381 369 750 31 December 2022 381 1,477 1,858 Net book value 83 204 287 EUR'000 Office space Total Cost 2021 Beginning of financial year 1,572 1,572 31 December 2021 1,572 1,572 Accumulated depreciation Beginning of financial year 832 832 Amortisation charge 276 276 31 December 2021 1,108 1,108 Net book value 464 464 Please refer to Note 24 for disclosure on the lease liabilities and to Note 23 for disclosure on lease commitment Note 19 Right of Use Assets Continued from previous page |
|
145 Lease interest expenses recognised in profit and loss a. Interest expense EUR'000 2023 2022 2021 Interest expense on lease liabilities (vessels and office) 25 21 30 b. Lease expense not capitalised in lease liabilities EUR'000 2023 2022 2021 Short-term lease expense 180 53 34 c. Total cash outflow for all leases in 2023, 2022 and 2021 were EUR 283 thousand, EUR 728 thousand and EUR 315 thousand respectively, excluding variable lease fee (refer to Note 24). EUR'000 2023 2022 2021 Repayment of lease liability 283 728 315 Rental above standby rate - - 196 Cash outflow for leases that are not capital-ised 180 53 34 463 781 545 EUR’000 2023 2022 2021 Trade and other payables: Trade payables 8,399 3,979 2,795 Other payables 24,237 4,843 6,908 32,636 8,822 9,703 The increase in other payables is attributed to year-end activity and temporal mis-matches in payment processing, including cut-off procedures. EUR’000 2023 2022 2021 Provisions: Beginning of financial year - - - Acquisition of businesses 6,987 - - Exchange differences (88) - - 6,899 - - A provision is recognised for certain contracts with customers for which the unavoidable costs of meeting the performance obligations exceed the economic benefits expected to be received. It is anticipated that these costs will be incurred in the next financial year. Note 19 Right of Use Assets Continued from previous page Note 20 Provisions, Trade and Other Payables |
|
146 Cadeler A/S has material tax losses from previous periods available to carry forward. Such tax losses can be utilised against future tonnage taxation income and other in-come, which does not quality for tonnage taxation. The tax value of tax losses to be car-ried forward as of 31 December 2023 are in the region of EUR 13 million. The tax losses are not subject to expiration. No deferred tax asset in relation to the tax losses has been recognised as of 31 Decem-ber 2023 as they are not expected to be utilised within the foreseeable future (3-5 years). As at 31 December 2023, due to the business combination and the potential election to the UK tonnage tax, the Group had a gross unrecognised deferred tax asset balance of EUR 490.2 million. This balance is unrecognised at the UK corporate tax rate of 25% cre-ating a net balance of EUR 135.6 million. Deferred tax impact have been recognised to the extent these adjustments increase or reduce recognised deferred tax liabilities. Because of uncertainty related to future choices of tax regimes, e.g. a tonnage taxation regime or an income tax regime, or un-certainty on future earnings that can recover previous not recognised deferred tax as-sets or tax assets arising from other pro forma adjustments, no deferred tax assets have been recognised. Note 21 Deferred Income Taxes 146 |
|
147 EUR’000 No. of shares 2023 2022 2021 Ordinary shares Beginning and end of financial year 2021 138,574 26,575 18,641 18,641 Issued on May 2022 for capital increase 26,176 - 3,518 - Issued on October 2022 for capital in-crease 32,850 - 4,416 - Issued on December 2023 for capital in-crease 113,809 15,263 End of financial year 2023 311,409 41,838 26,575 18,641 As of 1 January 2023, the Group’s issued and paid in share capital amounted to DKK 197,600 thousand, equal to EUR 26,575 thousand, consisting of 197,600,000 shares of DKK 1. In June 2023, Cadeler and Eneti entered into a Business Combination Agreement, exe-cuted through a stock-for-stock exchange offer made to all stockholders of Eneti. In De-cember 2023, the share exchange offer was successfully completed and, consequently, the registration of the share capital increase. In December 2023, the authorised share capital was increased by DKK 113,809 thousand, equal to EUR 15,263 thousand, consisting of 113,809,868 shares of DKK 1. At the end of 2023, the Group had share capital amounting to DKK 311,409 thousand, equal to EUR 41,838 thousand, consisting of 311,409,868 shares of DKK 1. All shares have equal rights. Note 22 Issued Share Capital 147 |
|
148 Lease commitments The future lease payables under non-cancellable value and short-term leases contracted for at the balance sheet date but not recognised as liabilities, are as follows: The Company’s lease commitments include tenure of the new headquarters, which will reflect at the balance sheet in Q1 2024 under IFRS 16. The Company signed the contract with Castellum Denmark and will have access to almost 5,000 m2 of office space in cen-tral Copenhagen. The contract, with a six years biding period, amounted to EUR 8 million. The Company paid EUR 1 million as a deposit fee for this contract. Pledge of Fixed Assets The New Debt Facility detailed in Note 26 is secured by, inter alia, a first priority mort-gage over the Wind Orca, Wind Osprey, Wind Scylla and Wind Zaratan Vessels (EUR 511 million carrying value, see Note 18), first priority assignment of the earnings of the vessel owning entities, including certain change of control provisions which are similar to those included in the P-Class Facility. The P-Class facility is secured by a first priority mortgage over the P-Class newbuilds, first priority assignments of the insurances and earnings of the P-Class newbuilds by Cadeler and the two borrowers and contain customary financial and other covenants in-cluding certain change of control provisions. There will be a change of control under the P-Class Facility if any person or group of persons acting in concert (other than Swire Pa-cific and the BW Group) hold legally and beneficially more than 25% of each of the is-sued and outstanding share capital and/or the issued and outstanding voting share cap-ital of Cadeler A/S. In addition, a number of changes to the ownership structure further down in the Group will trigger a change of control such as, among others, if either Wind N1063 Limited or Wind N1064 Limited ceases to be a wholly owned (direct or indirect) subsidiary of Cadeler. The P-Class Facility will be governed by English law. Wind Osprey & Wind Orca new crane contract The Company signed a contract with NOV on 18 December 2020 to replace the main crane of Wind Orca and then executed the option to replace the main crane for Wind Os-prey on 17 June 2021. The total sum of the contract with NOV for the replacement of both cranes is EUR 83.4 million, of which EUR 7 million was paid in 2021, EUR 27 million was paid in 2022 and EUR 15.8 million was paid in 2023. The remaining scheduled payments will be due in 2024. P-Class vessels Since 30 June 2021 the Company has a contract with COSCO SHIPPING Heavy Industry CO. Ltd. (“COSCO”) to build two new P-class WTIVs. The total sum of the contract for the new vessels is approximately EUR 572 million, of which EUR 137 million was paid in 2021 and EUR 14 million was paid in 2023. The remaining scheduled payments will be due be-tween 2024 and 2025. Of the total contract, USD 390 million is paid in USD and EUR 220 million will is paid in EUR. Note 23 Commitments and Pledges EUR’000 2023 2022 2021 Not later than one year 1,090 53 18 Between one and five years 4,984 9 - 6,074 62 18 |
|
149 A-Class vessels On 9 May 2022 and 22 November 2022 the Company signed additional contracts with COSCO SHIPPING Heavy Industry to build a total of two new A-Class foundation installa-tion vessel. The total sum of the contracts for the new vessel is approximately EUR 657 million, of which approximately a total of EUR 167 million was paid in 2022, while the re-maining amounts will be due over the years from 2025 to 2026. Of the total contract, USD 495 million is paid in USD and EUR 205 million is paid in EUR. M-Class vessels The Company, due to the business combination with Eneti, is currently under contract with Hanwha for the construction of two next generation offshore WTIVs. The total sum of the contracts is approximately EUR 592 million, of which EUR 118 million has been paid. The remaining scheduled payments will be due between 2024 and 2025. Remaining instalments for the newbuilds vessels: Note 23 Commitments and Pledges Continued from previous page As of 31 December 2023 Millions P-Class M-Class A-Class Total Contract amount in EUR 220 - 205 425 Contract amount in USD 390 655 495 1,540 Total Contract amount translated to EUR 572 592 657 1,821 Commitment amount in EUR 69 - 105 174 Commitment amount in USD 390 524 426 1,340 Commitment amount translated to EUR 421 474 490 1,385 As of 31 December 2022 Millions P-Class A-Class Total Contract amount in EUR 220 205 425 Contract amount in USD 390 495 885 Total Contract amount translated to EUR 572 657 1,229 Commitment amount in EUR 82 105 187 Commitment amount in USD 390 426 816 Commitment amount translated to EUR 435 490 925 As of 31 December 2021 Millions P-Class Contract amount in EUR 220 Contract amount in USD 390 Total Contract amount translated to EUR 572 Commitment amount in EUR 82 Commitment amount in USD 390 Commitment amount translated to EUR 435 |
|
150 Financial risk factors The Group’s activities expose it to market risk (including currency risk and interest rate risk), credit risk and liquidity risk. The financial risk management of the Group is managed by the management of Cadeler and overseen by the Board of Directors and Audit Committee. The fair value of the Group's financial assets and liabilities as of 31 December 2023 does not deviate materi-ally to the carrying amounts as of 31 December 2023. Quantitative and Qualitative Disclosures about Market Risk Currency risk The Group’s business is exposed to the Danish Kroner (“DKK”), Norwegian Kroner (“NOK”), British pound sterling (“GBP”) and United States Dollar (“USD”) as certain operating ex-penses are denominated in these currencies. The Company will look to use financial in-struments to reduce currency risk when there is significant liability or income in a non-EUR or DKK denominated currency and there is a cost-effective solution. The largest currency exposure of the Group is the future instalments for the new P, A and M class vessels in USD (USD 1.3 billion), more details can be found in Note 25 with re-gards of the current instruments used to mitigate this currency risk. Management and Board of Directors will evaluate the potential cost and benefits of currency exposure on an ongoing basis. The Group holds cash balances in USD. If the USD:EUR exchange rate deteriorated by 10% the result before tax would have decreased by EUR 4.6 million (EUR 30 thousand in 2022; EUR 80 thousand in 2021) based on the USD cash holdings as at 31 December 2023. The Group holds cash balances in GBP. If the GBP:EUR exchange rate deteriorated by 10% the result before tax would have decreased by EUR 1.4 million based on the GBP cash holdings as at 31 December 2023. As the DKK is pegged to EUR, no material currency risk has been identified against the DKK even though the Cadeler Group has costs denominated in DKK. As of 31 December 2023, the Cadeler Group did not have any material NOK cash holdings. Interest rate risk Interest rate risk is the risk that the fair value or future cash flows of a financial instru-ment will fluctuate because of changes in market interest rates. The Group’s current ex-posure to the risk of changes in market interest rates relates primarily to the Revolving Credit Facility (RCF) which was taken out on the 1 July 2022 and refinanced on the 7 De-cember 2023, the New Debt facility, the P-Class facility, M-Class facility and Holdco facil-ity. More details can be found in Note 25 with regards of the current instruments used to mitigate this risk. The New Debt facility and Holdco facility are based on a EURIBOR interest rate plus a margin. The EURIBOR interest rate has a floor of 0bps and was 3.9% and 2.0% at the end of 2023 and 2022, respectively. If the EURIBOR interest rate increased 100bps over the floor of 0bps, and the loans had been provided throughout the entire period of 2023, the cost would have increased by EUR 2.1 million (EUR 1.5 million in 2022; EUR 715 thousand in 2021). This variation could potentially qualify as capitalisable borrowing costs and minimise the impact on the result before tax. If the interest rate decreases the result before tax would not change due to capitalisation of borrowing costs. Management and Board of Directors will evaluate the potential cost and benefits of fixed in-terested rate borrowings on an ongoing basis. Note 24 Financial Risk Management |
|
151 Credit risk Risk management Credit risk refers to the risk that counterparty will default on its contractual obligations resulting in financial loss to the Group. The Group adopts the following policy to mitigate credit risk. For banks and financial institutions, the Group mitigates its credit risks by transacting only with counterparties who are rated “A” and above by independent rating agencies. The Group adopts the policy of dealing only with customers of appropriate history and obtaining sufficient security where appropriate to mitigate credit risk. The Group adopts stringent procedures on extending credit terms to customers and on the monitoring of credit risk. These credit terms are normally contractual and credit policies spell out clearly the guidelines on extending credit to customers, including monitoring the process and using related industry’s practices as reference. This includes assessment and valuation of cus-tomers’ credit reliability and periodic review of their financial status to determine the credit limits to be granted. Customers are also assessed based on their historical pay-ment records. Where necessary, customers may also be requested to provide security or advance payment before services are rendered. Related party credit risk is managed by the Executive Management of Cadeler and over-seen by the Board of Directors. The maximum exposure to credit risk is the carrying amount of trade receivables and other receivables, receivables from group entities and cash and bank balances pre-sented on the balance sheet. Impairment of financial assets The Group assesses on a forward-looking basis the expected credit losses (“ECLs”) as-sociated with its financial assets which are trade and other receivables, cash and bank balances and contract assets. Financial assets are written-off when there is no reasona-ble expectation of recovery, such as a non-related debtor failing to engage in a repay-ment plan with the Group. Where receivables have been written-off, the Group continues to engage in enforcement activity to attempt to recover the receivables due. Where recoveries are made, these are recognised in profit or loss. The Group has applied the simplified credit loss approach by using the provision matrix to measure the lifetime expected credit losses for trade receivables from customers. To measure the expected credit losses, the Group grouped receivables based on shared credit characteristics and days past due. Trade receivables from external customers that are neither past due nor impaired are with creditworthy companies. Based on the provision matrix, the trade receivables from external customers are subject to immaterial credit loss. Refer to Note 14 for analysis of expected credit loss on trade receivables and contract assets. For cash and bank balances and other receivables that are measured at amortised cost, the Group has considered these financial assets as low credit risk. Cash and bank bal-ances are mainly deposits with banks who have high credit-ratings as determined by in-ternational credit-rating agencies. As at 31 December 2023, cash and bank balances and other receivables are subject to immaterial credit loss. There is no credit loss allowance for other financial asset at amortised cost as at 31 December 2023, 2022 and 2021. Note 24 Financial Risk Management Continued from previous page |
|
152 Liquidity risk The Group manages liquidity risk by maintaining sufficient cash and available funding through committed credit facilities to enable it to meet its operational requirements and instalments for the newbuilds vessels signed. Please refer to Note 26 – Financial Liabili-ties: Interest-bearing Loans and Borrowing for a detailed disclosure of the current facili-ties of the Group. The following maturity table shows the contract obligation for the construction of the newbuilds vessels: Millions Less than 1 year Between 1 and 2 years Between 2 and 5 years Total 2023 Obligation in USD 328 833 180 1,341 Obligation in USD (in EUR) 296 752 163 1,211 Obligation in EUR 69 99 6 174 Total obligations (in EUR) 365 851 169 1,385 2022 Obligation in USD - 197 619 816 Obligation in USD (in EUR) - 187 588 775 Obligation in EUR 13 69 105 187 Total obligations (in EUR) 13 256 693 962 The table above analyses the maturity profile of the financial liabilities of the Company based on contractual undiscounted cash flows excluding newbuild payments. Note 24 Financial Risk Management Continued from previous page EUR’000 Less than 1 year Between 1 and 2 years Between 2 and 5 years Total 2023 Trade and other payables 32,636 - - 32,636 Payables to Related parties 162 - - 162 Lease liabilities 601 392 - 993 Debt to credit institutions 799 - 204,773 205,572 Derivatives 4,004 5,683 12,274 21,961 38,202 6,075 217,047 261,324 2022 Trade and other payables 8,822 - - 8,822 Payables to Related parties 89 - - 89 Lease liabilities 279 - - 279 Debt to credit institutions 772 - 114,230 115,002 Derivatives - 1,821 287 2,108 9,962 1,821 114,517 126,300 2021 Trade and other payables 9,703 - - 9,703 Payables to Related parties 63 - - 63 Lease liabilities 298 209 - 507 Debt to credit institutions 28,599 14,476 30,000 73,075 38,663 14,685 30,000 83,348 |
|
153 Change in the debts to credit institu-tions during the year EUR’000 2023 2022 2021 Debt to credit institutions at 1 January (115,002) (73,075) (73,500) Overdraft facility drawn - (16,067) (8,998) Loans repayment 115,000 65,000 10,000 Overdraft repayment - 25,065 - New loan (211,934) (115,000) - New loan interests 8,262 1,541 - Write off of loan fees (1,898) (923) - Others - (1,543) (577) Debt to credit institutions at 31 December (205,572) (115,002) (73,075) Note 24 Financial Risk Management Continued from previous page EUR’000 Less than 1 year Between 1 and 2 years After 2 years Total Carrying amount 2023 Derivative financial instru-ments Interest rate swaps with a positive fair value - - - - - Interest rate swaps with a negative fair value 798 (3,166) (11,862) (14,229) (11,855) Gross settled foreign cur-rency contracts, pay leg (EUR) - (183,741) - (183,741) (5,338) Gross settled foreign cur-rency contracts, receive leg (USD) - 178,403 - 178,403 798 (8,504) (11,862) (19,567) (17,193) 2022 Derivative financial instru-ments Interest rate swaps with a positive fair value (305) 1,158 4,231 5,084 3,376 Interest rate swaps with a negative fair value - - (370) (370) (287) Gross settled foreign cur-rency contracts, pay leg (EUR) - (183,741) - (183,741) (1,821) Gross settled foreign cur-rency contracts, receive leg (USD) - 181,921 - 181,921 (305) (662) 3,861 2,894 1,268 EUR’000 2023 2022 2021 Lease liabilities at 1 January (current and non-current lease) 279 507 792 Acquisition of subsidiaries 1,299 - - Exchange differences (16) - - Cash paid for lease obligations (569) (228) (285) Lease liabilities at 31 December (current and non-current lease) 993 279 507 Current 392 - 209 Non-current 601 279 298 |
|
154 Capital management The Company’s objectives when managing capital are to ensure the Company’s ability to continue as a going concern and to maintain an optimal capital structure. In order to achieve this overall objective, the Company’s capital management, among other things, aims to ensure that it meets financial covenants attached to the interest-bearing loans and borrowings that define capital structure requirements. Breaches in meeting the financial covenants would permit the bank to immediately call loans and borrowings. There have been no breaches of the financial covenants of any interest-bearing loans and borrowing in the current period. In order to maintain or adjust the capital structure in the future, the Group may adjust the amount of dividends paid to shareholders, issue new shares and/or sell assets to reduce debt. Pursuant to the RCF, the Company is not permitted to pay any dividends or other distributions without DNB Bank ASA’s written consent. Fair value measurement The Group measures financial instruments such as derivatives at fair value at each bal-ance sheet date. Fair value is the price that would be received to sell an asset or paid to transfer a liability in an orderly transaction between market participants at the balance sheet date. The principal or the most advantageous market must be accessible by the Group. The fair value of an asset or a liability is measured using the assumptions that market partici-pants would use when pricing the asset or liability, assuming that market participants act in their economic best interest. In measuring the fair value of unlisted derivative financial instruments and other financial instruments for which there is no active market, fair value is determined using generally accepted valuation techniques. Market-based parameters such as market-based yield curves and forward exchange prices are used for the valuation. The Group uses valuation techniques that are appropriate in the circumstances and for which sufficient data is available to measure fair value, maximizing the use of relevant observable inputs and minimizing the use of unobservable inputs. Financial instruments for which fair value is measured or disclosed in the financial state-ments are categorised within the fair value hierarchy, described as following accounting hierarchy: Level 1: The fair value of financial instruments traded in active markets (such as publicly traded derivatives, and equity securities) is based on quoted market prices at the end of the reporting period. The quoted market price used for financial assets held by the Group is the current bid price. These instruments are included in level 1. Level 2: The fair value of financial instruments that are not traded in an active market (e.g. over-the counter derivatives) is determined using valuation techniques that maximise the use of observable market data and rely as little as possible on entity-specific estimates. Valuation techniques applied are primarily based on marked-based inputs of the instru-ments. If all significant inputs required to fair value an instrument are observable, the in-strument is included in level 2. Level 3: If one or more of the significant inputs is not based on observable market data, the instrument is included in level 3. The table below shows the fair value measurement hierarchy of the Group’s assets and liabilities: Note 24 Financial Risk Management Continued from previous page |
|
155 EUR’000 Level 1 Level 2 Level 3 Total 2023 Through the consolidated statement of profit and loss Derivative assets - - - - Total financial assets at fair value through the consolidated statement of profit and loss - - - - Derivative liabilities - (403) - (403) Total financial liabilities at fair value through the consolidated statement of profit and loss - (403) - (403) Cash flow hedges: Derivative assets - 338 - 338 Derivative liabilities - (17,937) - (17,937) 2022 Through the consolidated statement of profit and loss Derivative assets - 363 - 363 Total financial assets at fair value through the consolidated statement of profit and loss - 363 - 363 Derivative liabilities - - - - Total financial liabilities at fair value through the consolidated statement of profit and loss - - - - Cash flow hedges: Derivative assets - 3,013 - 3,013 Derivative liabilities - (2,108) - (2,108) Note 24 Financial Risk Management Continued from previous page |
|
156 Hedge accounting The Group uses forward exchange contracts, including options (collars), and interest rate swap contracts to hedge currency risks and interest risk regarding highly probable future cash flows and designates them as cash flow hedges subject to meeting the criteria for application of cash flow hedging. The hedging ratios are determined as the notional value of the instrument divided by the notional value of the hedge item. The Group seeks to establish hedge relationships with a hedging ratio of 1:1. Due to the nature of the hedge items risk, this will be possible by either designating a proportion of the hedge instrument or the hedge notional value be-ing equal or lower of the hedge items notional value. The main score of ineffectiveness arises from the timing of the delivery of the vessels. The delivery of the vessels will ex-pose the Group to several market risks, related to foreign currency risks and interest rate risk. The fair value adjustment of the derivatives is recognised in other comprehensive income until the hedged items are realised. The table below shows the movement in the reserve for cash flow for hedging, listed by the hedged risk. EUR'000 2023 2022 Fair Value change of Cash flow hedges Cumulative fair value change at 1 January 1,343 - Fair value adjustment at year-end, net (18,505) 905 Interest recycled at year-end, net (776) 438 Time value adjustment at year-end, net (3,621) - Cumulative fair value change at 31 December (21,559) 1,343 The fair value of cash flow hedges at 31 December can be speci-fied as follows: Interest rate risk hedging (11,790) 3,163 Foreign currency risk hedging (6,148) (1,820) Foreign currency risk hedging - time value (3,621) - Cumulative fair value change at 31 December (21,559) 1,343 Note 25 Derivative Financial Instruments |
|
157 Interest rate risk In 2022 the Group entered into a Senior Secured Green EURIBOR based revolving credit facility (RCF) with a 0 bps floor which led the Group to be exposed to changes in the 3M EURIBOR rate with respect of their current funding. Further the group obtained an indic-ative term sheet for the financing of the P-class vessels acquired from COSCO SHIP-PING Heavy Industry and planned to be delivered in the period of 2024 to 2025. The group intended to enter these loans as the main source of future funding and considered the risk of changes to EURIBOR based interest payments in 2022 and coming years. On 5 October 2022, the Group entered into interest rate swap contracts with DNB which relate to the Debt Facility and future loans thereunder. The interest rate risk arising from the loans under the Debt Facility have been swapped from 3-month EURIBOR to a fixed rate until 5 October 2027. The average fixed rate of the swaps is 2.81% (2022: 2.82%). Such interest rate swap contracts have been replaced by new contracts in connection with the New Debt Facility. In connection with the Business Combination, on 7 December 2023 the Group entered into the New Debt Facility, a new senior secured credit and guarantee facility of up to EUR 550 million. The New Debt Facility has similar terms and conditions as the Debt Fa-cility. Further, on 23 December 2023, the Group entered into a Sinosure-backed green term loan facility (EUR 425 million). The Group entered these loans as the main source to fi-nance the purchase of the P-Class newbuilds. The Group entered into interest rate swap contracts with the Group’s main bank and re-lated these to the New Debt Facility and the future loans. The interest rate risk arising from the loans have been partially swapped from 3M EURIBOR to a fixed rate. The new credit facilities expand the exposure of the Group to changes in the 3M EURIBOR rate. The economic relationship is established as a match of critical terms between the hedge item and hedge instrument. The group has assessed the following terms when entered into the hedge relationship: – Instalments on the facilities. – Payment date of interest and instalment. – Timing difference in the maturity of the hedge item and hedge instrument. The expected causes of hedging ineffectiveness relate to: – Changes to the expected date of delivery of the vessels. – 3M EURIBOR rate falling below 0%. Note 25 Derivative Financial Instruments Continued from previous page |
|
158 The below table shows the profile of the nominal amount of the interest rate swaps and the fair values. Fair value EUR’000 Notional amount EUR’000 Less than 1 year Between 1 and 2 years Between 2 and 5 years Asset Liability 2023 Interest rate Swap – EURI-BOR 3M - - 555,000 - (11,790) 2022 Interest rate Swap – EURI-BOR 3M - - 469,375 3,451 (288) More details can be found in Note 26 with regards of the current debt facilities of the Group related to the interest rate swaps. EUR'000 2023 2022 Movements in the hedging reserve Beginning of year 3,163 - Fair value adjustment for the year (14,177) 2,725 Interest recycled for the year (776) 438 End of year (11,790) 3,163 Note 25 Derivative Financial Instruments Continued from previous page |
|
159 Foreign currency risk hedging In 2021, the Group entered into a binding contract for the construction of two P-class vessels from COSCO. The contracts are partly settled in USD. USD payments will be due in 2024 and 2025. The currency exposure arising from the contracts has been swapped to EUR at the Com-pany’s banks at an average USD:EUR rate of 0.9187 for both 2023 and 2022. In 2022, the Company signed additional contracts with COSCO SHIPPING Heavy Industry to build a total of two new A-class foundation installation vessel. The Company is ex-posed to change in foreign exchange currency risk on their contractual obligation to ac-quire the A-class vessels due to the last instalment being in USD. The last instalment shall be payable upon delivery of the vessel. The exposure to the variability in the future currency rate has been hedged by entering into six zero cost collar contracts with DNB, securing an average USD:EUR rate of be-tween 0.8695 and 0.9466 for USD 300 million of notional amount, bringing the total cov-erage to USD 500 million. As of 31 December 2023, the total coverage effectively miti-gates around 50% of its foreign exchange risk for the upcoming USD instalments for the new P- and A-class vessels contracts. The economic relationship is established as a match of critical terms between the hedge item and hedge instrument. The Group has assessed the following terms when entered the hedge relationship: – Payment date of instalment in foreign currency. – Maturity of the hedged item and hedged instruments (forward contract and op-tion collars). The expected causes of hedging ineffectiveness relate to changes to the expected date of delivery of the vessel. The below table shows the profile of the nominal amount of the foreign currency forward contracts and option collars and the fair values. Fair value EUR’000 Notional amount USD’000 Less than 1 year Between 1 and 2 years Between 2 and 5 years Asset Liability 2023 FX forward contracts 150,000 50,000 - - (5,338) Option collars - 250,000 50,000 - (4,431) 2022 FX forward contracts - 200,000 - - (1,820) Option collars - - - - - EUR'000 2023 2022 Movements in the hedging reserve Beginning of year (1,820) - Fair value adjustment for the year - FX forward contracts (3,518) (1,820) Fair value adjustment for the year - Option collars (810) - Time value adjustment for the year (3,621) - End of year (9,769) (1,820) Note 25 Derivative Financial Instruments Continued from previous page |
|
160 New Debt Facility – replacing the RCF On 29 June 2022 the Company entered into a Senior Secured Green Revolving Credit Fa-cility (“RCF”) of a 3-year term loan of EUR 185 million with DNB Bank ASA. The RCF consists of (i) a three-year non-amortizing term loan of EUR 150 million, in addi-tion to voluntary prepayments in whole or any part of the loan, at any time, the loan will be repayable in a balloon payment of EUR 150 million, and (ii) a guarantee facility of up to EUR 35 million. On 4 July 2022 the Company utilised EUR 115 million from the total EUR 150 million availa-ble from the RCF. With these funds the Group repaid in full the outstanding amounts, re-lated to the term loan EUR 55 million and overdraft facility EUR 25 million from DNB Bank ASA and SpareBank 1 SR-Bank signed on 4 November 2020. At that time, the new RCF added about EUR 70 million in liquidity. The RCF bears interest at 3-month or 6-month EURIBOR + the Applicable Margin, and subject to a green loan margin discount as long as the Company is in compliance with certain green asset criteria such as earmarked investments in green assets. The Group is currently in compliance with this green criteria and are expected to remain compliant for the duration of the facility. The full repayment of a senior debt facility generated a fi-nance cost for the write-off of borrowing costs of approximately EUR 810,000 in July 2022. Due to a confidentiality agreement, the applicable margin cannot be disclosed. In June 2023, the Debt Facility was amended to increase the guarantee facility to EUR 60 million and to increase the committed revolving credit facility to EUR 250 million, result-ing in an increase of the aggregate Debt Facility to EUR 310 million. The above was re-financed and the Group entered into the new RCF, as explained below. In connection with the Business Combination, the Company on 7 December 2023 en-tered into a new senior secured credit and guarantee facilities of up to EUR 550 million providing for (i) a revolving credit facility of up to EUR 250 million (5 year tenor), (ii) a re-volving credit facility of up to EUR 100 million (18 months tenor), (iii) a term loan of up to EUR 100 million (8.5 year tenor) guaranteed by The Danish Export and Investment Fund of Denmark (EIFO) and (iv) an uncommitted guarantee facility of up to EUR 100 million (the “New Debt Facility”). The New Debt Facility has similar terms and conditions as the existing Debt Facility. The change of control provisions are similar to those included in the P-Class Facility (as described below). The Company has utilised EUR 162 million from the total EUR 450 million available from the RCF. With these funds the Group repaid the outstanding amounts of Eneti’s previous Credit Facility, which amounted to USD 59.4 million (of which Eneti repaid USD 12.6 mil-lion in October 2023 from the proceeds from the sale of Seajacks Hydra, Seajacks Levia-than and the Seajacks Kraken). In addition, the Group has repaid the amounts under its own Debt Facility amounting to EUR 115 million. The full repayment of the senior debt facility generated a finance cost for the write off of borrowing costs of approximately EUR 1.8 million thousand in 2023. By the end of the reporting period, EUR 288 million remains unutilised from the RCF. Note 26 Financial Liabilities: Interest-bearing Loans and Borrowings |
|
161 Holdco Facility (EUR 5O million) On 15 November 2023, the Group entered into an unsecured Holdco Facility in an aggre-gate amount of EUR 50 million (tenor of five years) with HSBC. The financing includes a non-committed accordion option of up to EUR 50 million. The purpose of the Holdco Fa-cility is, among others, partial funding of the wind installation activities of the Group and general corporate purposes. The facility includes customary financial and other cove-nants. M-Class Facility (USD 436 million) In connection with the Business Combination, the Group acquired a senior secured green term loan facility, which Eneti entered in November 2023, of up to USD 436 million (the “New Credit Facility”) with a group of international banks and export credit agencies co-arranged and co-underwritten by Crédit Agricole Corporate and Investment Bank and Société Générale, and with Société Générale as Green Loan Coordinator. The New Credit Facility finances approximately 65% of the purchase cost of the M-Class newbuilding, with the remaining 35% to be funded either by obtaining additional bank financing or through available operational cash reserves. The maturity date of the New Credit Facility in relation to each vessel is 12 years from the delivery date of each vessel. The New Credit Facility bears interest at a blended margin of SOFR plus 2.36% per annum (exclu-sive of premiums payable to K-SURE and Eksfin). However, the terms of the New Credit Facility provided that completion of the Business Combination would not trigger a change of control provision with regard to cancellation and prepayment of the New Credit Facility. P-Class Facility (USD 425 million) Further, Cadeler A/S and two of its subsidiaries, WIND N1064 Limited and WIND N1063 Limited, entered into a Sinosure-backed green term loan facility of up to EUR 425 million (12 year tenor) (the "P-Class Facility") in December 2023 to finance the purchase of P-Class newbuilds. The funds under the P-Class Facility have been borrowed by WIND N1064 Limited and WIND N1063 Limited (the future owners of the P-Class newbuilds) and may not be reborrowed once repaid. Further financing will be required from 2025 in con-nection with milestone payments for the A-Class New Builds. The Cadeler Group’s man-agement expects to require approximately EUR 450 million of additional funding for the A-Class New Builds. Cadeler currently has a letter of intent in place for the order of one additional A-Class New Build. There can be no guarantee that the financing of such new builds and any future upgrades can be obtained on attractive terms or at all. Covenants The Group is in compliance with all covenants in the New Debt Facility (RCF): - Minimum Free Liquidity: Freely available cash and cash equivalents at of i) the higher of EUR 35.000.000 or 5% of gross interest bearing debt, if the ratio of for-ward-looking contract cash flow to net interest bearing debt are above 50% or ii) EUR 50,000,000 or an amount equal to 7.5% of the gross interest bearing debt at all other times. - Equity Ratio: The ratio of book equity to total assets at all times to be minimum 35%. - Working capital: the working capital shall be higher than zero (0). Note 26 Financial Liabilities: Interest-bearing Loans and Borrowings Continued from previous page |
|
162 - Fair market value of vessels: The fair market value of the vessels shall at all times cover at least 150% of the gross interest bearing debt following the redelivery of the O-Class vessels. - Contracted cash flows: If at any reported quarter the aggregated loans exceed 80% the forward-looking expected cash revenues from legally binding contracts, the Contracted Cash Flows, the Borrower shall prepay the exceeding part of the Loans within five (5) Business Days. - Utilisation of RCF’s Facility under New Debt Facility must be above the outstand-ing on ECA Term Loan tranche. Further, the Group is in compliance with some additional covenants specified in the Holdco Facility: - Fair market value of vessels: The fair market value of the vessels shall at all times cover at least 140% of the gross interest bearing debt. - Debt service coverage ratio: Cash flow available for debt service (including avail-able liquidity covering cash, cash equivalent and undrawn New Debt Facility) at the Parent Company must be above Debt service cash flow related to the Holdco Facility (2:1). As of the reported date, the P-Class and M-Class facilities remain unutilised. Given their non-utilisation, no assessment of compliance with associated covenants has been nec-essary up to this point. These covenants, if applicable, will require assessment upon utili-sation of the facilities and contain customary financial and other covenants, including certain change of control provisions, similar to those disclosed for the utilised facilities. Additionally, the Group is in compliance with below requirements: Restriction on dividends: the Company is not permitted to pay any dividends or other distributions without DNB Bank ASA’s written consent. For the New Debt Facility, divi-dends and distributions should not exceed 50% of the consolidated net profit for the re-spective year. Further, in the Holdco Facility, the Company is not allowed to any distribu-tions before the delivery of the P-Class, A-Class and M-Class. Change of control: If any person or group of persons (other than Swire Pacific or the BW Group) acting in concert directly or indirectly gains control of 25% or more of the voting and/or ordinary shares of the Borrower, the Agent (acting on instructions from the major-ity lenders) may by written notice of sixty (60) days cancel the total commitments and demand prepayment of all amounts outstanding under the facilities. Note 26 Financial Liabilities: Interest-bearing Loans and Borrowings Continued from previous page |
|
163 As of 31 December 2023 Committed (EUR millions)¹ Related derivatives contracts Interest rate Maturity Utilised Unused Average IRS rate IRS nominal (EUR millions) Secured New Debt Facility (RCF) 3 months EURIBOR + 2.4% 2031 162 288 2.7% 150 New Debt Facility - Guarantee 0.80% - 1.20% 2026 45 55 Total New Debt Facility 207 343 P-Class Facility 3 months EURIBOR + (0.90% - 2.4%) 2035 425 3.0% 203 M-Class Facility (USD 436 million) SOFR + 2.4% 2035 394 Unsecured HoldCo Facility 3 months EURIBOR + 4% 2028 50 - Total (excluding Guarantee facility) 212 1,107 Note 26 Financial Liabilities: Interest-bearing Loans and Borrowings Continued from previous page 1 As of 31 December 2022, Debt Facility (RCF) amounted to EUR 150 million of which EUR 115 million were utilised. |
|
164 Group’s Related Party Transactions Members of the Cadeler Board, Cadeler’s executive management and Cadeler’s major shareholder, BW Altor Pte. Ltd. (“BW Altor”), are considered related parties as they are ei-ther members of the Cadeler Board or executive management of Cadeler or exercise significant influence over Cadeler and the Cadeler Group’s operations. For the financial years 2022 and 2021, Swire Pacific Limited (“Swire Pacific”) was considered a related party given its ownership of more than 5% in Cadeler, but for accounting purposes, with effect from 1 January 2023, Swire Pacific is no longer considered a related party under IFRS due to its reduced ownership percentage and the fact that it is no longer repre-sented on the Cadeler Board. In addition, Scorpio Holdings Limited (“Scorpio Holdings”) is considered a related party given its current ownership of more than 5% in Cadeler. Re-lated parties also include such persons’ close family members, undertakings in which such persons have significant interests as well as other affiliates. As of December 2023, BW Altor owns 19.57% of the Cadeler shares, Scorpio Holdings Limited owns 12.09% of the Cadeler shares and Swire Pacific owns 8.51% of the Cadeler Shares. For the financial years ended 31 December 2023, 2022 and 2021, there were no material transactions between Cadeler or any company of the Cadeler Group and BW Al-tor, Scorpio Holdings and/or Swire Pacific (or their respective affiliates) other than the transactions described below. Share lending agreement with BW Altor In October 2022, Cadeler entered into a share lending agreement with BW Altor as the share lender for the purpose of facilitating delivery versus payment settlement of the Cadeler’s shares to be delivered to investors in connection with a private placement that took place in October 2022. As compensation for such share lending, BW Altor received a customary fee paid by Cadeler until the Cadeler Shares were redelivered and admitted to trading on the OSE. The amount paid to BW Altor pursuant to such share lending agreement amounted to EUR 85,000. Guarantees provided by BW Group BW Group has provided COSCO with four guarantees in respect of the sums payable by Cadeler in accordance with the contract for the construction of certain newbuilt P-class and A-Class WTIVs in 2021, 2022 and 2023. Under this guarantee arrangement, certain fees are payable by the Group to BW Group until the guarantees are discharged in full. Bunker supply from Hafnia Pools (affiliate of BW Group) In April 2022, Hafnia Pools Pte Ltd, which is an affiliate of BW Group, and Cadeler en-tered into a service level agreement pursuant to which Hafnia Pools Pte Ltd agreed to supply marine bunker oil and related products to Cadeler’s vessels in the port of Rotter-dam and other ports in the Rotterdam area at market rates. The agreement includes standard terms and conditions, including related to late payments, termination, a cap on the liability of Hafnia Pools Pte Ltd and indemnification for third-party claims raised by suppliers of the fuel against Hafnia Pools Pte Ltd. Performance guarantees issued by Swire Offshore Holdings Group During the course of 2020, Swire Pacific Offshore Holdings Limited, through its subsidi-ary Swire Pacific Offshore Operations Pte. Ltd., issued four performance guarantees and four bank guarantees in favour of the Cadeler Group’s customers as security for perfor-mance of the Cadeler Group’s obligations under its customers’ contracts. These guaran-tees covered a period up until April 2022. Following the sale of Swire Pacific Offshore Holdings Limited by Swire Pacific in April 2022, Swire Pacific Offshore Holdings Limited is no longer considered to be a related party as it is no longer controlled by a significant shareholder of Cadeler, and the Cadeler Group put new performance guarantees in place. Note 27 Related Party Transactions |
|
165 In connection with the guarantees provided by Swire Pacific Offshore Holdings Limited, Cadeler entered into a deed of recourse with Swire Pacific Offshore Operations Pte Ltd., which has since terminated, pursuant to which: • Cadeler had an obligation to indemnify Swire Pacific Offshore Operations Pte Ltd. for any liabilities incurred by Swire Pacific Offshore Operations Pte Ltd. in performing its ob-ligations under the performance guarantees or in respect of any payments made under the bank guarantees; and • Cadeler had an obligation to pay Swire Pacific Offshore Operations Pte Ltd. an arm’s length fee for each guarantee issued and procured respectively by Swire Pacific Off-shore Operations Pte Ltd. in favour of Cadeler’s customers. Crewing agreement In 2014, Cadeler entered into a crewing agreement with Swire Pacific Ship Management LTD(Singapore branch) (“SPSM”), which at that time was a related company to Swire Pa-cific Offshore Operations Pte Ltd, Cadeler’s sole shareholder at that time. Pursuant to this agreement, SPSM agreed to provide a crew for Cadeler’s two vessels in accordance with the standard terms set out in a BIMCO crewman agreement. The crew management fee was 2% of the monthly manning costs, and severance costs amounted to USD 20,000. This agreement was subsequently terminated in November 2021 when Cadeler decided to employ its own crew directly. As part of the termination agreement, the parties agreed that the termination is without prejudice to any claims, liabilities or obligations that may have accrued prior to the date of termination. The expenses set out in the table below with respect to this crewing agreement for the financial year ended 31 December 2021 related to the period prior to the effective date of such termination. Transitional Service Agreement entered into in connection with Cadeler’s listing on the OSE In October 2020, Cadeler entered into a transitional service agreement with Swire Pacific Offshore Operations Pte Ltd regarding services to be rendered to Cadeler during a tran-sitional period following the initial public offering and admission to trading of the Cadeler shares on the OSE. Such services included, inter alia, assistance with financial reporting, tax, insurance, internal audit, IT, HR, procurement, technical and HSEQ support and ser-vices. The term of the agreement was limited to one year and could be terminated by ei-ther party at any time with three months’ prior written notice. The agreement terminated in accordance with its terms in October 2021. Training courses provided by BW Maritime BW Maritime has provided training courses for Cadeler’s onshore staff and traveling costs reimbursements for board members Administrative support provided by Scorpio Services Holding The Group, due to the business combination with Eneti, holds an agreement with Scorpio Services Holding (“SSH”) for the provision of administrative staff, office space and ac-counting, legal compliance, financial and information technology services for which it is due to reimburse to SSH the direct and indirect expenses incurred while providing such services. Ultramax and Kamsarmax pools Through the business combination the Company acquired receivables positions from Eneti transactions to Scorpio Group related parties for commercial management ser-vices. These services involved securing employment for Eneti’s drybulk vessels in the spot market or on time charters. Please refer to the table under Scorpio Ultramax Pool and the Scorpio Kamsarmax Pool for details. The pools are owned by Scorpio Holdings which is considered a related party. Note 27 Related Party Transactions Continued from previous page |
|
166 The following significant transactions took place between the Company and related par-ties within the BW Group and Swire Pacific Offshore Holdings Group at terms agreed be-tween the parties: EUR’000 2023 2022 2021 Sales and purchases of goods and services Costs related to guarantees fees to BW Group Limited (7,576) (5,307) (1,853) Costs related to bunker supply to Hafnia Pools Pte Ltd (Member of BW Group) (1,597) (2,537) - Cost related to training courses to BW Maritime Pte. Ltd (26) - - Cost related to administrative expenses to Scorpio Services Holding (17) - - Cost related to share lending fees to BW Altor Pte. Ltd. - (85) - Cost related to travel expenses for board meetings to BW Maritime Pte. Ltd - (3) - Costs related to performance guarantees to Swire Pa-cific Offshore Holdings Group - (157) (684) Crew hire expenses paid to the Swire Pacific Offshore Holdings Group - (115) (11,461) Receivables from Scorpio Kamsarmax Pools at re-ported period 136 - - Receivables from Ultramax Pools at reported period 456 - - Payables to Hafnia Pools Pte Ltd at reported period - 1 - Management fees paid to the Swire Pacific Offshore Holdings Group - - (197) Payables to Swire Pacific Offshore Holdings Group at reported period - - 63 EUR’000 2023 2022 2021 Payables to Scorpio Commercial Management at re-ported period 4 - - Payables to Scorpio Service Management at reported period 6 - - Payables to Scorpio Services Holding at reported pe-riod 141 - - Payables to Scorpio UK at reported period 1 - - Payables to BW Altor Pte. Ltd. at reported period - 85 - Payables to BW Maritime Pte. Ltd at reported period 10 3 - Related party transactions over the reported period are primarily linked to guarantee fees issued by the BW Group Limited, bunker supply by Hafnia Pools (member of the BW Group), costs related to training expenses by the BW Maritime and administrative ex-penses to Scorpio Services Holding. In addition, Cadeler has not had significant transactions with the members of the Cadeler Board and the executive management apart from remuneration and expenses. Cadeler has not provided or granted any loans or guarantees to its directors or executive management. For information on remuneration paid to members of the Cadeler Board and executive management, refer to Note 9. Note 27 Related Party Transactions Continued from previous page |
|
167 The consolidated financial statements of the Group include the following subsidiaries, which are fully owned by the Parent Company: Note 28 Group Information Entities Country Investment holding entities (continuation) Atlantis Equityco Ltd UK Atlantis Midco Ltd UK Seajacks International Ltd UK Dormant entities Seajacks 2 Ltd UK Seajacks 3 Ltd UK Scorpio SALT LLC USA Bulk Run-Off Company Ltd Marshall Islands Crawford Path LLC Delaware Windpower Alpha Ltd Marshall Islands Windpower Bravo Ltd Marshall Islands Seajacks 7 Limited UK Seajacks 8 Limited UK SBI Achilles Shipping Company Ltd Marshall Islands SBI Antares Shipping Company Ltd Marshall Islands SBI Apollo Shipping Company Ltd Marshall Islands SBI Aries Shipping Company Ltd Marshall Islands SBI Athena Shipping Company Ltd Marshall Islands SBI Bolero Shipping Company Ltd Marshall Islands Entities Country Vessel owning entities Wind Orca Ltd Cyprus Wind Osprey Ltd Cyprus Wind N1063 Ltd Cyprus Wind N1064 Ltd Cyprus Seajacks 1 Ltd UK Seajacks 4 Ltd UK Seajacks 5 Ltd UK Seajacks 3 Japan LLC Japan Trading and Operations Seajacks UK Ltd UK Seajacks UK Ltd Taiwan Branch Taiwan Seajacks US Inc. USA Seajacks Merman Marine Ltd Bermuda Seajacks Crewing Services Ltd UK Seajacks Japan LLC Japan Investment holding entities Wind MI Ltd Marshall Islands Eneti (Bermuda) Ltd Bermuda Atlantis Investorco Ltd UK |
|
168 Note 28 Group Information Continued from previous page Entities Country Dormant entities (continuation) SBI Bravo Shipping Company Ltd Marshall Islands SBI Capoeira Shipping Company Ltd Marshall Islands SBI Carioca Shipping Company Ltd Marshall Islands SBI Chartering and Trading Ltd Marshall Islands SBI Conga Shipping Company Ltd Marshall Islands SBI Cougar Shipping Company Ltd Marshall Islands SBI Cronos Shipping Company Ltd Marshall Islands SBI Echo Shipping Company Ltd Marshall Islands SBI Gemini Shipping Company Ltd Marshall Islands SBI Hera Shipping Company Ltd Marshall Islands SBI Hercules Shipping Company Ltd Marshall Islands SBI Hermes Shipping Company Ltd Marshall Islands SBI Hydra Shipping Company Ltd Marshall Islands SBI Hyperion Shipping Company Ltd Marshall Islands SBI Jaguar Shipping Company Ltd Marshall Islands SBI Jive Shipping Company Ltd Marshall Islands SBI Lambada Shipping Company Ltd Marshall Islands SBI Leo Shipping Company Ltd Marshall Islands SBI Libra Shipping Company Ltd Marshall Islands Entities Country Dormant entities (continuation) SBI Lynx Shipping Company Ltd Marshall Islands SBI Lyra Shipping Company Ltd Marshall Islands SBI Macarena Shipping Company Ltd Marshall Islands SBI Maia Shipping Company Ltd Marshall Islands SBI Mazurka Shipping Company Ltd Marshall Islands SBI Orion Shipping Company Ltd Marshall Islands SBI Parapara Shipping Company Ltd Marshall Islands SBI Pegasus Shipping Company Ltd Marshall Islands SBI Perseus Shipping Company Ltd Marshall Islands SBI Phoebe Shipping Company Ltd Marshall Islands SBI Phoenix Shipping Company Ltd Marshall Islands SBI Pisces Shipping Company Ltd Marshall Islands SBI Poseidon Shipping Company Ltd Marshall Islands SBI Reggae Shipping Company Ltd Marshall Islands SBI Rock Shipping Company Ltd Marshall Islands SBI Rumba Shipping Company Ltd Marshall Islands SBI Samba Shipping Company Ltd Marshall Islands SBI Samson Shipping Company Ltd Marshall Islands SBI Sousta Shipping Company Ltd Marshall Islands |
|
169 Note 28 Group Information Continued from previous page 169 Entities Country Dormant entities (continuation) SBI Subaru Shipping Company Ltd Marshall Islands SBI Swing Shipping Company Ltd Marshall Islands SBI Tango Shipping Company Ltd Marshall Islands SBI Taurus Shipping Company Ltd Marshall Islands SBI Tethys Shipping Company Ltd Marshall Islands SBI Thalia Shipping Company Ltd Marshall Islands SBI Ursa Shipping Company Ltd Marshall Islands SBI Virgo Shipping Company Ltd Marshall Islands SBI Zeus Shipping Company Ltd Marshall Islands SBI Zumba Shipping Company Ltd Marshall Islands |
|
170 Increased funding commitment On 7 February 2024, the Group has secured additional capital, increasing the Holdco Fa-cility from EUR 50 million to EUR 80 million. The purpose of the Holdco Facility is, among others, partial funding of the wind installation activities of the Group and general corpo-rate purposes. Private placement The Company conducted a successful private placement, which was completed on 15 February 2024, resulting in the issuance of 39.5 million shares at a price of NOK 44.50 per share. Overall, the Company raised approximately EUR 154 million (USD 166 million) be-fore transaction costs. The proceeds from the private placement will fund two main ob-jectives. Firstly, they will fully finance the equity portion of Cadeler's planned third A-Class Wind Foundation Installation Vessel newbuild, accounting for approximately 35% of its total expected vessel cost. Secondly, the funds will be allocated towards acquiring mission equipment and building working capital. This will enable Cadeler to capitalise on selected near-term commercial opportunities, including utilising turbine installation ves-sels for T&I foundation scopes, accelerating the realisation of commercial synergies, and seizing other opportunities resulting from supply chain bottlenecks and project delays in the coming years. Increased funding utilisation On 22 March 2024, the Group utilised EUR 50 million of the EUR 100 million term loan available from the New Debt Facility, as the Wind Orca main crane upgrade nears com-pletion. Additionally, the Group is in the process of requesting the utilisation of the re-maining EUR 50 million. This utilisation is related to the Wind Osprey main crane up-grade, also in its final stages. These financial statements were authorised for issue in accordance with a resolution of the Board of Directors and Executive Management of Cadeler A/S on 26 March 2024 and will be recommend for approval by the shareholders of the Company at the annual general meeting to be held on 23 April 2024. Note 29 Events After Reporting Period Note 30 Authorisation of Financial Statements |
|
171 Parent Company Financial Statements |
|
172 EUR’000 Note 2023 2022 2021 Revenue 2 108,810 108,443 62,849 Cost of sales 3 (57,077) (60,269) (51,134) Gross profit 51,733 48,174 11,715 Administrative expenses 3 (33,666) (15,291) (10,962) Operating profit 18,067 32,883 753 Finance income 1,362 4,031 1,784 Finance costs (8,081) (9,660) (5,461) Profit/(loss) before income tax 11,348 27,254 (2,924) Income tax credit/expense 5 - - 13 Profit/(loss) for the year 11,348 27,254 (2,911) Parent Company Statement of Profit and Loss |
|
173 EUR’000 Note 2023 2022 2021 Assets Non-current assets Intangible assets 7 240 419 402 Property, plant and equipment 8 369,154 321,055 139,912 Financial assets Investments in subsidiaries 9 745,489 249,534 249,534 Leasehold deposits 1,220 238 195 Derivatives 11 338 3,376 - Total financial assets 747,047 253,148 249,729 Total non-current assets 1,116,441 574,622 390,043 EUR’000 Note 2023 2022 2021 Current assets Inventories 1,836 549 440 Receivables Trade receivables 35,227 38,234 20,373 Receivables from subsidiaries 91,510 89,533 36,301 Current Income tax receivable 12 12 - Other current assets 5,212 708 649 Total receivables 131,961 128,487 57,323 Cash and bank balances 59,436 19,012 2,308 Total current assets 193,233 148,048 60,071 Total assets 1,309,674 722,670 450,114 Parent Company Balance Sheet |
|
174 EUR’000 Note 2023 2022 2021 Equity Share capital 14 41,839 26,575 18,641 Share premium 952,858 509,542 339,400 Reserves (17,938) 1,343 (Accumulated losses)/retained earnings (23,968) (12,831) (40,437) Total equity 952,791 524,629 317,604 Liabilities Non-current liabilities Debt to credit institutions 12 204,773 114,230 44,476 Deferred charter hire income 1,778 1,326 969 Derivatives 11 17,957 2,108 - Total non-current liabilities 224,508 117,664 45,445 EUR’000 Note 2023 2022 2021 Current liabilities Debt to credit institutions 12 799 772 28,599 Deferred charter hire income 10,190 1,831 15,187 Trade and other payables 16,437 7,997 7,266 Payables to related parties 10 89 63 Payables to subsidiaries 100,922 69,688 35,944 Current income tax liabilities 13 - 6 Derivatives 11 4,004 - - Total current Liabilities 132,375 80,377 87,065 Total liabilities 356,883 198,041 132,510 Total equity and liabilities 1,309,674 722,670 450,114 Parent Company Balance Sheet Continued from previous page |
|
175 EUR’000 Note Share capital Share premium Hedging reserves (Accumu-lated losses)/ retained earnings Total 2023 Beginning of financial year 26,575 509,542 1,343 (12,831) 524,629 Profit for the year - - - 11,348 11,348 Value adjustments of hedging instruments - - (19,281) - (19,281) Registration of new shares in relation with December 2023 business combination 9 15,264 450,271 - - 465,535 Costs incurred in connection with listing - (6,955) (6,955) Changes from business combination (23,619) (23,619) Share-based payments - - - 1,134 1,134 End of financial year 41,839 952,858 (17,938) (23,968) 952,791 2022 Beginning of financial year 18,641 339,400 - (40,437) 317,604 Profit for the year - - - 27,254 27,254 Value adjustments of hedging instruments - - 1,343 - 1,343 Capital increase May 2022 3,518 81,234 - - 84,752 Costs incurred in connection with May 2022 capital increase - (2,305) - - (2,305) Capital increase October 2022 4,416 94,082 - - 98,498 Costs incurred in connection with October 2022 capital increase - (2,869) - - (2,869) Share-based payments - - - 352 352 End of financial year 26,575 509,542 1,343 (12,831) 524,629 Parent Company Statement of Changes in Equity |
|
176 Parent Company Statement of Changes in Equity Continued from previous page EUR’000 Note Share capital Share premium Hedging reserves (Accumu-lated losses)/ retained earnings Total 2021 Beginning of financial year 15,557 265,741 - (37,526) 243,772 Profit for the year - - - (2,911) (2,911) Capital increase April 2021 3,084 76,134 - - 79,218 Costs incurred in connection with April 2021 capital increase - (2,154) - - (2,154) Share-based payments - (321) - - (321) End of financial year 18,641 339,400 - (40,437) 317,604 |
|
177 Notes to the Parent Company Financial Statements |
|
178 Note 1 Accounting Policies..................................................................................................................180 Note 2 Revenue........................................................................................................................................182 Note 3 Expenses by Nature.................................................................................................................183 Note 4 Employee Compensation.......................................................................................................185 Note 5 Tax ..................................................................................................................................................186 Note 6 Board of Directors and Management Compensation................................................. 187 Note 7 Intangible Assets.......................................................................................................................188 Note 8 Property, Plant and Equipment............................................................................................189 Note 9 Investment in Subsidiaries......................................................................................................191 Note 10 Share Based Payments...........................................................................................................192 Note 11 Derivatives ...................................................................................................................................192 Note 12 Debt to credit institutions ......................................................................................................192 Note 13 Off Balance Sheet Obligations and Commitments......................................................193 Note 14 Issued Share Capital ................................................................................................................194 Note 15 Related Parties...........................................................................................................................194 Notes to the Parent Company Financial Statements |
|
179 Note 16 Appropriation of Profit and Loss .........................................................................................194 Note 17 Events After Reporting Period .............................................................................................195 Notes to the Parent Company Financial Statements |
|
180 The Parent Company financial statements of Cadeler A/S for 2023 have been prepared in accordance with the provisions in the Danish Financial Statements Act applying to re-porting class D entities. The Parent Company’s accounting policies on recognition and measurement are gener-ally consistent with those of the Group. For accounting policies with differences between the Parent Company’s accounting policies and the Group’s accounting policies are de-scribed below. Changes in accounting policies The Parent Company financial statements have been prepared using the same account-ing policies as last year. Disclosure requirements have been stated to comply with the requirements of the Danish Financial Statements Act. Omission of a cash flow statement With reference to section 86(4) of the Danish Financial Statements Act, no cash flow statement has been prepared. The entity's cash flows are part of the consolidated cash flow statement of Cadeler A/S. Dividends from subsidiaries Dividends from subsidiaries are recognised in the income statement in so far as the divi-dend does not exceed the accumulated earnings in the subsidiary in the period of own-ership. Receivables Receivables are measured at amortised cost. The Company has chosen IAS 39 as interpretation for impairment of financial receiva-bles. An impairment loss is recognised if there is objective evidence that a receivable or a group of receivables is impaired. If there is objective evidence that an individual receiva-ble has been impaired, an impairment loss is recognised on an individual basis. Revenue The Company has chosen IFRS 15 under Danish GAAP as interpretation for revenue recognition. For further information on accounting policies refer to Note 2 in the consoli-dated financial statements. The Company revenue includes intercompany transactions with Wind Orca and Wind Os-prey which are governed by the ship management agreements. The Company charges revenue from the Wind entities during off-hire periods (off-hire ship management costs). Investments in subsidiaries Investments in subsidiaries are initially measured at cost less impairment. Dividends re-ceived that exceed the accumulated earnings in the subsidiary during the period of own-ership are treated as a reduction of cost. Costs in connection with the purchase of sub-sidiaries are included in the cost price. Where the cost exceeds the recoverable amount, an impairment loss is recognised to this lower value. Note 1 Accounting Policies |
|
181 The carrying amount of investments in subsidiaries is tested for impairment at least once a year or sooner if impairment indication arises. Derivatives and hedge accounting Derivative financial instruments are initially recognised at fair value on the date on which a derivative contract is entered into and subsequently remeasured at fair value over profit and loss. Derivatives are carried as financial assets, presented under derivatives assets, when the fair value is positive and as financial liabilities, presented under deriva-tives liabilities, when the fair value is negative. The Company has chosen to apply IFRS 9 approach for derivatives and hedge account-ing. For further details on the accounting policies, refer to Note 2 in the Consolidated Fi-nancial Statements. Property, plant and equipment Property, plant and equipment are recognised at cost less accumulated depreciation and accumulated impairment losses. Depreciation is calculated using the straight-line method to allocate their depreciable amounts over the assets’ estimated useful lives. The estimated useful lives are as fol-lows: Useful lives Other fixtures and fittings 2 to 3 years Share capital Ordinary shares are classified as equity. Costs related to the issue of new shares are rec-ognised in equity. Share premium reserve and retained earnings Capital increase is categorised as equity. Share premium reserve signifies the capital contributed by investors exceeding the nominal value of the shares issued, net of any in-cremental costs directly associated with the issuance of new shares. Retained earnings include results from previous periods, changes to equity arising from business combina-tion purchase price, and share-based payments. Share based payments Employees (including senior executives) of the Group receive remuneration in the form of share-based payments, whereby employees render services as consideration for eq-uity instruments (equity-settled transactions). Note 1 Accounting Policies Continued from previous page |
|
182 Changes in the fair value of derivative financial instruments designated as cash flow hedges are recognised in equity and presented under “Hedging reserves” (equity). Leasing with the Company as lessee The Company has decided to apply IAS 17 as the basis of accounting for leases. Applying IAS 17, operating lease expenses are recognised as incurred on a straight line basis over the lease term. Refer to Note 3 in the Consolidated Financial Statements for disclosure of revenue. Parent Company revenue further includes revenue from related parties totalling EUR 3.6 million (2022: EUR 2 million; 2021: EUR 1.9 million). Related party revenue consists of in-come derived from managing and maintaining the two windfarm installation vessels dur-ing off-hire periods. Deferred income relate to consideration received from customers for the unsatisfied performance obligation in the charter contracts. Revenue will be recognised when the related services are provided to the customers. For further information on accounting policies refer to Note 2.3 in the consolidated financial statements. Segment information The Group’s management are not operating or making decisions based on customer types, type of service, revenue streams or geographical segments. The Group operates four windfarm installation vessels, which are viewed as one segment and can operate in all geographical areas required for the specification of a specific windfarm project. Ac-cordingly, the Group only has one operating segment. Note 1 Accounting Policies Continued from previous page Note 2 Revenue |
|
183 EUR’000 Note 2023 2022 2021 Cost of sales Bareboat charter hire 29,508 33,638 29,919 Insurance 42 231 182 Crewing costs paid to a related party and an external party 15 - 61 11,517 Seafarer payroll 4 14,420 13,089 1,159 Fuel and oil 501 1,113 892 Maintenance 4,917 4,039 2,304 Messing costs 1,398 1,428 1,224 Seafarer travel 2,835 2,589 1,876 Specific charter costs 2,882 3,088 1,239 Utilities 389 689 542 Other operating expenses 190 309 263 Tonnage tax (5) (5) 17 Total cost of sales 57,077 60,269 51,134 EUR’000 Note 2023 2022 2021 Administrative expenses Depreciation and amortisation 7, 8 504 273 136 Employee compensation 4 18,983 9,905 7,492 Repair and maintenance expenses 1,123 796 665 Legal and professional fees 1,406 1,047 564 Transaction costs 7,707 Rental expenses 731 940 898 Travel expense 965 612 305 Management fees to related party 15 - 1 115 Marketing and entertainment expenses 601 788 212 Other expenses 1,646 929 575 Total administrative expenses 33,666 15,291 10,962 Note 3 Expenses by Nature |
|
184 Auditor remuneration Administrative expenses include fees to the auditors appointed by the shareholder at the Annual General Meeting: EUR’000 2023 2022 2021 Statutory audit 464 125 92 Tax services - 105 50 Other assurance services 1,608 - 8 Other services 606 51 14 Total 2,678 281 164 Statutory audit services consist of fees for professional services rendered by EY for the audit of our annual consolidated financial statements and services that are provided by the auditor in connection with statutory audit. Other assurance services including re-audits and assurance reports in respect of pro-forma financial information in in connection with regulatory filings, and review of interim financial information. Tax services consists of Tax compliance services. Other services consists of services provided for other permitted services, including fees for work performed in connection with the U.S. listing in December 2023. Note 3 Expenses by Nature Continued from previous page 184 |
|
185 Onshore - presented within administra-tive expenses EUR’000 Note 2023 2022 2021 Wages and salaries 16,671 8,873 6,637 Employer's contribution to defined contribu-tion plans 819 502 350 Share based payment expense 10 1,134 352 360 Other short-term benefits 359 178 145 18,983 9,905 7,492 Average number of full time employees 105 70 58 Offshore - presented within cost of sales EUR’000 2023 2022 2021 Wages and salaries 13,190 11,693 1,097 Employer's contribution to defined contribution plans 1,060 1,082 60 Other short-term benefits 170 314 2 14,420 13,089 1,159 Average number of full time employees 167 162 12 Offshore crew was hired directly by the Company by the end of November 2021. Average number of full-time employees in 2021 reflect the number of seafarers divided by 12 months. The Company had 148 seafarers by the end of 2021. Total EUR’000 2023 2022 2021 Wages and salaries 29,861 20,566 7,734 Employer's contribution to defined contribu-tion plans 1,879 1,584 410 Share based payment expense 10 1,134 352 360 Other short-term benefits 529 492 147 33,403 22,994 8,651 Average number of full time employees 272 232 70 Note 4 Employee Compensation |
|
186 EUR’000 2023 2022 2021 Tax expense attributable to profit is made up of: Utilisation of non-recognised tax losses off-set against Danish Tonnage Tax expense - - (13) Total - - (13) An expansion of the Danish tonnage tax regime to cover wind farm installation vessels was passed in January 2020 with retroactive effect from 2017, 2017 inclusive. On 15 December 2020, Cadeler A/S received a binding ruling from the Danish Tax Au-thorities. According to this, Cadeler A/S was able to apply the Danish Tonnage Taxation after the listing of the shares 27 November 2020. Management applied the Danish Ton-nage Taxation during 2021. The recorded tonnage tax expense for 2023 in Denmark amounts to EUR 0 thousand. Cadeler A/S also has material tax losses from previous periods available for carry for-ward. Such tax losses can be utilised against future tonnage taxation income and other income, which does not qualify for tonnage taxation. The tax value of tax losses to be carried forward as of 31 December 2023 are in the region of EUR 13 million. The tax losses are not subject to expiration. Tonnage taxes are not to be accounted for as income tax, accordingly the costs are pre-sented as part of cost of sales. No tax expense has been recognised in 2023 in relation to Danish Tonnage tax. Note 5 Tax |
|
187 2023 2022 2021 EUR’000 Board of directors Executive management Total Board of directors Executive management Total Board of directors Executive management Total Wages, salaries and board fees 183 850 1,033 180 683 863 180 650 830 Share based payment - 588 588 - 173 173 - 164 164 Other short-term benefits - 55 55 - 36 36 - 23 23 Cash bonus - 1,155 1,155 - 482 482 - 314 314 Total Management Compensation 183 2,648 2,831 180 1,374 1,554 180 1,151 1,331 Executive management means the members of the executive management which were registered with the Danish business authority and who have the authority and responsi-bility for the planning, directing and controlling activities of the Company as defined by IAS24. Andreas Sohmen-Pao and Andreas Beroutsos are employed by the BW Group. These board members have not received remuneration from Cadeler in 2021, 2022 and 2023. Andreas Beroutsos stepped down from the Board with effect from 25 April 2023. On the same date, Andrea Abt joined the Board. David Peter Cogman is employed by the Swire Group and has not received remuneration from Cadeler in 2021, 2022 and 2023. David Peter Cogman stepped down from the Board with effect from 16 June 2023 along with Connie Hedegaard On 20 February 2024, Emanuele Lauro and James Nish joined the Board. Emanuele Lauro is the Director and Chief Executive Officer of Scorpio Holdings Limited considered a related party (See Note 27) Note 6 Board of Directors and Management Compensation |
|
188 Additions during 2023 are mainly related to further developments of the Company soft-ware solutions. While 2021 additions were mainly implementation costs for Enterprise Resource and Planning (ERP), Vessel and Crew Management software, 2022 additions are mainly fur-ther developments of these initially implemented solutions. Note 7 Intangible Assets 188 EUR'000 2023 2022 2021 Software Cost Beginning of period 662 434 - Additions 31 228 434 31 December 693 662 434 Accumulated amortisation Beginning of period 243 32 - Amortisation charge 210 211 32 31 December 453 243 32 Net book value 240 419 402 |
|
189 EUR’000 Other fixtures and fittings Assets under construction Total Cost 2023 Beginning of financial year 536 320,964 321,500 Additions 3 47,506 48,105 31 December 2023 539 368,470 369,605 Accumulated depreciation Beginning of financial year 445 - 445 Depreciation charge 6 - 6 31 December 2023 451 - 451 Net book value 88 368,470 369,154 Additions during 2023 are mainly driven by down payments of EUR 19.2 million for the new P-Class installation vessels (EUR 15.4 million) and the new A-Class foundation instal-lation vessels (EUR 3.8 million), represented above on Assets under Construction. In ad-dition, Assets under Construction contains EUR 7.6 million worth of guarantee fees to BW Group related to the A-Class and P-Class newbuild vessels as well as EUR 2.2 million of assets related to future projects that have not yet started. Borrowing costs for 2023 has been capitalised for a total of EUR 7.1 million (2022: EUR 4.2 million). The capitalisation rate used to determine the amount of borrowing costs to be capitalised is the weighted average interest rate applicable to the Company’s general borrowings during the reported period, in this case 5.5% (2022: 5.7%). Additions during 2022 are mainly driven by the down payments of the two new F-Class foundation installation vessels for EUR 167 million (in 2021 EUR 137 million was related to down payments of the two P-Class wind turbine installation vessels (“WTIVs”), repre-sented above on Assets under Construction. Note 8 Property, Plant and Equipment EUR’000 Other fixtures and fittings Assets under construction Total Cost 2022 Beginning of financial year 536 139,760 140,296 Additions 0 181,204 181,204 End of financial year 536 320,964 321,500 Accumulated depreciation Beginning of financial year 386 - 386 Depreciation charge 59 - 59 End of financial year 445 - 445 Net book value 91 320,964 321,055 |
|
190 EUR’000 Other fixtures and fittings Assets under construction Total Cost 2021 Beginning of financial year 379 - 379 Additions 157 139,760 139,917 End of financial year 536 139,760 140,296 Accumulated depreciation Beginning of financial year 280 280 Depreciation charge 106 - 106 End of financial year 386 - 386 Net book value 150 139,760 139,910 Note 8 Property, Plant and Equipment Continued from previous page |
|
191 Here below the movements related to the investments in subsidiaries: EUR’000 2023 2022 2021 Cost Beginning of financial year 249,534 249,534 249,534 Additions 495,955 - - End of financial year 745,489 249,534 249,534 Impairment Beginning of financial year - - - End of financial year - - - Carrying amount 745,489 249,534 249,534 The list of subsidiaries is detailed in Note 28 of the Consolidated Financial Statements. An additional EUR 496 million pertains to a business combination, where Cadeler A/S ac-quired 100% of shares in Eneti through a share exchange, as outlined in Note 6 of the consolidated financial statements. The shares are recorded at a cost price of EUR 496 million, inclusive of acquisition-re-lated expenses amounting to EUR 15 million. This cost comprises the fair value of shares issued, totalling EUR 441 million, and a squeeze-out payment of EUR 55 million. All transaction costs incurred are included in the cost, differing from the presentation in the consolidated financial statements, where some are expensed while others are de-ducted from equity. Further details regarding the issuance of shares in connection with the business combi-nation are provided in Note 13. In the process of acquiring Eneti, and based on the valuation as of 19 December 2023, all value adjustments have been incorporated to reflect fair values at the acquisition date. As of 31 December 2023, no changes or indicators of impairment that could significantly affect valuation have been identified by Management. Therefore, no impairment has been recognised. The carrying amount of investments in subsidiaries undergoes impair-ment testing at least annually, or more frequently if impairment indicators arise. For addi-tional information regarding the acquisition of Eneti, please refer to Note 6 of the Con-solidated Financial Statements. Note 9 Investment in Subsidiaries |
|
192 Share based payment is disclosed in Note 8 to the Consolidated Financial Statements. Derivative Financial Instruments are disclosed in Note 25 to the Consolidated Financial Statements. The total amount of utilised debt, amounting to EUR 212 million, is due within 5 years. Note 10 Share Based Payments Note 11 Derivatives Note 12 Debt to credit institutions |
|
193 The Company has off balance sheet obligations relating to the leasing of vessels from its subsidiaries Wind Orca Ltd and Wind Osprey Ltd. The lease has no fixed expiry and is ex-pected to continue for the duration of the contract backlog. The annual off balance sheet obligations of the vessels are estimated to be up to EUR 39 million, depending on the number of days on hire. New headquarters from 2024 The Company signed a contract with Castellum Denmark for a new headquarters loca-tion from 2024, which will reflect at the balance sheet in Q1 2024. The Company will have access to almost 5,000 m2 of office space in central Copenhagen. The contract for a ten year period, with a six years biding period, amounted to EUR 13 million. The Company paid EUR 1 million as a deposit fee for this contract. P-Class vessels Since 30 June 2021 the Company has a contract with COSCO SHIPPING Heavy Industry to build two new P-Class WTIVs. The total sum of the contract for the new vessels is ap-proximately EUR 572 million, of which EUR 137 million was paid in 2021 and EUR 14 million was paid in 2023. The remaining scheduled payments will be due between 2024 and 2025. Of the total contract, USD 390 million will be paid in USD and EUR 220 million will be paid in EUR. A-Class vessels On 9 May 2022 and 22 November 2022 the Company signed additional contracts with COSCO SHIPPING Heavy Industry to build a total of two new A-Class foundation installa-tion vessel. The total sum of the contracts for the new vessel is approximately EUR 657 million, of which approximately a total of EUR 167 million was paid in 2022, while the re-maining amounts will be due over the years from 2025 to 2026. Of the total contract, USD 495 million will be paid in USD and EUR 205 million will be paid in EUR. More information regarding remaining instalments for the newbuilds vessels can be found in Note 23 to the Consolidated Financial Statements. Financial liabilities: Interest-bearing loans and borrowings Terms and covenants regarding the Debt Facilities are disclosed in Note 26 to the Con-solidated Financial Statements. Note 13 Off Balance Sheet Obligations and Commitments |
|
194 Thousands No. of shares 2023 2022 2021 Ordinary shares Beginning and end of financial year 2021 138,574 26,575 18,641 18,641 Issued on May 2022 for capital increase 26,176 - 3,518 - Issued on October 2022 for capital in-crease 32,850 - 4,416 - Issued on December 2023 for capital in-crease 113,809 15,263 4,416 - End of financial year 2023 311,409 41,838 26,575 18,641 As of 1 January 2023, the Group’s issued and paid in share capital amounted to DKK 197,600 thousand, equal to EUR 26,575 thousand, consisting of 197,600,000 shares of DKK 1. In June 2023, Cadeler and Eneti entered into a Business Combination Agreement, exe-cuted through a stock-for-stock exchange offer made to all stockholders of Eneti. In De-cember 2023, the share exchange offer was successfully completed and, consequently, the registration of the share capital increase. In December 2023, the authorised share capital was increased by DKK 113,809 thousand, equal to EUR 15,263 thousand, consisting of 113,809,868 shares of DKK 1. At the end of 2023, the Group had share capital amounting to DKK 311,409 thousand, equal to EUR 41,838 thousand, consisting of 311,409,868 shares of DKK 1. All shares have equal rights. Cadeler A/S’ related parties comprise the subsidiaries, mentioned in Note 9, which are fully owned by the Company. Cadeler A/S’ related party transactions comprise revenue from the subsidiaries of EUR 3.6 million related to managing and maintaining the vessels during off-hire periods as well as operating lease expenses paid to the subsidiaries of EUR 29.5 million related to the vessels during on-hire periods. Cadeler A/S also has related parties transactions as disclosed in the Consolidated Fi-nancial Statements. EUR’000 2023 2022 2021 Recommended appropriation of Profit and Loss Retained earnings/accumulated loss 11,348 27,254 (2,911) 11,348 27,254 (2,911) Note 14 Issued Share Capital Note 15 Related Parties Note 16 Appropriation of Profit and Loss |
|
195 Increased funding commitment On 7 February 2024, the Group has secured additional capital, increasing the Holdco Fa-cility from EUR 50 million to EUR 80 million. The purpose of the Holdco Facility is, among others, partial funding of the wind installation activities of the Group and general corpo- rate purposes. Private placement The Company conducted a successful private placement, which was completed on 15 February 2024, resulting in the issuance of 39.5 million shares at a price of NOK 44.50 per share. Overall, the Company raised approximately EUR 154 million (USD 166 million) be-fore transaction costs. The proceeds from the private placement will fund two main ob-jectives. Firstly, they will fully finance the equity portion of Cadeler's planned third A-Class Wind Foundation Installation Vessel newbuild, accounting for approximately 35% of its total expected vessel cost. Secondly, the funds will be allocated towards acquiring mission equipment and building working capital. This will enable Cadeler to capitalise on selected near -term commercial opportunities, including utilising turbine installation ves-sels for T&I foundation scopes, accelerating the realisation of commercial synergies, and seizing other opportunities resulting from supply chain bottlenecks and project delays in the coming years. Increased funding utilisation On 22 March 2024, the Group utilised EUR 50 million of the EUR 100 million term loan available from the New Debt Facility, as the Wind Orca main crane upgrade nears com-pletion. Additionally, the Group is in the process of requesting the utilisation of the re-maining EUR 50 million. This utilisation is related to the Wind Osprey main crane up-grade, also in its final stages. Note 17 Events After Reporting Period |
|
196 |
|
197 Statement by Management |
|
198 The Board of Directors and the Executive Board have today discussed and approved the annual report of Cadeler A/S for 2023. The consolidated financial statements have been prepared in accordance with Interna-tional Financial Reporting Standards as adopted by the EU and in accordance with IFRS as issued by the International Accounting Standards Board (“IASB”). The Parent Com-pany financial statements are prepared in accordance with the Danish Financial State-ments Act. Further, the annual report is prepared in accordance with additional require-ments of the Danish Financial Statements Act. In our opinion, the consolidated financial statements and the parent company financial statements give a true and fair view of the financial position of the Group and the Parent Company at 31 December 2023 and of the results of their operations and the consoli-dated cash flows for the financial year 1 January – 31 December 2023. In connection with digital filing under the ESEF regulation, in our opinion, the annual re-port for the financial year ended 31 December 2023, has been prepared in all material re-spects in compliance with the ESEF regulation. Further, in our opinion, the management's review gives a fair review of the development in the Group's and the Parent Company's activities and financial matters, results for the year, consolidated cash flows and financial position as well as a description of material risks and uncertainties that the Group and the Parent Company face. We recommend that the annual report be approved at the annual general meeting. Copenhagen, 26 March 2024 Executive Management Mikkel Gleerup CEO Peter Brogaard Hansen CFO Board of Directors Andreas Sohmen-Pao Emanuele Lauro Jesper T. Lok Ditlev Wedell-Wedellsborg Andrea Abt James B. Nish Statement by Management |
|
199 199 |
|
200 Independent Auditor's Report |
|
201 To the shareholders of Cadeler A/S Report on the audit of the Consolidated Financial Statements and Parent Company Financial Statements Opinion We have audited the consolidated financial statements and the parent company finan-cial statements of Cadeler A/S for the financial year 1 January – 31 December 2023, which comprise balance sheet, statement of changes in equity and notes, including ma-terial accounting policy information, for the Group and the Parent Company, a consoli-dated statement of profit and loss and other comprehensive income and a consolidated statement of cash flow for the Group, and a statement of profit and loss for the Parent Company. The consolidated financial statements are prepared in accordance with IFRS Accounting Standards as issued by the IASB and as adopted by the EU and additional requirements of the Danish Financial Statements Act, and the parent company financial statements are prepared in accordance with the Danish Financial Statements Act. In our opinion, the consolidated financial statements give a true and fair view of the fi-nancial position of the Group at 31 December 2023 and of the results of the Group's op-erations and cash flows for the financial year 1 January – 31 December 2023 in accord-ance with IFRS Accounting Standards as issued by the IASB and as adopted by the EU and additional requirements of the Danish Financial Statements Act. Further, in our opinion the parent company financial statements give a true and fair view of the financial position of the Parent Company at 31 December 2023 and of the results of the Parent Company's operations for the financial year 1 January – 31 December 2023 in accordance with the Danish Financial Statements Act. Our opinion is consistent with our long-form audit report to the Audit Committee and the Board of Directors. Basis for opinion We conducted our audit in accordance with International Standards on Auditing (ISAs) and additional requirements applicable in Denmark. Our responsibilities under those standards and requirements are further described in the "Auditor's responsibilities for the audit of the consolidated financial statements and the parent company financial state-ments" (hereinafter collectively referred to as "the financial statements") section of our report. We believe that the audit evidence we have obtained is sufficient and appropriate to provide a basis for our opinion. Independence We are independent of the Group in accordance with the International Ethics Standards Board for Accountants' International Code of Ethics for Professional Accountants (IESBA Code) and the additional ethical requirements applicable in Denmark, and we have ful-filled our other ethical responsibilities in accordance with these requirements and the IESBA Code. To the best of our knowledge, we have not provided any prohibited non-audit services as described in article 5(1) of Regulation (EU) no. 537/2014. Appointment of auditor Cadeler A/S’ shares were initially listed on Nasdaq Oslo in November 2020. Subsequent to the listing, we were appointed by resolution of the general meeting held on 29 April 2021 for the financial year 2021 and since the listing, we have been reappointed annually by resolution of the general meeting for a total consecutive period of 3 years up until the financial year 2023. Independent Auditor's Report |
|
202 Key audit matters Key audit matters are those matters that, in our professional judgement, were of most significance in our audit of the financial statements for the financial year 2023. These matters were addressed during our audit of the financial statements as a whole and in forming our opinion thereon. We do not provide a separate opinion on these matters. For each matter below, our description of how our audit addressed the matter is provided in that context. We have fulfilled our responsibilities described in the "Auditor's responsibilities for the audit of the financial statements" section, including in relation to the key audit matters below. Accordingly, our audit included the design and performance of procedures to re-spond to our assessment of the risks of material misstatement of the financial state-ments. The results of our audit procedures, including the procedures performed to ad-dress the matters below, provide the basis for our audit opinion on the financial state-ments. Accounting for business combination On 19 December 2023, Cadeler acquired 86.39% of shares in Eneti Inc. via a share ex-change offer. The remaining shares were acquired through a squeeze-out merger on 29 December 2023. Identification of assets and liabilities as part of the acquisition of Eneti Inc. is considered a key judgement by Management, whereas the determined fair values of the identified assets and liabilities are considered to be key estimates applied by Management. In order to determine the preliminary fair value of the identified vessels, Management has applied external market valuations carried out by professional appraisers. Fair value was furthermore substantiated by an income approach, based on the present values of the expected cash flows. The income approach uses a number of significant assump-tions regarding the expected day rates, level of utilisation, profitability and discount rate. In order to determine the preliminary fair value of the identified vessels under construc-tion, Management has applied the lowest value of recognised costs of vessels under construction and value derived taking an income approach, based on the present values of the expected cash flows. The income approach uses a number of significant assump-tions regarding the expected day rates, level of utilisation, profitability and discount rate. Further, to determine the preliminary fair value of liabilities, the most significant judge-ment and assumptions relates to the fair value of a single onerous contract linked to a vessel held for sale, which, by nature, is subject to significant judgement and estimate by Management. We focused on this area because purchase price allocation requires significant estima-tion by Management in determining the fair value of identified assets and liabilities, which is significantly sensitive to changes in those applied assumptions. We refer to note 6 in the Consolidated Financial Statements. How we addressed the matter in our audit We assessed whether the acquisition met the criteria for a business combination. We performed risk assessment procedures and obtained an understanding of the busi-ness processes and relevant controls for accounting for business combinations, includ-ing performed assessment of whether the controls were designed to effectively address the risk of material misstatements. Independent Auditor's Report Continued from previous page |
|
203 We verified the assets and liabilities recognised in the opening balance sheet by per-forming audit procedures in relation to the opening balance sheet. We tested management’s process and methodology (including assessing the compe-tence and objectivity of management’s expert and of the professional appraisers in-volved) for determining fair values. We included our in-house valuation specialists to evaluate the appropriateness of the valuation techniques used by management’s experts and the professional appraisers in-volved, including tests of the completeness and accuracy of the models. We challenged tested the significant assumptions applied by Management, including the expected day rates, level of utilisation, profitability and discount rate used to determine the preliminary fair value of the acquired assets and liabilities in the business combina-tion, including vessels and vessels under construction. We compared the assumptions used by management to days rates and utilisation levels for comparable vessels., We compared the forecasts from the business case of the acquisition to assumptions ap-plied to the calculation of fair value of acquired assets and liabilities. We challenged tested the significant judgement and assumptions made applied by Man-agement in relation to the preliminary fair value of the single onerous contract linked to a vessel disposed of prior to the completion of the merger. We assessed the appropriateness of the disclosure in note 6 of the Consolidated Finan-cial Statements. Revenue recognition Based on the Group’s contracts with customers, the Group generates revenue from two main revenue streams: revenue from time charter contracts and time charter related ac-tivities (referred to as time charter revenue stream) and revenue from transportation and installation (referred to as transportation and installation revenue stream). Evaluating the criteria for revenue recognition under the Group’s contracts with custom-ers requires Management's judgement to assess and determine lease component and non-lease components within the contracts. For non-lease components, Management's judgement is required to assess and determine the following: • Identification of performance obligations within the contract and deter-mine the nature of performance obligations and whether they are distinct or should be combined with other performance obligations to determine whether the performance obligations are satisfied over time or at a point in time. • Determine the transaction price • Allocation of transaction price to performance obligations to determine the stand-alone selling price of each performance obligation identified in the contract For revenue recognised over time as the service is being provided, Management is re-quired to estimate progress using either an input or out-put method. This is a key esti-mate. Independent Auditor's Report Continued from previous page |
|
204 We focused on this area because revenue recognition requires significant judgement by Management to assess and determine lease component and non-lease components within the contracts, as well as identification of performance obligations and estimation by Management in determining the progress of service provided, which is significantly sensitive to changes in those applied assumptions. We refer to note 2 and note 3 in the Consolidated Financial Statements. How we addressed the matter in our audit We discussed the recognition principles with Management, including contracts with cus-tomers and the assessment and determination of lease component and non-lease com-ponents within the contracts, as well as identification of performance obligations and es-timation of progress of services provided. We tested a sample of revenue transactions to underlying contracts with customers, in-cluding the assessment and determination of lease component and non-lease compo-nents within the contracts, as well as identification of performance obligations and esti-mation of progress of services provided. We obtained Management’s calculations and evaluated tested the mathematical accu-racy and internal consistency hereof. Further, we assessed and tested key data inputs and significant assumptions and recalculated the measurement of progress of services provided. We assessed the appropriateness of the disclosure in note 2 and 3 the Consolidated Fi-nancial Statements. Statement on the Management's review Management is responsible for the Management's review. Our opinion on the financial statements does not cover the Management's review, and we do not express any assurance conclusion thereon. In connection with our audit of the financial statements, our responsibility is to read the Management's review and, in doing so, consider whether the Management's review is materially inconsistent with the financial statements, or our knowledge obtained during the audit, or otherwise appears to be materially misstated. Moreover, it is our responsibility to consider whether the Management's review provides the information required by relevant law and regulations. Based on our procedures, we conclude that the Management's review is in accordance with the financial statements and has been prepared in accordance with the require-ments of relevant law and regulations. We did not identify any material misstatement of the Management's review. Independent Auditor's Report Continued from previous page |
|
205 Management's responsibilities for the financial statements Management is responsible for the preparation of consolidated financial statements that give a true and fair view in accordance with IFRS Accounting Standards as issued by the IASB and as adopted by the EU and additional requirements of the Danish Financial Statements Act and for the preparation of parent company financial statements that give a true and fair view in accordance with the Danish Financial Statements Act. Moreover, Management is responsible for such internal control as Management deter-mines is necessary to enable the preparation of financial statements that are free from material misstatement, whether due to fraud or error. In preparing the financial statements, Management is responsible for assessing the Group's and the Parent Company's ability to continue as a going concern, disclosing, as applicable, matters related to going concern and using the going concern basis of ac-counting in preparing the financial statements unless Management either intends to liq-uidate the Group or the Parent Company or to cease operations, or has no realistic alter-native but to do so. Auditor's responsibilities for the audit of the financial statements Our objectives are to obtain reasonable assurance as to whether the financial state-ments as a whole are free from material misstatement, whether due to fraud or error, and to issue an auditor's report that includes our opinion. Reasonable assurance is a high level of assurance, but is not a guarantee that an audit conducted in accordance with ISAs and additional requirements applicable in Denmark will always detect a material misstatement when it exists. Misstatements can arise from fraud or error and are consid-ered material if, individually or in the aggregate, they could reasonably be expected to influence the economic decisions of users taken on the basis of the financial state-ments. As part of an audit conducted in accordance with ISAs and additional requirements ap-plicable in Denmark, we exercise professional judgement and maintain professional scepticism throughout the audit. We also: ▶ Identify and assess the risks of material misstatement of the financial statements, whether due to fraud or error, design and perform audit procedures responsive to those risks and obtain audit evidence that is sufficient and appropriate to provide a basis for our opinion. The risk of not detecting a material misstatement resulting from fraud is higher than for one resulting from error, as fraud may involve collusion, for-gery, intentional omissions, misrepresentations or the override of internal control. ▶ Obtain an understanding of internal control relevant to the audit in order to design audit procedures that are appropriate in the circumstances, but not for the purpose of expressing an opinion on the effectiveness of the Group's and the Parent Compa-ny's internal control. ▶ Evaluate the appropriateness of accounting policies used and the reasonableness of accounting estimates and related disclosures made by Management. Independent Auditor's Report Continued from previous page |
|
206 ▶ Conclude on the appropriateness of Management's use of the going concern basis of accounting in preparing the financial statements and, based on the audit evidence obtained, whether a material uncertainty exists related to events or conditions that may cast significant doubt on the Group's and the Parent Company's ability to con-tinue as a going concern. If we conclude that a material uncertainty exists, we are re-quired to draw attention in our auditor's report to the related disclosures in the finan-cial statements or, if such disclosures are inadequate, to modify our opinion. Our conclusions are based on the audit evidence obtained up to the date of our auditor's report. However, future events or conditions may cause the Group and the Parent Company to cease to continue as a going concern. ▶ Evaluate the overall presentation, structure and contents of the financial statements, including the note disclosures, and whether the financial statements represent the underlying transactions and events in a manner that gives a true and fair view. ▶ Obtain sufficient appropriate audit evidence regarding the financial information of the entities or business activities within the Group to express an opinion on the con-solidated financial statements. We are responsible for the direction, supervision and performance of the group audit. We remain solely responsible for our audit opinion. We communicate with those charged with governance regarding, among other matters, the planned scope and timing of the audit and significant audit findings, including any significant deficiencies in internal control that we identify during our audit. We also provide those charged with governance with a statement that we have com-plied with relevant ethical requirements regarding independence, and to communicate with them all relationships and other matters that may reasonably be thought to bear on our independence, and where applicable, actions taken to eliminate threats or safe-guards applied. From the matters communicated with those charged with governance, we determine those matters that were of most significance in the audit of the consolidated financial statements and the parent company financial statements of the current period and are therefore the key audit matters. We describe these matters in our auditor's report unless law or regulation precludes public disclosure about the matter. Report on compliance with the ESEF Regulation As part of our audit of the Consolidated Financial Statements and Parent Company Fi-nancial Statements of Cadeler A/S, we performed procedures to express an opinion on whether the annual report of Cadeler A/S for the financial year 1 January – 31 December 2023 with the file name cadeler-2023-12-31-en.zip is prepared, in all material respects, in compliance with the Commission Delegated Regulation (EU) 2019/815 on the European Single Electronic Format (ESEF Regulation) which includes requirements related to the preparation of the annual report in XHTML format and iXBRL tagging of the Consolidated Financial Statements including notes. Management is responsible for preparing an annual report that complies with the ESEF Regulation. This responsibility includes: ▶ The preparing of the annual report in XHTML format; Independent Auditor's Report Continued from previous page |
|
207 ▶ The selection and application of appropriate iXBRL tags, including extensions to the ESEF taxonomy and the anchoring thereof to elements in the taxonomy, for all finan-cial information required to be tagged using judgement where necessary; ▶ Ensuring consistency between iXBRL tagged data and the Consolidated Financial Statements presented in human readable format; and ▶ For such internal control as Management determines necessary to enable the prepa-ration of an annual report that is compliant with the ESEF Regulation. Our responsibility is to obtain reasonable assurance on whether the annual report is pre-pared, in all material respects, in compliance with the ESEF Regulation based on the evi-dence we have obtained, and to issue a report that includes our opinion. The nature, tim-ing and extent of procedures selected depend on the auditor’s judgement, including the assessment of the risks of material departures from the requirements set out in the ESEF Regulation, whether due to fraud or error. The procedures include: ▶ Testing whether the annual report is prepared in XHTML format; ▶ Obtaining an understanding of the company’s iXBRL tagging process and of internal control over the tagging process; ▶ Evaluating the completeness of the iXBRL tagging of the Consolidated Financial Statements including notes; ▶ Evaluating the appropriateness of the company’s use of iXBRL elements selected from the ESEF taxonomy and the creation of extension elements where no suitable element in the ESEF taxonomy has been identified; ▶ Evaluating the use of anchoring of extension elements to elements in the ESEF tax-onomy; and ▶ Reconciling the iXBRL tagged data with the audited Consolidated Financial State-ments. In our opinion, the annual report of Cadeler A/S for the financial year 1 January – 31 De-cember 2023 with the file name cadeler-2023-12-31-en.zip is prepared, in all material re-spects, in compliance with the ESEF Regulation. Copenhagen, 26 March 2024 EY Godkendt Revisionspartnerselskab CVR no. 30 70 02 28 Mikkel Sthyr State Authorised Public Accountant mne26693 Christian Schwenn Johansen State Authorised Public Accountant mne33234 Independent Auditor's Report Continued from previous page |
|
208 Forward-looking Statements |
|
209 The annual report contains certain forward-looking statements relating to the business, financial performance and results of the Company and/or the industry in which it oper-ates. Forward-looking statements concern future circumstances and results and other state-ments that are not historical facts, sometimes identified by the words “believes”, ex-pects”, "predicts", "in-tends", "projects", "plans", "estimates", "aims", "foresees", "antici-pates", "targets", and similar ex-pressions. The forward-looking statements contained in the annual report, including assumptions, opinions and views of the Company or cited from third party sources are solely opinions and fore-casts which are subject to risks, un-certainties and other factors that may cause actual events to differ materially from any anticipated development. such factors may for example include a change in the price of raw materials. None of the Company or any of its parent or subsidiaries undertakings or any such per-son's officers or employees provides any assurance that the assumptions underlying such forward-looking statements are free from errors nor does any of them accept any responsibility for the future accuracy of the opinions expressed in the annual report or the actual occurrence of the forecasted developments. The Company assumes no obligation, except as required by law, to update any forward-looking statements or to conform these forward-looking statements to its actual results. The annual report contains information obtained from third parties. You are advised that such third-party information has not been prepared specifically for inclusion in the annual report and the Company has not undertaken any independent investigation to confirm the accuracy or completeness of such information. Several other factors could cause the actual results, performance or achievements of the Company to be materially different from any future results, performance or achieve-ments that may be ex-pressed or implied by statements and information in the annual report. Should any risks or uncertainties materialise, or should underlying assumptions prove in-correct, actual results may vary materially from those described in the annual report. No representation or warranty (express or implied) is made as to, and no reliance should be placed on, any information, including projections, estimates, targets and opinions, contained herein, and no liability whatsoever is accepted as to any errors, omissions or misstatements contained herein, and, accordingly, neither the Company nor any of its subsidiaries or shareholders or any officers, directors, board members or employees ac-cept any liability whatsoever arising directly or indirectly from the use of the annual re-port. Forward-Looking Statements |
|
210 Alternative Performance Measures |
|
211 Non-IFRS Financial Measures To supplement its financial information presented in accordance with IFRS, the Cadeler Group uses certain non-IFRS metrics, including EBITDA, and Adjusted EBITDA, when measuring performance, including when measuring current period results against prior periods. Because of its non-standardised definition, these non-IFRS measures (unlike IFRS measures) may not be comparable to the calculation of similar measures of other companies. These supplemental non-IFRS measures are presented solely to permit in-vestors to more fully understand how the Cadeler Group management assesses underly-ing performance. These supplemental non-IFRS measures are not, and should not, be viewed as a substi-tute for IFRS measures. Management believes the presentation of these non-IFRS measures provides investors with greater transparency and supplemental data relating to the Cadeler Group’s financial condition and results of operations, and therefore a more complete understanding of factors affecting its business and Cadeler Group’s op-erating performance. In addition, management believes the presentation of these non-IFRS measures is useful to investors for period-to-period comparison of results as the items may reflect certain unique and/or non-operating items such as asset sales, write-offs, contract termination costs or items outside of management’s control. As a performance measure, the Company uses EBITDA: Earnings before interest, tax, de-preciation, amortisation and foreign exchange gains/losses. EBITDA is calculated as shown below: EUR’000 Note 2023 2022 2021 Operating profit or loss as reported in the statement of profit 14,443 41,191 11,134 Right-of-use asset amortisation 16 334 - 276 Depreciation and amortisation 14, 15 22,714 22,684 16,216 Impairment of property, plant and equip-ment 5,000 - - EBITDA 42,491 63,875 27,626 Transactional costs 4 7,707 - - Adjusted EBITDA 50,198 63,875 27,626 The table above shows a reconciliation from EBITDA to Adjusted EBITDA. Transactional costs include all costs related to the business combination with Eneti, such as advisory, legal and consulting fees, which are included in administrative expenses. Transactional costs comprise significant unusual and/or infrequently occurring items that are not attributable to Cadeler’s normal operations. Alternative Performance Measures Group |
|
212 ESG Appendices 212 |
|
213 Appendix ESG.1 - SASB Sustainability Disclosure Topics and Accounting Metrics for Engineering and Construction Services Topic Accounting metric Value Category Unit of measurement CODE Environmental Impacts of Project Development Number of incidents of non-compliance with environmental per-mits, standards and regulations 0 Quantitative Number IF-EN-160a.1 Discussion of processes to assess and manage environmental risks associated with project design, siting, and construction See page 45-55 of an-nual report Discussion and analysis n/a IF-EN-160a.2 Structural Integrity and Safety Amount of defect and safety related rework costs 0 Quantitative Reporting currency IF-EN-250a.1 Total amount of monetary losses as a result of legal proceed-ings associated with defect and safety related incidents 0 Quantitative Reporting currency IF-EN-250a.2 Workforce Health and Safety (1) Total recordable incident rate and (2) fatality rate for (a) direct employees and (b) contract employees (1) 1.75 cases per million hours worked (2) 0 Cadeler only has rates for direct employees Quantitative Rate IF-EN-320a.1 Lifecycle Impacts of Buildings and Infrastruc-ture Number of (1) commissioned projects certified to a third party multi-attribute sustainability standard and (2) active projects seeking such certification (1) 0 (2) 0 Quantitative Number IF-EN-410a.1 Discussion of process to incorporate operational phase energy and water efficiency considerations into project planning and design See page 45-55 of an-nual report Discussion and analysis n/a IF-EN-410a.2 |
|
214 Topic Accounting metric Value Category Unit of measurement CODE Climate Impacts of Business Mix Amount of backlog for (1) hydrocarbon related projects and (2) renewable energy projects (1) 0 (2) 1581 m Quantitative Reporting currency IF-EN-410b.1 Amount of backlog cancellations associated with hydrocarbon-related projects 0 Quantitative Reporting currency IF-EN-410b.2 Amount of backlog for non-energy projects associated with cli-mate change mitigation 0 Quantitative Reporting currency IF-EN-410b.3 Business Ethics (1) Number of active projects and (2) backlog in countries that have the 20 lowest rankings in Transparency International's Cor-ruption Perception Index (1) 0 (2) 0 Quantitative Number, Reporting cur-rency IF-EN-510a.1 Total amount of monetary losses as a result of legal proceed-ings associated with charges of (1) bribery or corruption and (2) anti-competitive practices (1) 0 (2) 0 Quantitative Reporting currency TR-MT-110a.10 Description of policies and practices for prevention of (1) bribery and corruption, and (2) anti-competitive behaviour in the project bidding processes (1) See page 69-70 (2) See page 69-70 Discussion and analysis n/a TR-MT-110a.11 Activity metric Value Category Unit of measurement CODE Number of active projects 13 total, 1 ongoing, 12 in planning Quantitative Number TR-MT-110a.14 Number of commissioned projects 4 Quantitative Number TR-MT-110a.15 Total backlog 1581 m Quantitative Reporting currency TR-MT-110a.16 |
|
215 Appendix ESG.2 - SASB Sustainability Disclosure Topics and Accounting Metrics for Marine Transport Accounting metric Value Unit of measurement CODE Gross global scope 1 emissions 25479.30 Metric tons (t) CO2e TR-MT-11a.1 Discussion of long-term and short-term strategy or plan to manage scope 1 emissions, emissions re-duction targets, and an analysis of performance against those targets See page 45-55 annual report n/a TR-MT-110a.2 Total energy consumed (excludes legacy Eneti vessels for the few days at the end of 2023 that they were in the Cadeler fleet) 123140 Gigajoules (GJ) TR-MT-110a.3 Percentage heavy fuel oil 100 % TR-MT-110a.3 Percentage renewable 0 % TR-MT-110a.3 Average Energy Efficiency Design Index (EEDI) for new ships Not applicable based on build year Grams of CO2 per ton-nauti-cal mile TR-MT-110a.4 Air emissions of NOx (excluding N2O) 451.52 Metric tons (t) TR-MT-120a.1 Air emissions of SOx 155.97 Metric tons (t) TR-MT-120a.1 Air emissions of particulate matter (PM10) 8.34 Metric tons (t) TR-MT-120a.1 Shipping duration in marine protected areas or areas of protected conservation status 730 Number of travel days TR-MT-160a.1 Percentage of fleet implementing ballast water exchange 100 % TR-MT-160a.2 Percentage of fleet implementing ballast water treatment 100 % TR-MT-160a.2 Number of spills and releases to the environment 1 Number TR-MT-160a.3 Aggregate volume of spills and releases to the environment 1 litres (l) TR-MT-160a.3 |
|
216 Accounting metric Value Unit of measurement CODE Lost time incident rate (LTIR) 1.75 Incidents per million hours worked TR-MT-320a.1 Number of calls at ports in countries that have the 20 lowest rankings in Transparency International's Corruption Perception Index 0 Number TR-MT-510a.1 Total amount of monetary losses as a result of legal proceedings associated with bribery or corruption 0 Reporting currency TR-MT-510a.2 Number of marine casualties, percentage classified as very serious 0 Number, % TR-MT-540a.1 Number of conditions of class or recommendations 1 Number TR-MT-540a.2 Number of port state control deficiencies 0 Number TR-MT-540a.3 Number of port state control detentions 0 Number TR-MT-540a.3 Number of shipboard employees (end of 2023) 349 Number TR-MT-000.A Total distance travelled by vessels 9714.01 Nautical miles TR-MT-000.B Operating days 568.3 Days TR-MT-000.C Deadweight tonnage 50768.9 Deadweight tons TR-MT-000.D Number of vessels in total shipping fleet 4 Number TR-MT-000.E Number of vessel port calls 46 Number TR-MT-000.F Twenty-foot equivalent unit (TEU) capacity n/a TEU TR-MT-000.G |
|
217 Cadeler has reported the information cited in this GRI content index for the period 1 Jan 2022 – 31 Dec 2022 with reference to the GRI Standards. GRI Used – GRI 1: Foundation 2021 Appendix ESG.3 - GRI Reporting Content Index GRI Standard Disclosure Location/ Disclosure comment GRI 2: General Disclosures 2021 2-1 Organisational details Note 1 of the annual report 2-2 Entities included in the organisation’s sustainability reporting Note 1 of the annual report 2-3 Reporting period, frequency and contact point page 66 2-4 Restatements of information Boundaries for scope 1 & 3 emissions - see page 2-5 External assurance Sustainability section (page 37-81) not externally assured. 2-6 Activities, value chain and other business relationships Included in annual report Management Review 2-7 Employees Note 7 of the annual report and page 62 2-8 Workers who are not employees Not reported 2-9 Governance structure and composition Included in annual report Management Review, subsection Corpo-rate Governance 2-10 Nomination and selection of the highest governance body Included in annual report Management Review, subsection Corpo-rate Governance |
|
218 GRI Standard Disclosure Location/ Disclosure comment GRI 2: General Disclosures 2021 2-11 Chair of the highest governance body Included in annual report Management Review, subsection Corpo-rate Governance 2-12 Role of the highest governance body in overseeing the man-agement of impacts The board is responsible for ensuring that the company has sound internal control and systems for risk management (including in re-spect of corporate values, ethical guidelines, and guidelines for corporate social responsibility) that are appropriate and in relation to the nature and extent of the company's activities. The board must, at a minimum, carry out an annual review on the company's exposure and control of risks, including CSR topics 2-13 Delegation of responsibility for managing impacts page 65 2-14 Role of the highest governance body in sustainability reporting page 66 2-15 Conflicts of interest pages 31-33, disclosed related parties 2-16 Communication of critical concerns Cases informed via the whistleblowing mechanism are handled by the whistle blowing committee who must send an update to the Audit Committee on a quarterly basis 2-17 Collective knowledge of the highest governance body Included in annual report Management Review, subsection Corpo-rate Governance 2-18 Evaluation of the performance of the highest governance body See ‘Nomination Committee’ and ‘Board of Directors’ sections in the Corporate Governance policy: https://www.cadeler.com/as-sets/uploads/Documents/Company-Policies/cadeler-corporate-governance-policy-2023.pdf 2-19 Remuneration policies See the Cadeler Remuneration Policy, https://www.cadeler.com/media/1571/pandion-remuneration-pol-icy-147476308.pdf |
|
219 GRI Standard Disclosure Location/ Disclosure comment GRI 2: General Disclosures 2021 2-20 Process to determine remuneration See the Cadeler Remuneration Policy, https://www.cadeler.com/media/1571/pandion-remuneration-pol-icy-147476308.pdf 2-21 Annual total compensation ratio Can be calculated with information in Note 7 and Note 9 2-22 Statement on sustainable development strategy Chairman and CEO statement and reference in SD section, pgs 37- 81 2-23 Policy commitments page 69-70 2-24 Embedding policy commitments page 69 2-25 Processes to remediate negative impacts Formal processes not in place, will become an improvement point for Cadeler 2-26 Mechanisms for seeking advice and raising concerns page 66 2-27 Compliance with laws and regulations If any material case had occurred, it would be included in the man-agement review 2-28 Membership associations Cadeler is a member of Danish Shipping 2-29 Approach to stakeholder engagement page 43 2-30 Collective bargaining agreements Seafarer contracts guided by collective bargaining agreements GRI 3: Material Topics 2021 3-1 Process to determine material topics page 43 3-2 List of material topics page 43 GRI 205: Anti-corruption 2016 3-3 Management of GRI 205 page 66 205-1 Operations assessed for risks related to corruption page 66 205-2 Communication and training about anti-corruption policies and procedures Company’s Supply Chain Code of Conduct communicated to 472/797 of Company’s active suppliers registered prior to the mer-ger and to 100% of suppliers categorised as requiring such com-munication; supplier categories defined by the type of ser-vice/product provided to Cadeler. 205-3 Confirmed incidents of corruption and actions taken page 214 |
|
220 GRI Standard Disclosure Location/ Disclosure comment GRI 303: Water and Effluents 2018 3-3 Management of GRI 303 Page 53, 66 303-1 Interactions with water as a shared resource page 53 303-5 Water consumption page 52 GRI 305: Emissions 2016 3-3 Management of GRI 305 page 66, 45-55 305-1 Direct (Scope 1) GHG emissions page 52 305-2 Energy indirect (Scope 2) GHG emissions page 52 305-3 Other indirect (Scope 3) GHG emissions page 52 305-4 GHG emissions intensity page 50 305-5 Reduction of GHG emissions page 45-55 305-6 Emissions of ozone-depleting substances (ODS) F-Gases reported on page 52 305-7 Nitrogen oxides (NOx), sulfur oxides (SOx), and other signifi-cant air emissions page 52 GRI 403: Occupational Health and Safety 2018 3-3 Management of GRI 403 page 57 403-1 Occupational health and safety management system page 57, 60 403-2 Hazard identification, risk assessment, and incident investi-gation page 59 403-3 Occupational health services page 61 403-4 Worker participation, consultation, and communication on occupational health and safety page 59 403-6 Promotion of worker health page 61 403-8 Workers covered by an occupational health and safety man-agement system page 60 403-9 Work-related injuries page 58 |
|
221 GRI Standard Disclosure Location/ Disclosure comment GRI 405: Diversity and Equal Opportunity 2016 3-3 Management of GRI 405 page 66 405-1 Diversity of governance bodies and employees page 30,62 405-2 Ratio of basic salary and remuneration of women to men Not currently calculated GRI 408: Child Labour 2016 3-3 Management of GRI 408 page 66 408-1 Operations and suppliers at significant risk for incidents of child labour Cadeler is in the process of reviewing and updating its supplier due diligence process to incorporate human rights considerations GRI 409: Forced or Compulsory Labour 2016 3-3 Management of GRI 409 page 66 409-1 Operations and suppliers at significant risk for incidents of forced or compulsory labour Cadeler is in the process of reviewing and updating its supplier due diligence process to incorporate human rights considerations GRI 414: Supplier Social Assessment 2016 3-3 Management of GRI 414 page 66 414-1 New suppliers that were screened using social criteria page 66 – Cadeler implemented process for tracking supplier acceptance of Supply Chain Code of Conduct in 2022 414-2 Negative social impacts in the supply chain and actions taken Not recorded in 2023 GRI 308: Supplier Environmental Assessment 2016 3-3 Management of GRI 308 page 66 308-1 New suppliers that were screened using environmental crite-ria page 66 – Cadeler implemented process for tracking supplier acceptance of Supply Chain Code of Conduct in 2022 308-2 Negative environmental impacts in the supply chain and ac-tions taken Not recorded in 2023 |
|
222 Cadeler Kalvebod Brygge 43 DK–1560 Copenhagen V Denmark +45 3246 3100 www.cadeler.com |
