EX-99.1
Published on March 24, 2026

1
Annual Report 2025
For the year ending 31 December 2025
Cadeler A/S. Incorporated in Denmark. Registration Number (CVR no.): 3118 0503
Kalvebod Brygge 43, DK-1560 Copenhagen V, Denmark


2
Contents


4
Statement from the CEO
2025 was a defining year for Cadeler.
Through disciplined execution and a major expansion of our fleet,
the company strengthened its position as a leading provider of
offshore wind installation services while delivering strong financial
performance. Building on the strategic transformation of recent
years, Cadeler significantly increased fleet capacity, expanded its
organisational platform, and further diversified revenues across
transport and installation, foundations, and operations and
maintenance (O&M).
Strong market demand and high fleet utilisation supported results
that exceeded expectations. Reliable project execution remains a
key differentiator in offshore wind, and Cadeler continued to deliver
consistent performance for clients and partners. This momentum
contributed to a record-high order backlog, providing strong long-
term visibility and reinforcing the resilience of our business model.
Expanding fleet capacity
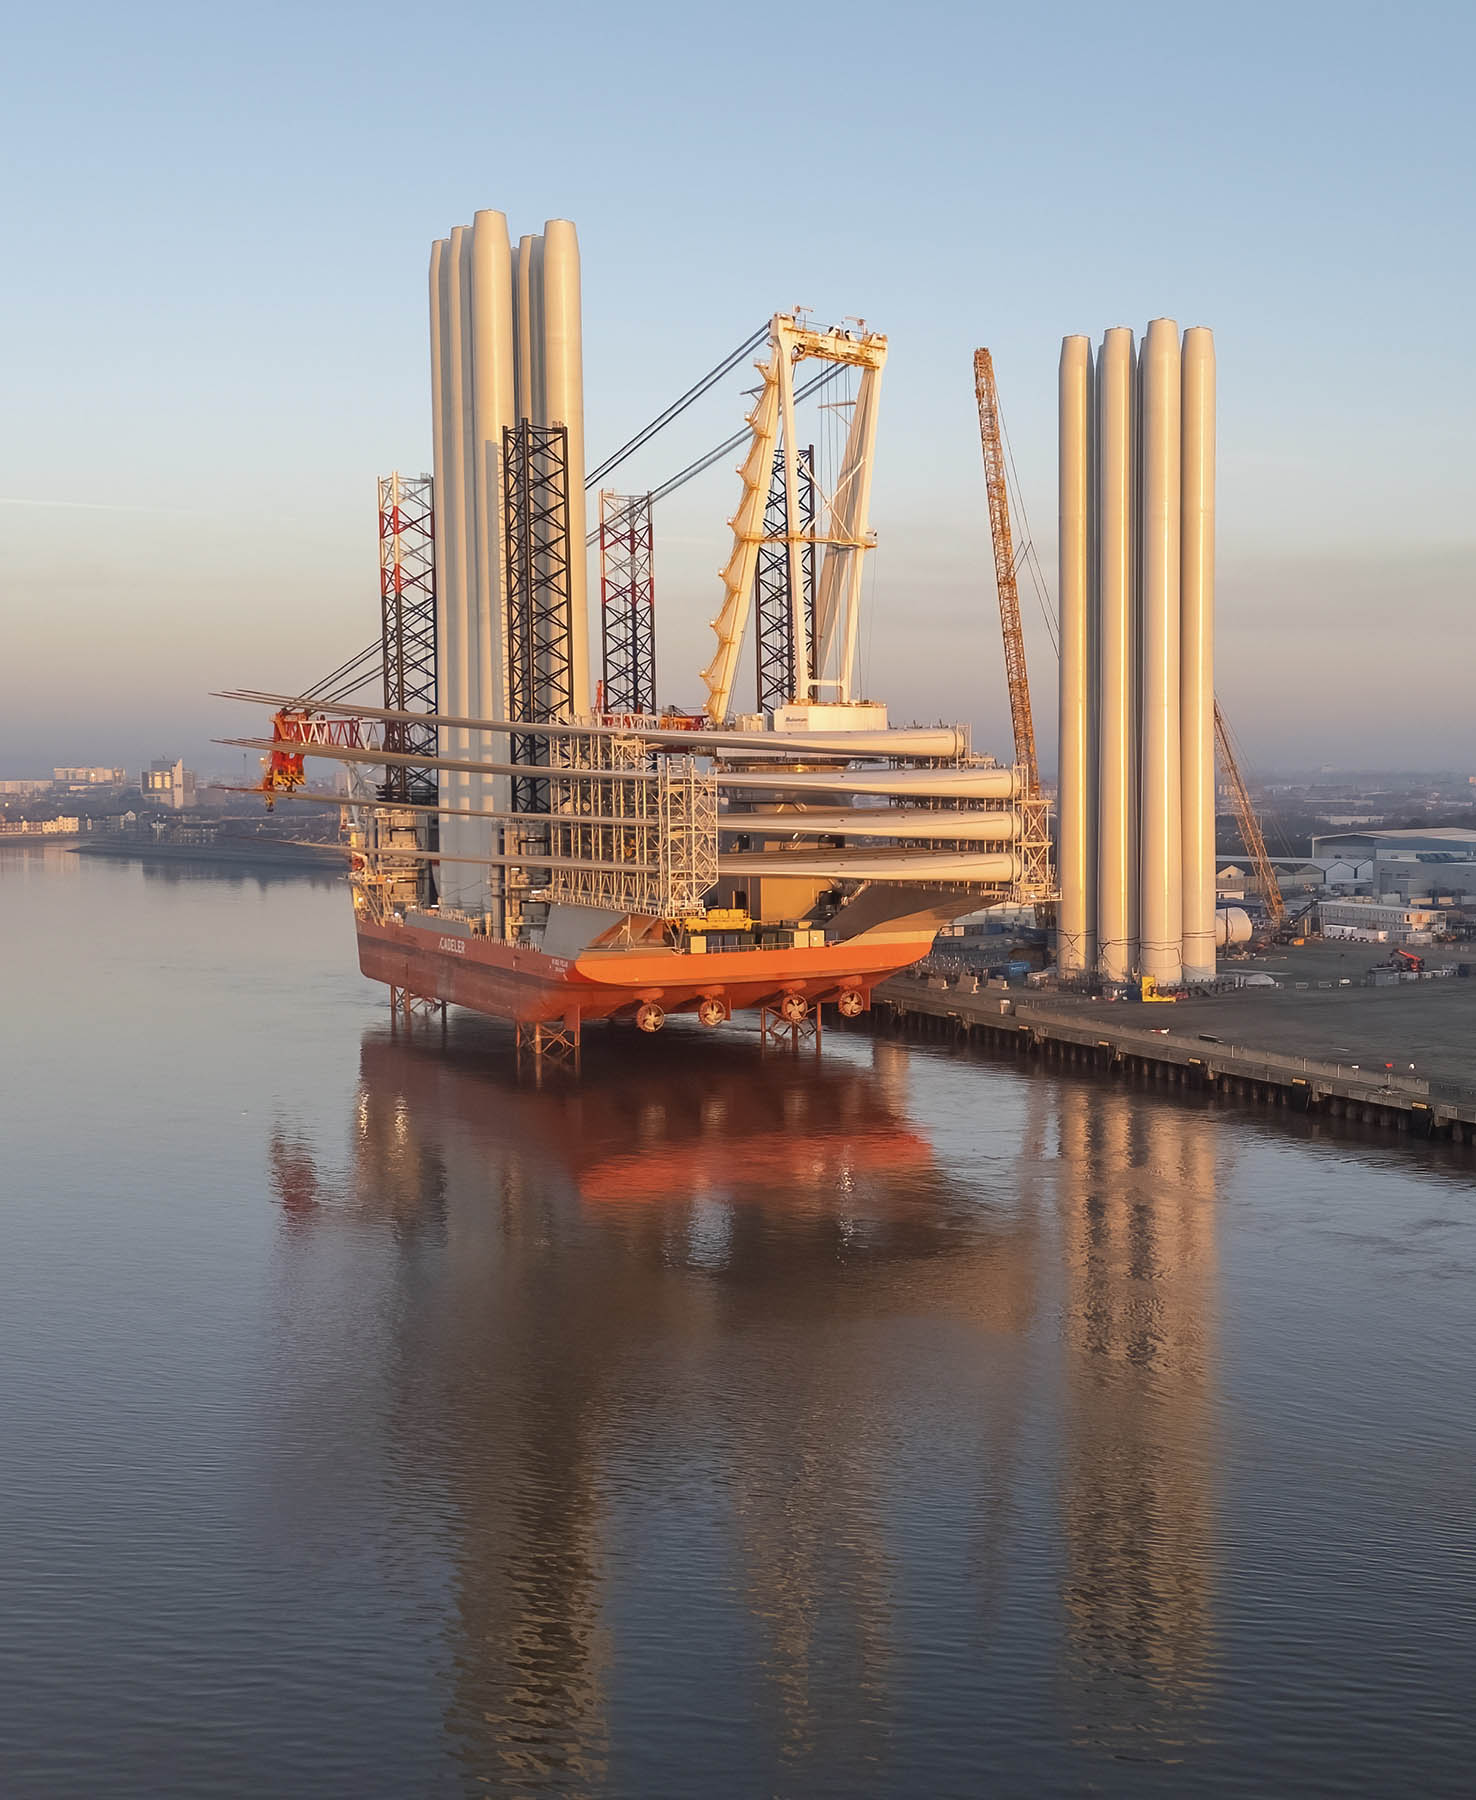
A central milestone in 2025 was the delivery of five new vessels:
Wind Maker, Wind Pace, Wind Keeper, Wind Ally and Wind Mover.
This expansion effectively doubled Cadeler’s fleet capacity within
twelve months, with all vessels delivered on or ahead of schedule.
The expansion reflects proactive fleet planning and vessel designs
developed through decades of operational experience. As offshore
wind projects grow in scale and complexity, installation capacity and
operational efficiency are becoming increasingly critical.
A larger, standardised fleet also enhances operational resilience for
our clients. Greater fleet depth provides built-in redundancy,
improving reliability and reducing execution risk across complex
installation campaigns.
Cadeler’s expansion will continue with the expected delivery of Wind
Ace in the second half of 2026. By mid-2027, the company will operate
a fleet of twelve vessels, positioning Cadeler as the world’s largest and
most versatile pure-play offshore wind installation provider.
Throughout this period of growth, Cadeler maintained a disciplined
capital structure. In May 2025, the company acquired Wind Keeper,
further strengthening its capabilities in O&M services. Later in the
year, Cadeler also established a new unsecured green corporate loan
facility, increasing financial flexibility and supporting future growth.
Scaling the organisation
Our people remain the foundation of Cadeler’s success. As the fleet
expanded during 2025, the organisation also grew significantly,
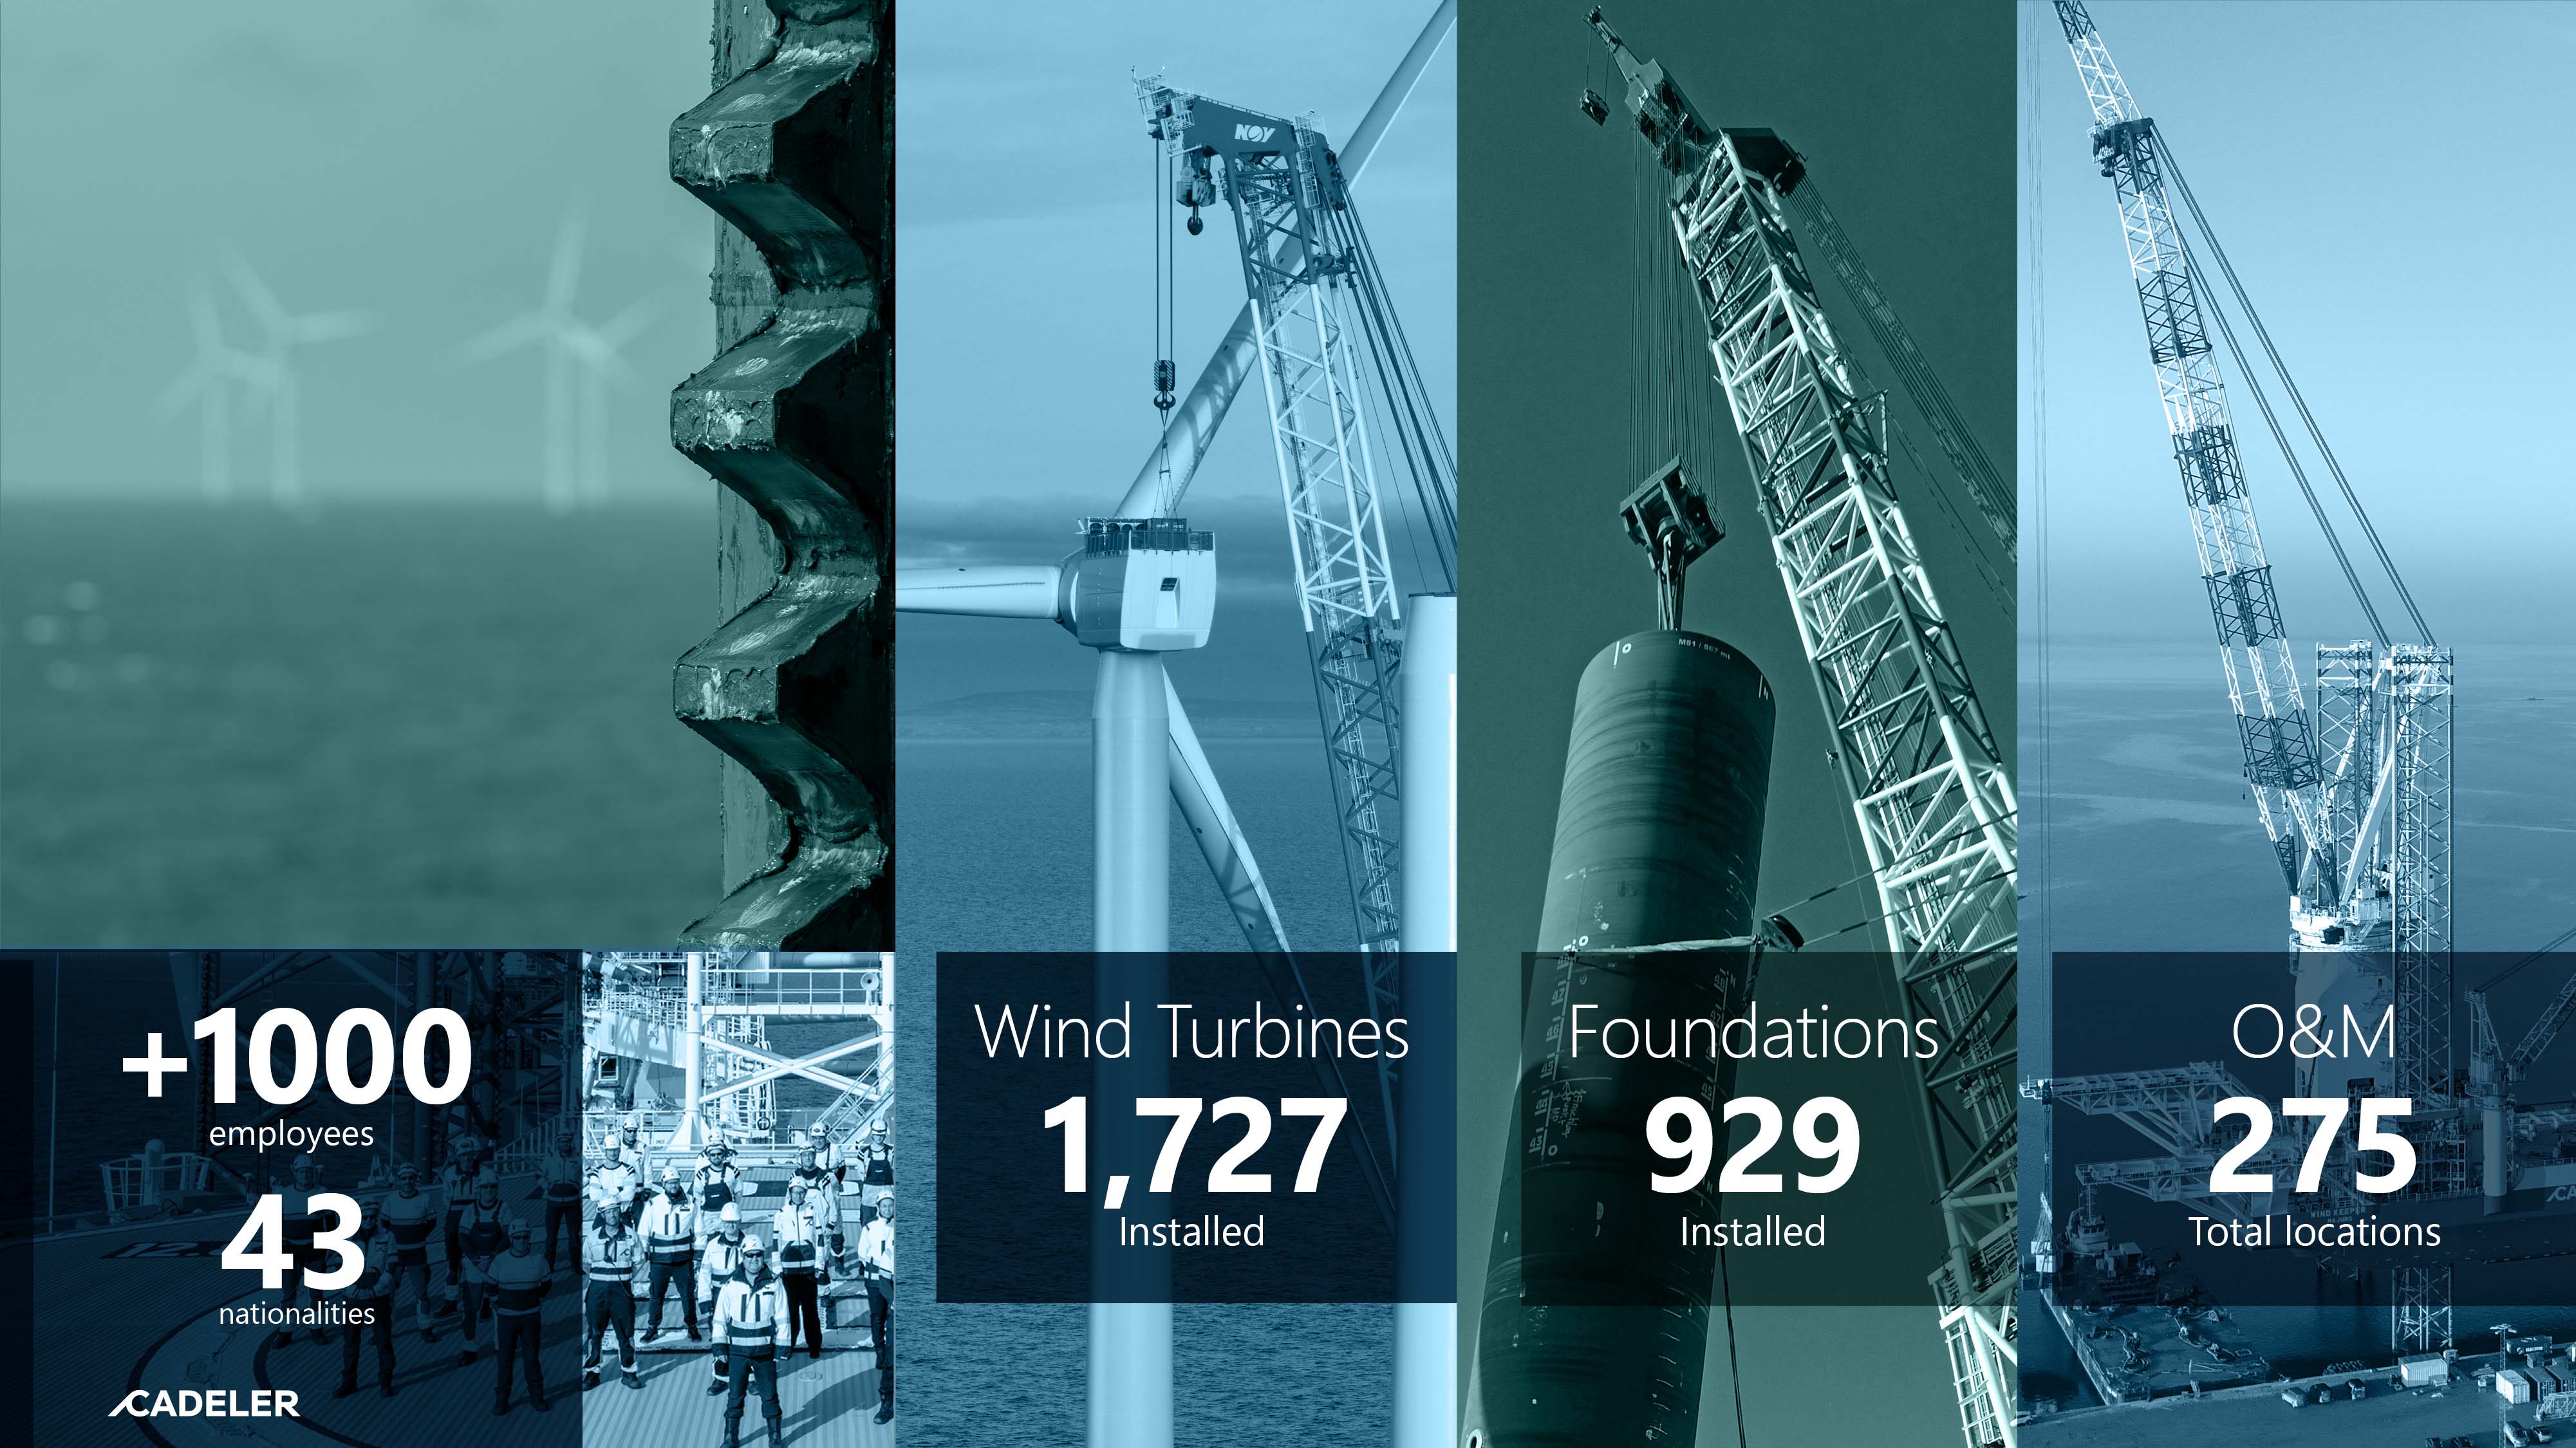
surpassing 1,000 employees by year-end.
Alongside this growth, Cadeler continued investing in recruitment,
leadership development, and operational capabilities to support an
increasingly complex global project portfolio. At the same time, we
strengthened a culture built on fairness, transparency and
responsibility, with a clear focus on delivering the best outcomes for
our clients.
Strong backlog and global opportunities
Cadeler further strengthened its order backlog in 2025 with the
signing of seven major contracts.
Europe remains our largest and most strategically important market,
supported by a strong pipeline of offshore wind projects. The United
Kingdom continues to play a central role in offshore wind
deployment, and Cadeler is engaged in several large projects in UK
waters, including Hornsea 3 and East Anglia TWO, both involving
full-scope foundation transport and installation.
At the same time, activity in newer markets continued to develop.
The Baltic Sea region saw steady progress, the Asia-Pacific pipeline
continued to mature, and Cadeler had two vessels operating in the
United States during the year.
Expanding operations and maintenance services
Demand for O&M services continued to grow in 2025, representing
approximately one-fifth of Cadeler’s revenue.
This growth reflects the rapid expansion of the global offshore wind
installed base and the increasing deployment of larger turbines.
These larger turbines require advanced maintenance capabilities
closely aligned with Cadeler’s fleet and operational expertise.
Over time, O&M represents an attractive structural growth
opportunity. It diversifies revenue streams, improves fleet utilisation
through long-term agreements, and provides operational continuity
between installation projects.
To support this development, Cadeler launched Nexra in 2025 as a
dedicated O&M service platform. Nexra strengthens client
partnerships and enables a more focused and scalable approach to
long-term service delivery.
The acquisition of Wind Keeper further enhanced these capabilities
and supports Cadeler’s ambition to provide specialised maintenance
services for the industry’s largest turbines.
5
Strengthening foundation capabilities
Cadeler’s capabilities in foundation transport and installation also
continued to advance. Building on experience from more than 900
installed offshore foundations, the company will begin execution of
the full-scope foundation campaign at Ørsted’s Hornsea 3 offshore
wind farm in early 2026.
This project represents another important step in integrating
Cadeler’s services across the offshore wind value chain.
Advancing sustainability
Responsible operations remain central to Cadeler’s long-term strategy.
With several newbuild vessels delivered to stringent environmental
standards, we continue to focus on reducing emissions intensity
across the fleet. Cadeler remains committed to reducing Scope 1
and Scope 2 emissions intensity by 50% by 2030 and achieving
net-zero operations by 2035.
During 2025, we advanced several initiatives to support these
ambitions, including the use of biofuel blends on our O-class
vessels, energy audits, shore-power upgrades, and preparations for
further technical retrofits. We also continued investing in crew
training to improve operational efficiency and support circular
practices across our operations.
Our human rights framework also progressed following our Human
Rights Impact Assessment, leading to governance enhancements
such as the establishment of a cross-functional CSR Leadership
Group and strengthened due-diligence procedures.
Outlook
Offshore wind remains one of the most scalable renewable energy
sources and will play an increasingly important role as global energy
systems electrify.
The industry experienced a period of recalibration in 2025 as
developers and governments addressed inflation, supply-chain
pressures and project financing challenges. In response, several
European governments refined auction frameworks to support
continued project development.
While some markets experienced short-term delays, commercial
visibility for Cadeler improved during the year. Our record order
backlog provides a strong foundation for activity in 2026 and 2027.
As offshore wind projects continue to scale, demand for high-
capacity installation vessels and specialised O&M services is
expected to increase. At the same time, the supply of capable
vessels is expected to tighten toward the end of the decade.
Cadeler enters this period from a position of strength. Supported by
a modern fleet, strong execution capabilities and a disciplined
approach to capital allocation, we remain focused on delivering
reliable installation capacity and long-term value for our clients,
partners and shareholders.
I would like to thank our clients for their continued trust, our
partners for their collaboration, and all Cadelers for their dedication
and professionalism.
Together we will continue supporting the global energy transition
while building a stronger and more resilient Cadeler.
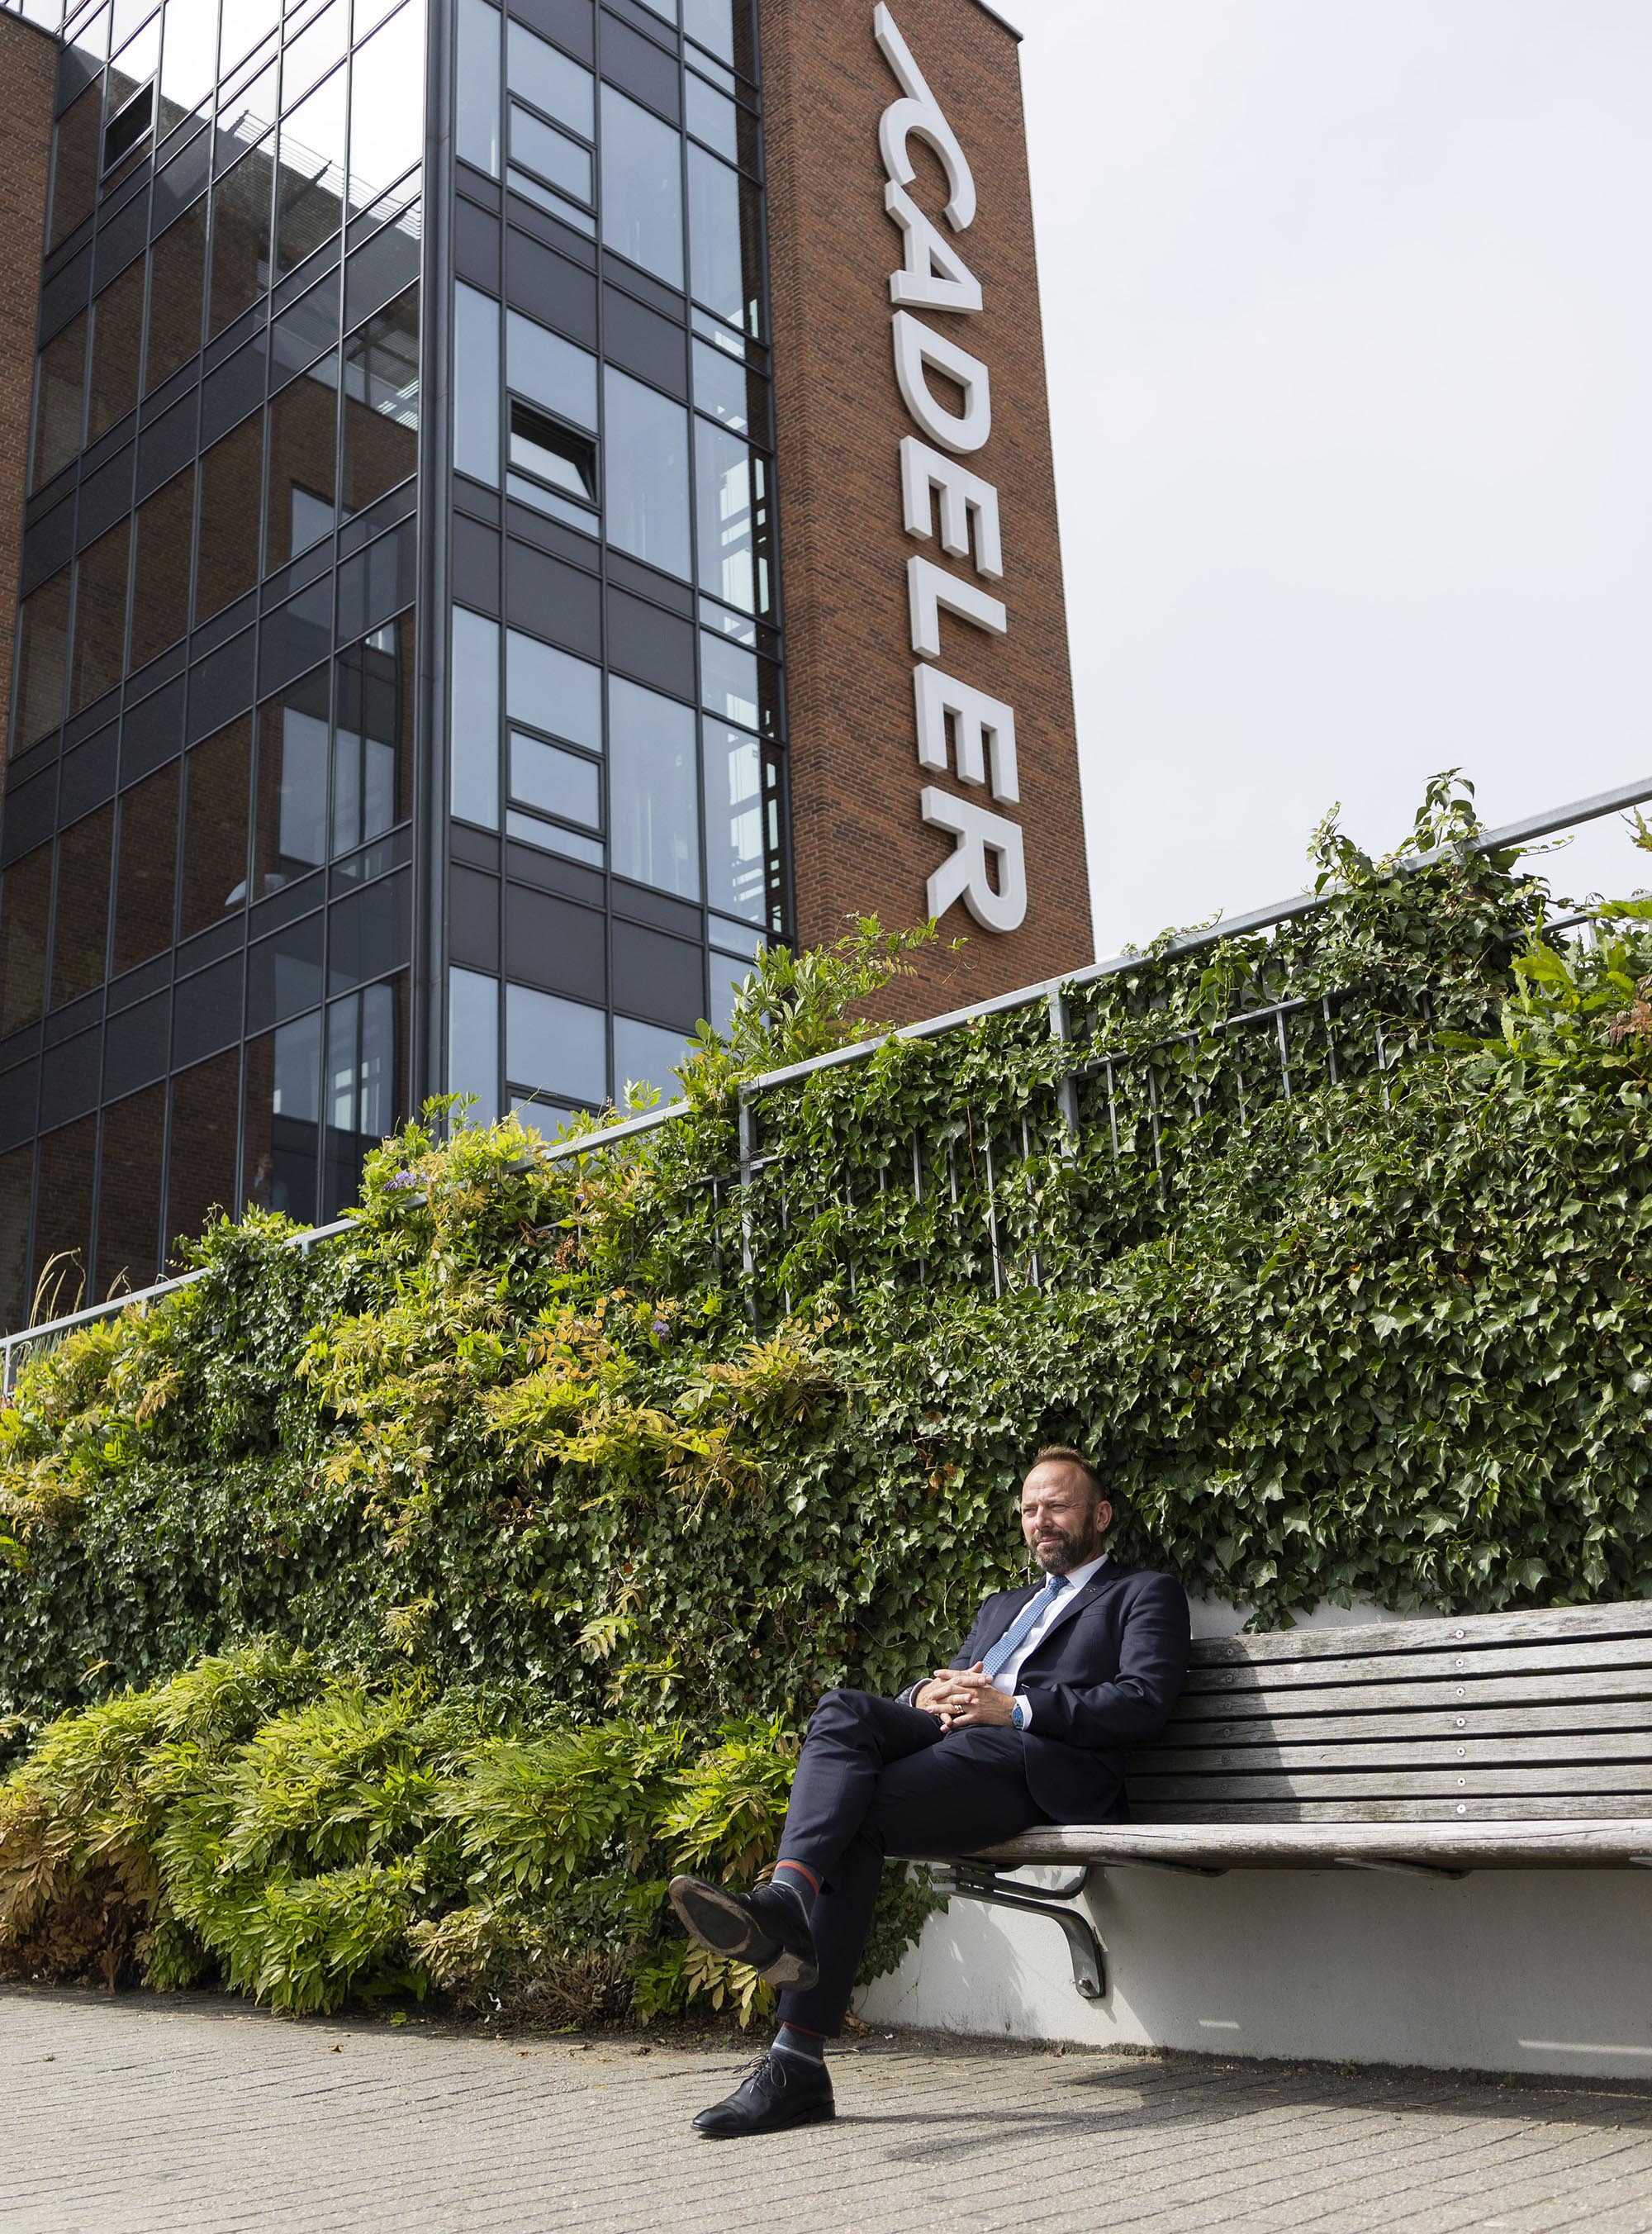
Mikkel Gleerup
CEO
6
Business Review
7
Business Review
Cadeler A/S ("Cadeler" or the "Company" and, together with its
subsidiaries, the "Cadeler Group" or the "Group") is a leading supplier
to the offshore wind industry, specialising in installation services and
operation and maintenance works. The Company offers marine and
engineering operations with a strong emphasis on safety and
environmental responsibility. Headquartered in Copenhagen,
Denmark, Cadeler provides high quality offshore wind support
services to clients in Europe, Asia, and the United States. The
Company maintains offices in Vejle (Denmark), Norwich (United
Kingdom), Taipei (Taiwan), Tokyo (Japan), and Virginia (United
States).
The Company’s shares are listed on the Oslo Stock Exchange
(symbol: CADLR). Cadeler’s American Depositary Shares (ADS) are
listed on the New York Stock Exchange (symbol: CDLR) and each
Cadeler ADS represents four (4) ordinary shares of Cadeler.
Cadeler's services encompass project management, operations and
maintenance, as well as decommissioning for the offshore wind
industry. The Company has solidified its leading market position
through its specialised fleet equipped with advanced, high-quality
equipment, a team of experienced professionals, and a strong
reputation for upholding the highest standards of safety, efficiency,
and precision.
8
This is Cadeler
What we do
Cadeler is a leading global partner in offshore
wind turbine transport and installation, owning
the world’s largest fleet of jack-up vessels.
Building on nearly two decades of experience,
we are now expanding our capabilities across
foundation transport and installation, and
operations and maintenance, to support the
evolving needs of the offshore wind sector.
9
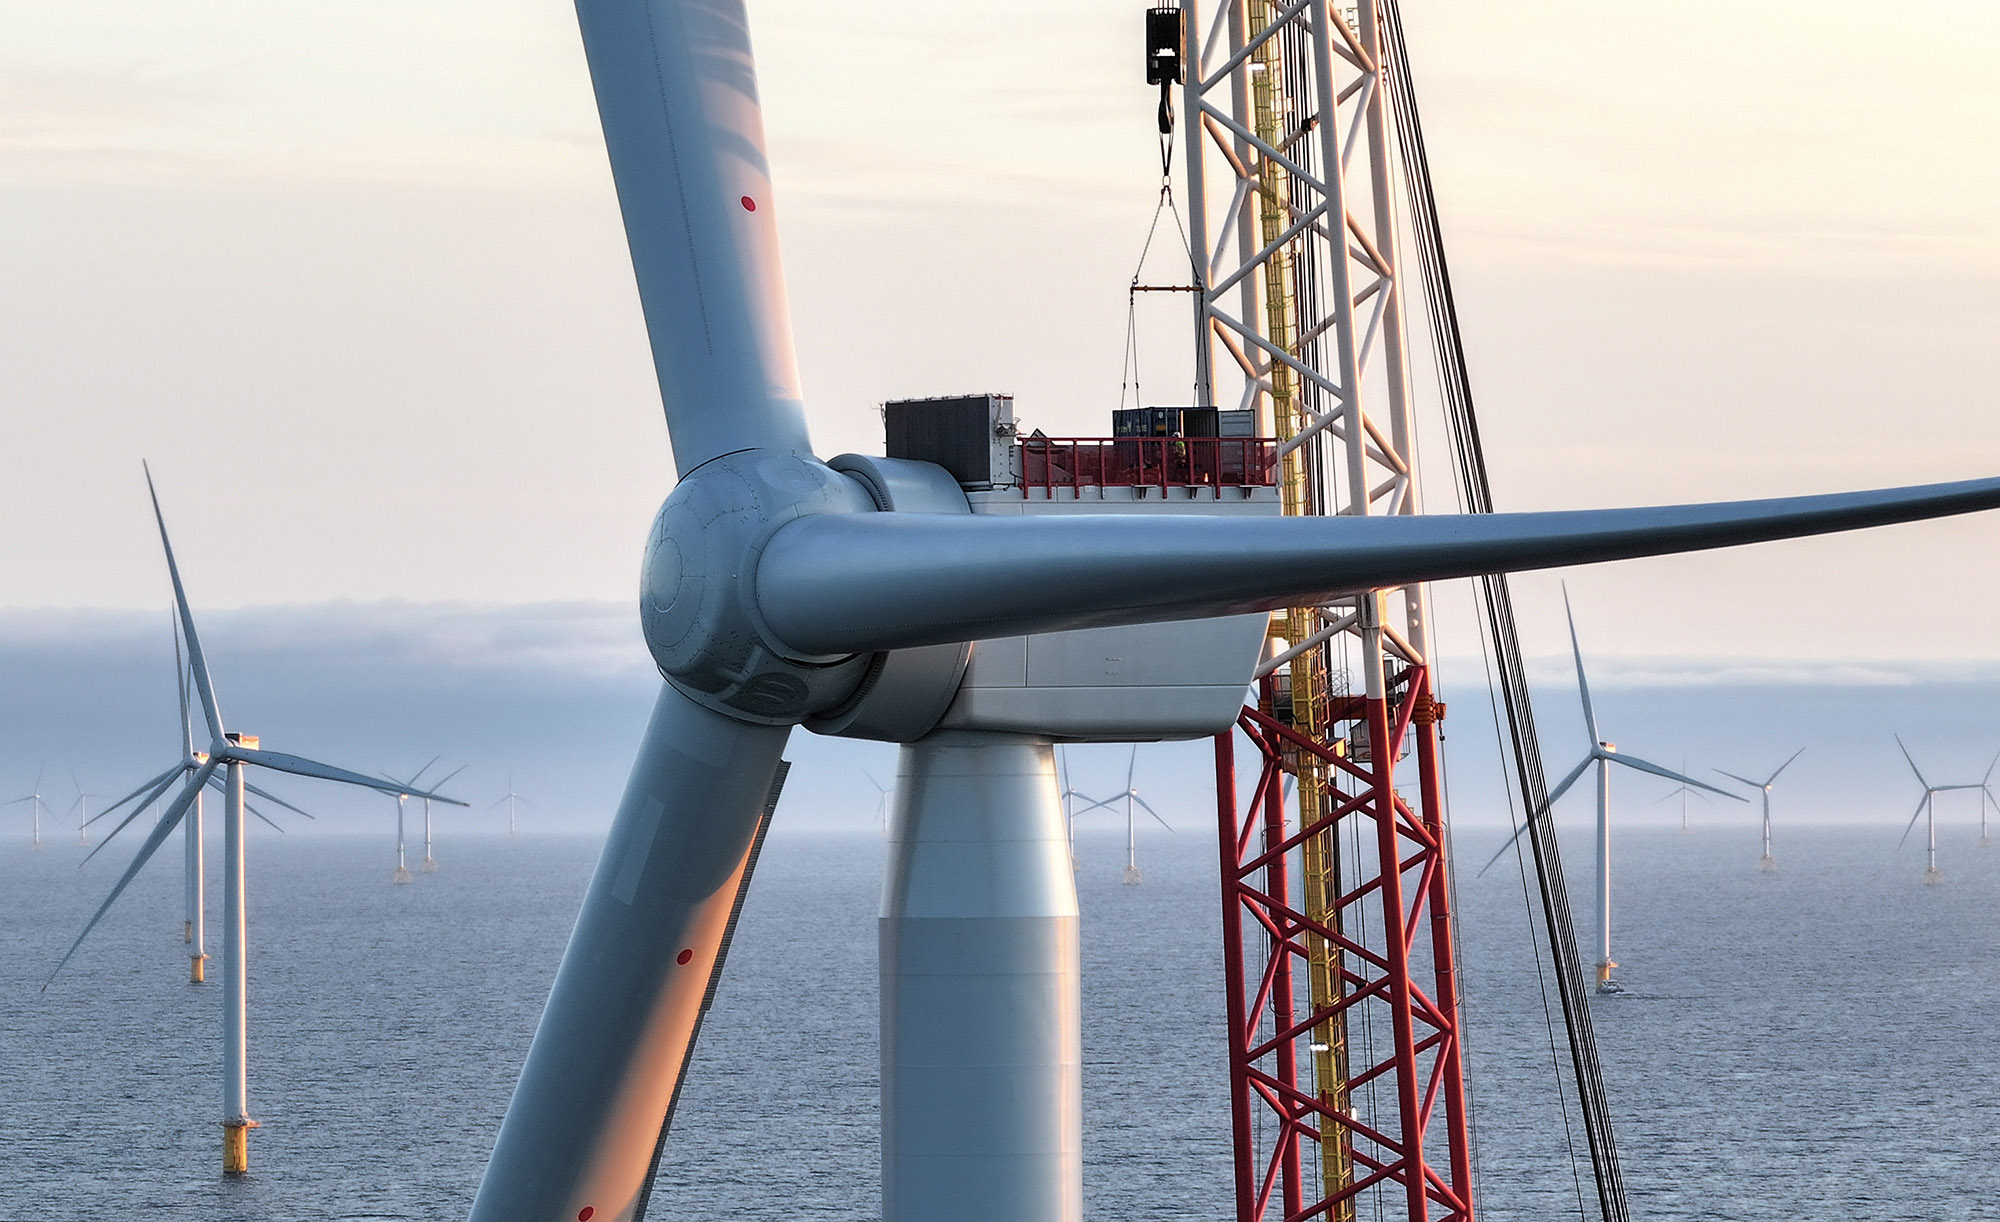
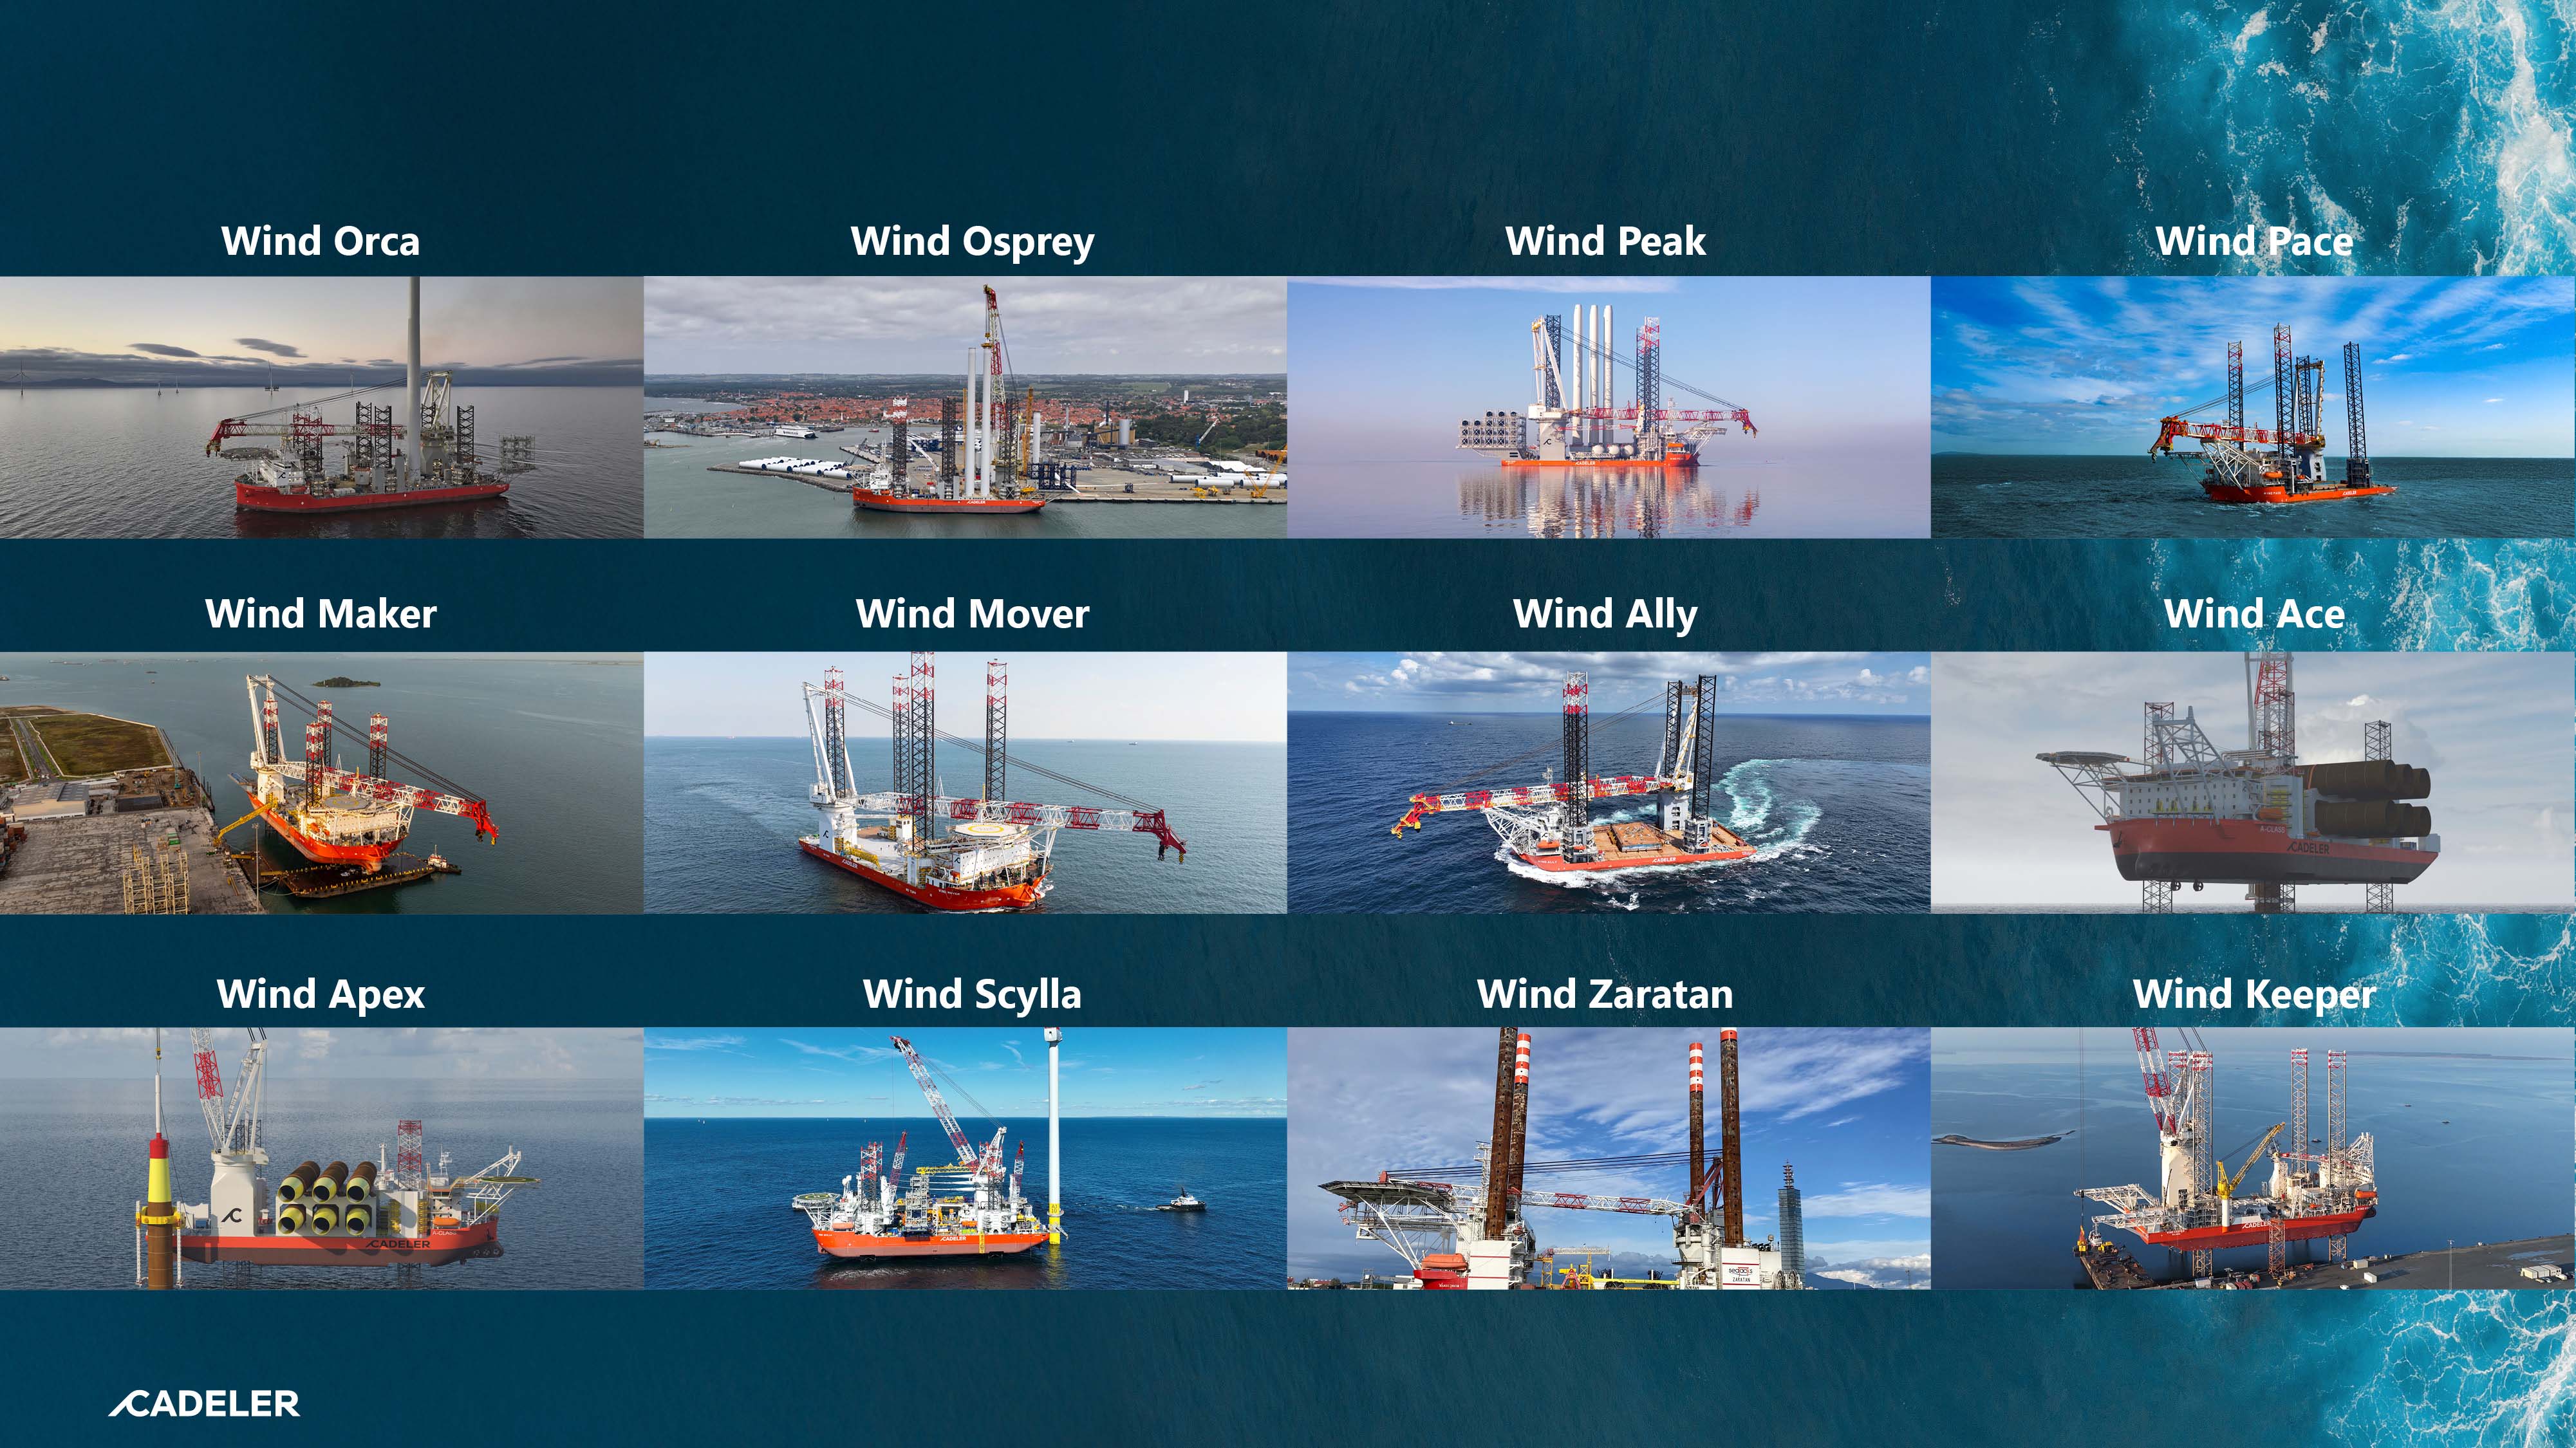
Our fleet
10
Our fleet
A diverse and modern fleet
Cadeler operates the world’s largest and most advanced fleet of
wind turbine transport and installation vessels. The fleet comprises a
range of specialised vessel classes designed to support offshore
wind projects throughout their operational lifetime.
Cadeler’s largest A-class vessels, represented today by Wind Ally,
with Wind Ace and Wind Apex under construction and scheduled
for delivery in 2026 and 2027, are hybrid units capable of installing
both offshore wind turbines and large monopile foundations. Their
design allows transport of multiple XXL monopiles and quick
conversion between turbine and foundation installation scopes.
Cadeler’s P-class and M-class vessels, Wind Peak, Wind Pace, Wind
Maker and Wind Mover, support high-capacity wind farm installation
scopes worldwide. Large deck space, substantial payload capacity, and
powerful heavy-lift cranes enable the efficient transport and installation
of the next-generation of 15-20MW+ offshore wind turbines.
Cadeler’s O-class vessels, Wind Orca and Wind Osprey, support both
installation and maintenance activities across offshore wind farms.
They are designed to operate on sites with challenging seabed
conditions, while their large payload capacity supports efficient
transport and installation of offshore wind components. In early 2024,
both vessels were upgraded with new main cranes, enabling the
efficient installation of the current generation of 15MW wind turbines.
Wind Keeper, Wind Scylla, and Wind Zaratan form the core of
Cadeler’s operations and maintenance (O&M) platform, even as
Wind Scylla and Wind Keeper remain active in the installation
market, demonstrating the depth and strength of Cadeler’s fleet.
Together, Cadeler’s vessels form a diverse and modern fleet,
capable of supporting Cadeler’s ambition to be the offshore wind
industry’s preferred partner across the operational lifecycle of the
next generation of offshore wind farm projects.
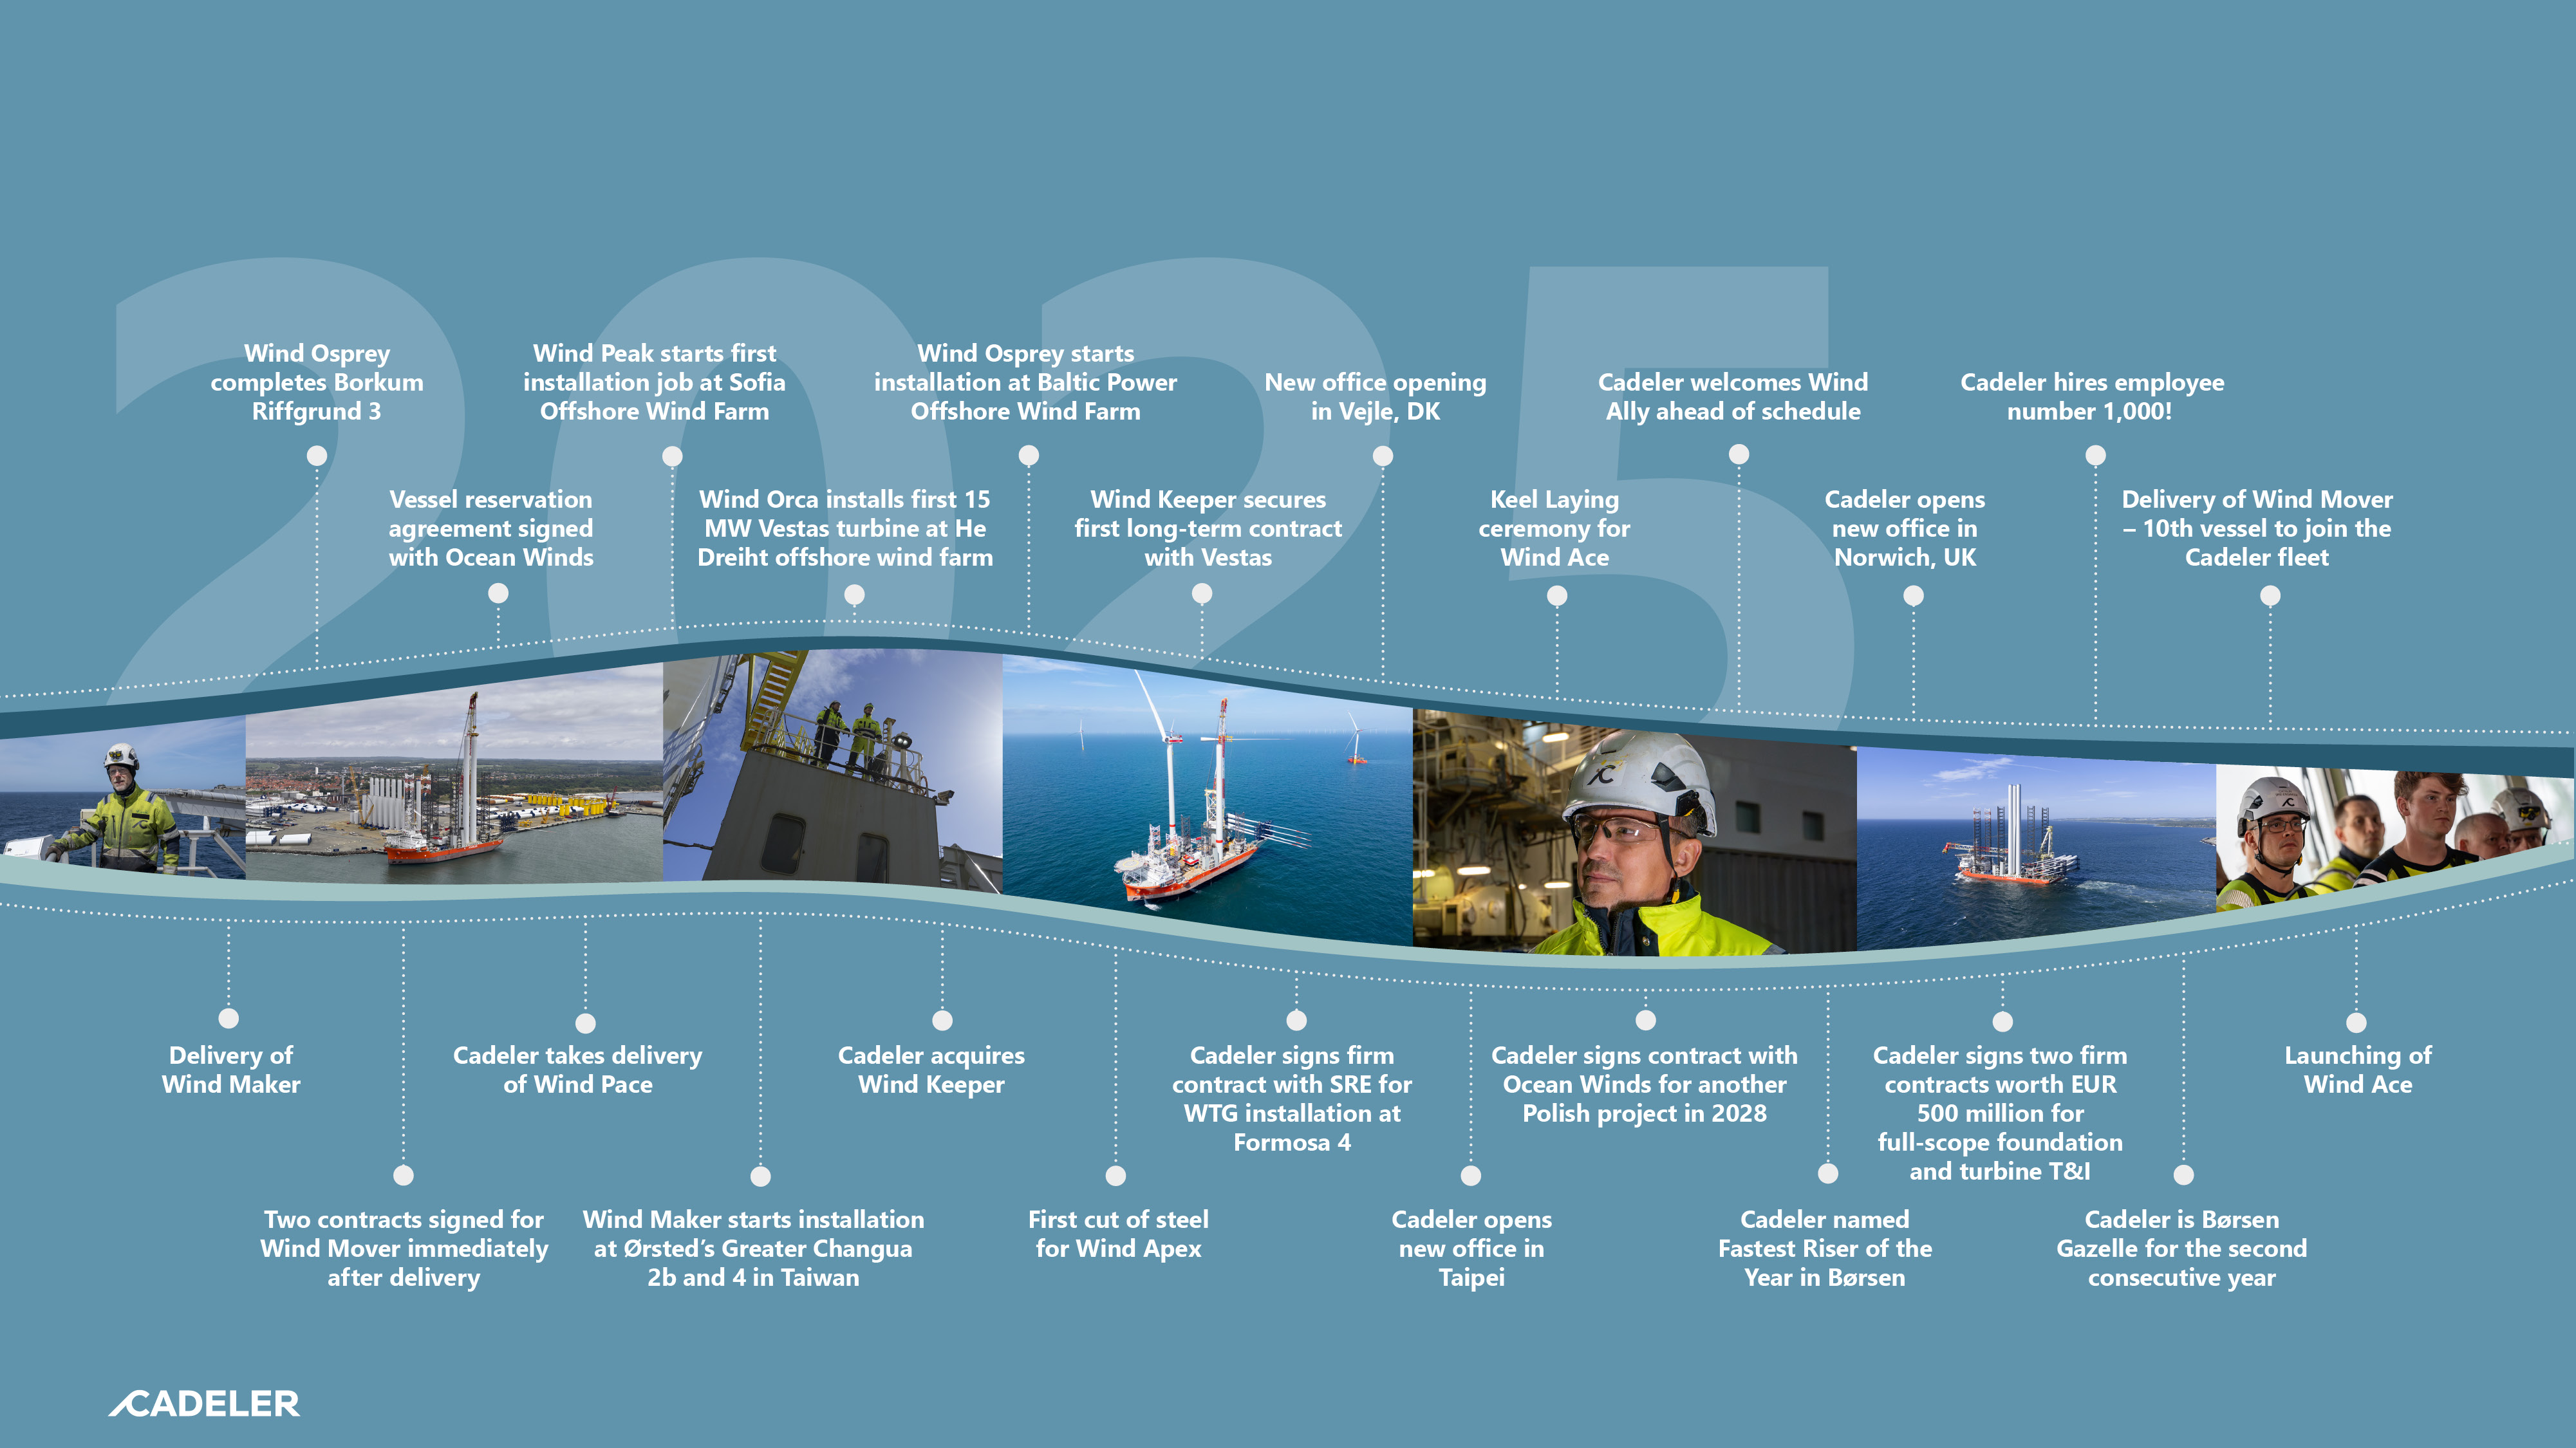
Fleet expansion in 2025
2025 marked a significant year of growth for Cadeler. During the
year, the company doubled the number of vessels on the water
from five to ten with the addition of Wind Maker, Wind Pace,
Wind Keeper, Wind Ally and Wind Mover. All vessels were
delivered on budget and on or ahead of schedule.
The newbuild programme reflects Cadeler’s long-term strategy of
investing in next-generation installation vessels capable of
transporting and installing the largest offshore wind turbines and
monopile foundations currently being deployed across the
industry. The expanded fleet strengthens Cadeler’s ability to
support clients across increasingly complex offshore wind projects
worldwide.
The year began with the delivery of Wind Maker in January 2025.
The vessel entered service immediately following delivery,
bringing additional installation capacity into operation at Ørsted’s
Greater Changhua 2b and 4 offshore wind farms in Taiwan.
In March, Cadeler took delivery of Wind Pace. The vessel was
mobilised for operations in the United States before completing
its campaign and returning to Europe, where it is preparing to
soon commence installation work at the East Anglia THREE
offshore wind farm.
Later in the year, Cadeler took delivery of Wind Ally, the first A-
class vessel designed for combined transportation and installation
of XXL offshore wind foundations. The vessel is currently being
mobilised to commence work on Ørsted’s Hornsea 3 project,
where Cadeler will deliver the full transportation and installation
scope for monopile foundations.
By year-end, Wind Mover was delivered ahead of schedule and is
preparing to commence transportation and installation operations
in European waters.
In addition to the delivery of newbuild vessels, Cadeler expanded
its fleet through the acquisition of Wind Keeper from the
secondary market in mid-2025. The vessel was promptly chartered
on a long-term contract of up to five and a half years,
strengthening Cadeler’s position in the O&M segment. Cadeler
completed its acquisition of Wind Keeper in July 2025, and the
vessel subsequently transited to Europe where she underwent
substantial upgrades, completed in February 2026.
Together, these additions reflect Cadeler’s strategy of maintaining
a diverse and modern fleet capable of supporting offshore wind
projects across installation and lifecycle services.
Strengthening O&M capabilities
In 2025, Cadeler established Nexra, its dedicated service platform
for the offshore wind aftermarket, with a team dedicated
exclusively to the provision of operations and maintenance
services. The launch of Nexra underlines Cadeler’s commitment to
deepening long-term client partnerships and strengthening its
operational focus in the O&M market. Combining technical
expertise with a flexible vessel portfolio, Nexra complements
Cadeler’s core installation activities, supporting efficient fleet-wide
utilisation while better catering to the needs of the Cadeler
Group’s clients across key offshore wind markets.
11
Our fleet
Delivery | ||||||||||
Class | Name | Crane capacity (tonnes) | WTG | FOU | O&M | Before 2025 | 2025 | 2026 | 2027 | Build |
A | Ally | >3,300 | ● | ● | ● | ● | 2025 | |||
Ace | ● | ● | ● | ● | 2026 | |||||
Apex | ● | ● | ● | ● | 2027 | |||||
P | Peak | >2,600 | ● | ● | ● | ● | 2024 | |||
Pace | ● | ● | ● | ● | 2025 | |||||
M | Maker | >2,600 | ● | ● | ● | ● | 2025 | |||
Mover | ● | ● | ● | ● | 2025 | |||||
O | Osprey | 1,600 | ● | ● | ● | 2013 | ||||
Orca | ● | ● | ● | 2012 | ||||||
Keeper | 2,200 | ● | ● | ● | 2024 | |||||
Scylla | 1,540 | ● | ● | ● | 2015 | |||||
Zaratan | 800 | ● | ● | 2012 | ||||||
●Capable ●Priority | ||||||||||
12
The Year 2025 in Brief
13
Financial Review

14
Key Financial Figures

Revenue
€620.4m


Equity ratio
44.0%

Utilisation (unadj.)
75%

EBITDA
Net profit
Backlog1
€425.3m
€280.2m
€2.8b
1.Contract Backlog including options as at 31 December 2025
15
Financial Highlights
Key Figures | |||||
EUR'000 | 2025 | 2024 | 2023 | 2022 | 2021 |
Revenue¹ | 620,354 | 248,738 | 108,622 | 106,424 | 60,938 |
Cost of sales | (236,755) | (124,228) | (59,858) | (49,537) | (38,879) |
Gross profit | 383,599 | 124,510 | 48,764 | 56,887 | 22,059 |
Operating profit | 317,743 | 69,444 | 14,443 | 41,191 | 11,134 |
Net financials | (29,879) | (1,967) | (2,945) | (5,650) | (3,696) |
Profit for the period | 280,184 | 65,069 | 11,498 | 35,541 | 7,451 |
Cash flow provided by operating activities | 394,200 | 93,103 | 63,383 | 29,036 | 30,200 |
Cash flow used in investing activities | (1,264,164) | (622,959) | (54,727) | (225,408) | (163,375) |
Of which investment in property, plant and equipment | (1,235,673) | (615,542) | (66,899) | (224,606) | (162,941) |
Cash flow provided by/(used in) financing activities | 967,690 | 481,986 | 70,268 | 213,075 | 71,847 |
Net (decrease)/increase in cash and cash equivalents | 97,726 | (47,870) | 78,924 | 16,703 | (61,328) |
Share related key figures | |||||
Earnings per share (EPS), EUR | 0.80 | 0.19 | 0.06 | 0.22 | 0.06 |
Diluted earnings per share (diluted EPS), EUR | 0.79 | 0.19 | 0.06 | 0.22 | 0.06 |
Operational metrics | |||||
Contracted days (no. of days) | 1,926 | 1,051 | 568 | 635 | 562 |
Utilisation (%) | 75% | 66% | 75% | 87% | 77% |
1 Consolidated revenue as of 31 December 2023 include EUR 3.4 million for 12 days from business combination with Eneti.
16
Financial Highlights
Continued from previous page
Key figures | 2025 | 2024 | 2023 | 2022 | 2021 |
EUR'000 | |||||
Total assets | 3,416,676 | 1,937,017 | 1,252,560 | 670,030 | 424,766 |
Non-current asset | 3,026,719 | 1,755,611 | 1,105,110 | 610,524 | 400,148 |
Total liabilities | 1,913,000 | 703,122 | 293,519 | 129,462 | 99,510 |
Equity | 1,503,676 | 1,233,894 | 959,041 | 540,568 | 325,256 |
Cash and cash equivalents | 151,679 | 51,253 | 96,608 | 19,012 | 2,308 |
Financial ratios and operational metrics | |||||
Return on assets (%) | 11.9% | 4.4% | 1.6% | 7.6% | 3.0% |
Return on equity (%) | 20.5% | 6.0% | 1.6% | 8.3% | 2.7% |
Equity ratio (%) | 44.0% | 63.7% | 76.6% | 80.7% | 76.6% |
Average number of employees | |||||
Onshore | 307 | 242 | 113 | 70 | 58 |
Offshore¹ | 586 | 364 | 182 | 162 | 12 |
1 Offshore crew members were hired directly by the Company from the end of November 2021. Average number of employees in 2021 reflect the number of seafarers divided by 12 months. The Company had 148 seafarers by the end of 2021.
17
Finance Review
Capital structure and assets
Equity
On 31 December 2025, equity amounted to EUR 1,504 million,
reflecting an increase of 22% from the balance as of 1 January 2025
(EUR 1,234 million in 2024 and EUR 959 million in 2023) as a result of
profit for the year of EUR 280 million (EUR 65 million in 2024 and EUR
11 million in 2023), and EUR 11 million loss from value adjustment of
hedges (EUR 23 million gain in 2024 and EUR 23 million loss in 2023).
As of 1 January 2025, all entities of the former Eneti Group changed
their functional currency from USD to EUR. The change reflects the
impact of Cadeler’s acquisition and subsequent changes to the
entities’ financing, organisation and activities. Based on these
changes, Management determined that the primary economic
environment in which these entities operate is now predominantly
EUR-denominated and that EUR therefore represents the most
appropriate functional currency.
Assets
As of 31 December 2025, the Company's total assets amounted to
EUR 3,417 million, a 76% increase for the reporting period, driven
principally by an increase in property, plant and equipment of EUR
1,225 million of which EUR 1,255 million relates to the Group’s
newbuild programmes. Additions to property, plant, and equipment
are described in Note 13.
Property, Plant and Equipment
The Cadeler Group’s property, plant, and equipment increased to
EUR 3.0 billion in 2025, up from EUR 1.7 billion in 2024. This primarily
comprised the newbuild vessels under construction. The Cadeler
Group does not own any substantial real estate. The Cadeler Group is
currently leasing its headquarters in Copenhagen. The Group entered
into additional lease agreements for office premises in other
locations. A new lease agreement was concluded for office facilities in
Norwich, effective March 2025, Cadeler also entered into leases for
office premises in Monaco and Taiwan, and Vejle, Denmark.
The Fleet
As of 31 December 2025, the Cadeler Group’s fleet consists of nine
operating vessels, one A-class Vessel (Wind Ally), two P-class Vessels
(Wind Peak and Wind Pace), two M-class Vessels (Wind Maker and
Wind Mover), two O-class Vessels (Wind Orca and Wind Osprey),
Wind Scylla and Wind Zaratan. Moreover, in 2025, acquired Wind
Keeper, a newly-constructed vessel which, following upgrades, will be
well-suited for the global O&M market, enabling Cadeler to meet
growing after market demand while enhancing fleet flexibility.
Funding
At the end of the reporting period, EUR 148 million from the RCF
remains unutilised.
The Company had significant headroom to comply with its debt
covenants and on 31 December 2025, the Company had available
liquidity of EUR 343 million from cash at hand and available
committed facilities including the Green Corporate Facility. The
Cadeler Group’s management anticipates seeking further debt
financing in connection with milestone payments for the delivery of
the Cadeler Group’s third A-class newbuild, due to be delivered in Q2
2027.
18
Finance Review
Continued from previous page
Income statement and cash flows
Profit for the year
The Group’s result for the year was a profit of EUR 280 million, representing an increase of EUR 215 million
compared to the EUR 65 million profit earned in 2024. This result was principally driven by higher gross
profit. In 2025, gross profit amounted to EUR 384 million, corresponding to a gross margin of 62%, up from
a gross margin of 50% in 2024, reflecting improved profitability principally due to the receipt of termination
fees under a Long-Term Agreement (LTA) and an increase in operating vessels in the year along with an
increase in vessel utilisation.
Revenue
The Group’s revenue for the year amounted to EUR 620 million, reflecting an increase of EUR 372 million
compared to the EUR 249 million revenue reported in 2024, driven principally by the increased revenue
from fleet expansion and higher utilisation, and the receipt of termination fees under the LTA. On 1 July
2025, the Company issued revised full-year guidance indicating that it expected 2025 revenue to range
between EUR 588 million and EUR 628 million; the actual revenue for the year is within this guidance.
Cadeler's order book for 2026 is substantially filled. As of March 2026, the contract backlog stood as follows:
EUR million | Within 1 year | After 1 year | Total |
Contract backlog including options as of 31 December 2025 | 846 | 1,919 | 2,765 |
Additions in the period 1 January 2026 to 24 March 2026: | |||
Firm, excluding options | 52 | — | 52 |
Options considered as contingent considerations for revenue recognition purposes | 5 | — | 5 |
Options not considered as contingent considerations for revenue recognition purposes | 5 | — | 5 |
Contract backlog including options as of 24 March, unadjusted for services provided during the period 1 January - 24 March 2026¹ | 908 | 1,919 | 2,827 |
Refer to Note 3 for further information regarding the total contract backlog at 31 December 2025.
1 As of the report release date, 80% of the contract backlog (an aggregate of EUR 2,259 million) relates to projects for which the
relevant counterparty has taken a positive final investment decision (FID), while an aggregate of EUR 568 million remains subject to
counterparty FID.
19
Finance Review
Continued from previous page
Costs
Amounting to EUR 237 million, the Group’s cost of sales for 2025 was
EUR 113 million higher than the EUR 124 million reported for 2024,
driven mainly by the addition of newly built vessels becoming part of
the Group’s fleet and operating in the market.
Administrative expenses in 2025 amounted to EUR 75 million, an
increase from the EUR 57 million in 2024. This was primarily driven by
the Group’s increasing headcount, including the strategic recruitment
of key personnel to ensure an elevated level of support for ongoing
operations and significant new projects.
EBITDA
The Group’s EBITDA for the year amounted to EUR 425 million,
reflecting an increase of EUR 299 million from EUR 126 million in
2024, as disclosed in the Alternative Performance Measures (APM)
section, slightly exceeding the revised EBITDA guidance ranging
between EUR 381 million and EUR 421 million. Adjusted EBITDA,
which excludes transaction costs related to the business combination
with Eneti, was EUR 50 million in 2023, as disclosed in the APM
section. The Group does not report adjusted EBITDA for 2025 or
2024.
Financial Income and Expenses
Financial income, amounting to EUR 7 million, was EUR 2 million
higher in 2025 than the EUR 5 million financial income in 2024,
mainly driven by a EUR 4 million increase in foreign exchange gains
and a EUR (2) million decrease in interest income. Financial costs in
2025 amounted to EUR 37 million, EUR 30 million higher than the
EUR 7 million reported in 2024, primarily explained by a EUR 18.8
million increase of interest linked to debt facilities due to more
outstanding debt as a result of new vessels, and a EUR 8 million
increase in foreign exchange losses.
Cash flows
Net cash flow from operating activities amounted to EUR 394 million
in 2025, EUR 301 million higher than the EUR 93 million recorded in
2024, driven by increased operating profit and deferred revenue.
Net cash flow used in investing activities was EUR 1,264 million in
2025, representing an increase of EUR 641 million compared to the
EUR 623 million reported in 2024. The increase was driven by large
asset investments, including the final instalments of Wind Maker,
Wind Pace, Wind Ally and Wind Mover, other vessel upgrades and
instalment payments for certain of the Group's vessels under
construction.
Net cash flow from financing activities in 2025 was EUR 968 million,
an increase of EUR 486 million compared to a net inflow of EUR 482
million reported in 2024. This increase was driven by proceeds from
borrowings of EUR 1.3 billion net of bank fees and partially offset by
the increased interest paid and repayments.
Parent Company
Cadeler A/S, the Parent Company, reported a net profit of EUR 114
million, an increase from the EUR 20 million reported in 2024. The
Parent Company’s revenue in 2025 amounted to EUR 422 million, an
increase from the EUR 127 million in 2024. This performance exceeds
the projected revenue range for 2025, as disclosed in the Group's
Annual Report 2024, which was between EUR 280 million and EUR
320 million due to the receipt of termination fees under a Long-Term
Agreement (LTA).
Total expenses for the Parent Company in 2025 amount to EUR 277
million (EUR 116 million in 2024). As the Group’s vessels are owned
by subsidiaries of the Parent Company, no vessel depreciation or
vessel insurance expenses are recognised in the Parent Company.
Instead, the Parent Company is subject to bareboat charges from
vessel owning subsidiaries, amounting to EUR 135 million in 2025
(EUR 43 million in 2024).
As of 31 December 2025, total assets amounted to EUR 1.9 billion
(EUR 1.7 billion in 2024). The increase in the Parent Company’s
assets is primarily driven by a EUR 114 million decrease in property,
plant and equipment along with an increase in investments in
subsidiaries.
Total liabilities in 2025 amounted to EUR 628 million (EUR 599
million in 2024) driven by an increase of EUR 81 million in debt to
credit institutions and a decrease of EUR 152 million in payables to
subsidiaries. Equity amounted to EUR 1.3 billion (EUR 1,134 million in
2024), compared to the Group’s EUR 1.5 billion (EUR 1,234 million in
2024).
20
Finance Review
Continued from previous page
Knowledge resources
The Company is committed to attracting and retaining highly skilled
professionals to meet the needs of its customers and provide
exceptional service. This includes recruiting experienced engineers
who can adapt the Company's vessels to meet the specific
requirements of customer projects, as well as commercial experts
with relevant industry knowledge. The Company's ongoing
investment in talent enables it to maintain a competitive edge in the
market and position itself for long-term success.
Research and development activities
The Company's research and development efforts focus on advancing
fleet capabilities and developing innovative solutions to optimize offshore
wind operations. Continued investment in research and development
strengthens The Company’s competitive position, enhances efficiency,
and ensures alignment with evolving customer needs. These initiatives
remain key drivers of long-term growth and success.
Data ethics
As per section 99D of the Danish Financial Statements Act, Cadeler as
a listed company is obliged to disclose its policy on data ethics. For
further information, see the sustainability statements (page 38).
Impact on the external environment
Sustainability remains a strategic priority for the Company and is key
to its ability to create long-term value for its shareholders. It
represents an opportunity for innovation, improved efficiency and a
foundation for growth. The Company strives to identify and reduce
the negative impact that its business has on the environment and
local communities and is committed to demonstrating leadership in
matters of environment, health and safety, employment, and
corporate responsibility across its value chain.
The Company pursues the long-term goals relating to
decarbonisation and improved circularity of its operations. These are
pursued, inter alia, through improvements to the operating fleet and
optimized vessel design for the newbuild vessels, including energy-
efficient solutions or the adoption of alternative fuels. The Company
is working on ensuring continuous improvements by actively
monitoring performance.
As environmental regulations evolve, maintaining vessel compliance
with International Convention for the Prevention of Pollution from
Ships (MARPOL) requirements and operating on low-sulphur fuels,
IMO and EU targets, and CSRD reporting requirements, remain key
priorities for the Company. The Company also prioritises
collaboration with business partners and engagements across the
value chain to enhance sustainability practices across the industry.
For further information, see the sustainability statements (pages
21
2026 Outlook
Cadeler will continue to provide construction, maintenance,
decommissioning and other services for the renewable offshore wind
industry. The financial performance of the Group for 2026 is expected
to result in a revenue of between EUR 854 million and EUR 944
million, compared with a revenue of EUR 620 million in 2025. EBITDA
is expected to be in the range of EUR 420 million to EUR 510 million
million in 2026 (in 2025 EUR 425 million).
Going into 2026, Cadeler continues to strengthen its position as the
leading T&I contractor in the attractive offshore wind market. Over the
past year, the sector has experienced continued negative sentiment
and political headwinds in the United States. In other regions, markets
are recalibrating as governments and developers adjust auction
timelines and frameworks to reflect evolving market conditions. The
fundamentals of offshore wind remain strong and highly competitive
compared to alternative energy sources, which is substantiated by
high long-term targets in key offshore wind markets. This is supported
by positive development in Europe including the record-breaking UK
AR7 auction, awarding over 8GW of capacity. Additionally, European
governments have connected to accelerate offshore wind expansion
through cross-border projects: at the North Sea Summit in Hamburg
on January 26, 2026, nine North Sea countries (including the UK,
Germany, France, and Denmark) committed to the delivery of 15 GW
of offshore wind per year for the 2031-2040 period and to a goal of
installing 300 GW of offshore wind by 2050. Cadeler expects that the
undersupply of installation vessels will continue to increase, as the
current fleet is aging and becoming inefficient.
Cadeler is experiencing strong demand for our growing fleet. The
backlog now stands at EUR 2,827 million compared to EUR 2,336
million last year. The business of Cadeler is inherently long-term
focused, with project bidding now stretching into the 2030s. Europe
remains the cornerstone region for offshore wind and Cadeler, with
other regions like Asia Pacific increasing significantly in scale – both
on existing and new markets. Furthermore, the long-term
development of the U.S. and other markets in the Americas continue
to have a long-term potential despite short-term setbacks.
Cadeler continues to have an optimistic outlook on the market for
our core segments, wind turbine and foundation installation and
heavy operations & maintenance. Following the successful merger
with Eneti in 2023 and the acquisition of the new jack-up vessel
Wind Keeper in 2025, Cadeler is the owner of the largest purpose-
built fleet in the industry, with ten vessels currently in operation and
two more being delivered in 2026 and 2027. In addition, Cadeler has
established a dedicated O&M service platform, Nexra, in 2025 which
is expecting to significantly benefit from the growing demand for
major component replacement services and provide additional value
to clients. Operating the largest and most capable fleet brings
significant scale advantages by being able to cross-utilise our fleet,
reuse seafastening and tooling to deliver operational efficiency and
cost savings. These advantages will only continue to strengthen as
the newbuild fleet is being delivered.
Cadeler's guidance for 2026 is subject to risks and uncertainties,
many of which are beyond its control. One-off market-shaping
events such as strikes, embargoes, political instability or adverse
weather conditions, could have a substantial impact on the
business. There could also be off-hire periods as a consequence of
accidents, technical breakdown or non-performance. The
cancellation or postponement of one or more vessel employment
contracts could have a material adverse impact on the earnings of
the Company.
22
Governance
23
Risks
Special risks
Operational risks
The Cadeler Group generates revenue by utilizing its fleet for the
transportation and installation of offshore wind turbine generators and
foundations, and the provision of maintenance services in the offshore
wind industry. The Company is vulnerable to a loss of revenue if any of
its vessels are taken out of operation or if the delivery of its newbuilds
is delayed. As of the date of this Annual Report 2025, the Company's
fleet consists of 10 WTIV: Wind Orca, Wind Osprey, Wind Scylla, Wind
Zaratan, Wind Keeper, Wind Peak, Wind Pace, Wind Maker, Wind
Mover and Wind Ally. The Company also has orders for two newbuild
vessels currently under construction: Wind Ace and Wind Apex.
If any of the Cadeler Group’s vessels or, once delivered, its newbuilds, are
temporarily or permanently taken out of operation, or if its newbuilds are
delayed in delivery, this could result the loss of the revenue that would
otherwise be generated by that vessel. In addition to a potential loss of
revenue, the Cadeler Group could also be liable to its customers for
liquidated damages under the charters that the Cadeler Group enters
into with respect to its vessels. The loss of revenue and liability to its
charterers could have a material adverse impact on the Cadeler Group’s
business, prospects and financial results and condition, including its ability
to comply with the financial covenants under its financing arrangements.
The Company has contracted with COSCO Shipping Heavy Industry
Co., Ltd. (COSCO) for its newbuild A-class vessels, the first of which is
expected to be delivered in H1 2026 and the second in Q2 2027. Any
problems that may impact China and its economy in general, the
availability of components or materials needed, or the COSCO
shipyard specifically, could lead to delays affecting one or both
newbuild vessels. The Cadeler Group’s existing vessels also require
upgrades, refurbishments, and/or repairs from time to time that
potentially entail risks, including delays and cost over-runs, and could
have an adverse impact on the Company's available cash resources
and results of operations.
The Cadeler Group operates in the offshore industry and is therefore
subject to inherent hazards, such as equipment breakdowns,
technical problems, harsh weather conditions, environmental
pollution, force majeure situations (nationwide or port-specific strikes,
etc.), accidents (including dropped objects), collisions and
groundings. These hazards can cause personal injury or loss of life,
severe damage to or destruction of property and equipment,
pollution or environmental damage, third parties or customer claims,
and suspension of operations.
WTIVs, including the Cadeler Group’s vessels, are also subject to
hazards inherent in marine operations, either while on-site or during
mobilisation, including—but not limited to—capsizing, sinking,
grounding, collision, damage from severe weather and marine life
infestations. Operations may also be suspended because of
machinery breakdowns, abnormal operating conditions, failure of
subcontractors to perform or supply goods or services or personnel
shortages.
Employment of vessels is key
The Cadeler Group’s income is dependent on project contracts and
vessel charters for the employment of its vessels. Typically, these
contracts are concluded several years in advance, providing visibility
of future deployment. The Cadeler Group has a contract backlog of
existing customer contracts that imply revenues in the future, both
for “firm” contracted days and, typically, “option” days (days that are
callable at the relevant customer’s option). Such contracts, and the
revenues derived therefrom, are subject to various terms and
conditions, including certain cancellation events, and the exercise of
options is exclusively at the discretion of the relevant customer. Such
contracts could be subject to termination, amendments and/or delays
resulting in revenues being reduced, deferred or not realised at all.
In addition, there is a risk that the Company may find it difficult to
obtain future employment for its vessels which could result in
utilisation to subsequently drop. Consequently, the vessels may need
to be deployed on lower-yielding work-scopes or remain idle for
periods without any compensation to the Company. There may also
be off-hire periods as a consequence of accidents, technical
breakdown or non-performance. The cancellation or postponement
of one or more employment contracts could have a material adverse
impact on the Company’s earnings.
Low demand in market
The Cadeler Group relies on revenue generated from wind farm
installation and related maintenance. The limited diversification in
Cadeler’s sources of revenue makes the Cadeler Group vulnerable to
adverse developments or periods of low market demand. Demand
for the Cadeler Group’s services may be volatile and subject to
variation for a number of reasons, including uncertainty in future
demand and regulatory changes. For example, the market for
offshore wind energy has recently experienced certain challenges in
various jurisdictions including the United States, Denmark, the
Netherlands as well as other markets, including delays in relevant
supply chains, cancellation of contracts and failed government
auction rounds, which could adversely affect the number of offshore
wind farm projects to be developed in these markets in the future.
There is a risk that similar challenges could also affect other countries.
Any oversupply of vessels compared to the market demand for such
vessels or similar capacity could cause contract rates to decline.
Falling rates could materially and adversely affect the Cadeler Group’s
financial performance and results of operations. As the Cadeler
Group’s vessels are highly specialised for wind farm installation,
redeployment to other sectors of the marine industry may be difficult
or impossible to achieve, both practically and commercially.
24
Risks
Continued from previous page
Macroeconomic risks
The Cadeler Group is exposed to macroeconomic and geopolitical
risks, including global uncertainties due to high public debt levels,
persistent inflation and elevated interest rates, the war in Ukraine,
recent developments and heightened public and diplomatic focus on
Greenland and Arctic security, the imposition of sanctions against
Russia, conflict in the Middle East, European energy crises and supply
chain disruptions. Specifically, delays in the delivery of newbuilds may
arise from issues at COSCO, a Chinese shipyard, or from geopolitical
tensions involving China. These macroeconomic and geopolitical
factors could materially affect the Cadeler Group's business, financial
results, and future prospects.
The wind energy market is influenced by the price and availability of other
energy sources, including nuclear, coal, natural gas and oil, as well as
other sources of renewable energy. To the extent that renewable energy,
and in particular wind energy, becomes less cost-competitive due to
reduced government targets, increased costs, new regulations or
incentives favoring alternative renewable energy, or the availability of
cheaper, more efficient or otherwise more attractive alternatives, demand
for wind energy and other forms of renewable energy could decrease.
Slow growth or a long-term reduction in the demand for wind energy
could in turn reduce the demand for the Cadeler Group’s services, which
could have a material adverse effect on the Cadeler Group’s business,
prospects and financial results and condition.
Debt facility risks
The Cadeler Group has entered, and will in the future enter into, various
debt financing agreements. The Cadeler Group’s level of indebtedness
exposes it to certain risks, including increased vulnerability to general
adverse economic and industry conditions. In addition, the Cadeler
Group’s indebtedness requires the Cadeler Group to dedicate a portion
of its cash flow from operations to debt payments, thereby reducing the
availability of cash flow to fund working capital, capital expenditures,
acquisitions, investments, and other general corporate purposes, and
potentially limiting its ability to borrow additional funds or to borrow
funds at rates or on other terms it finds acceptable.
The agreements governing the Cadeler Group’s indebtedness contain
(and it is expected that any agreements governing any additional debt
that the Cadeler Group may incur or assume would contain) various
operating and financial covenants relating to the business of the
Cadeler Group. For instance, there are specific financial covenants in
certain of the Cadeler Group’s debt facilities relating to minimum
liquidity of the Cadeler Group, the Cadeler Group’s equity ratio and its
working capital. Certain of the Cadeler Group’s debt facilities also
include financial covenants relating to the fair market value of its
vessels. Any failure to comply with such covenants may result in an
event of default under such agreements, which may allow the
applicable creditors to accelerate the related debt. Such acceleration
could trigger cross-acceleration or cross-default provisions in the
Cadeler Group’s other debt facilities.
Liquidity risks
The Company manages liquidity risk by maintaining sufficient cash
and access to committed credit facilities to meet its operational
needs and installment payment obligations in respect of its newbuild
vessels. The Cadeler Group’s management anticipates seeking further
debt financing in connection with milestone payments for the
delivery of the Cadeler Group’s third A-class newbuild, due to be
delivered in Q2 2027.
Foreign exchange risks
The Company is exposed to foreign currency risks. A significant
portion of income is invoiced in EUR, as are most costs, or in DKK,
which is pegged to the EUR. As a result of the business combination,
certain income is invoiced in USD. A significant proportion of the
Company's commitments for the construction of newbuild vessels is
payable in USD. The foreign exchange exposure arising from the
newbuild contracts has been partially swapped into EUR through the
Company’s banks at an average USD:EUR rate of 0.8586. Another
portion of the exposure has been hedged through zero-cost collar
contracts, securing an average USD:EUR exchange rate range
between 0.8607 and 0.9092.
25
Risks
Continued from previous page
Interest rate risks
The Cadeler Group’s performance is affected by changes in
interest rates. The margin on the Cadeler Group’s debt facilities is
generally expressed as a floating rate. It is the Cadeler Group’s
policy to hedge up to 50% of such interest rate risk. In addition to
direct impacts on the Cadeler Group, changes in interest rates
may indirectly impact Cadeler’s results by reducing general rates
of economic growth and increasing the cost of capital for capital-
intensive development projects, such as offshore wind farms,
thereby reducing the attractiveness of such projects and demand
for the Cadeler Group’s services.
Credit risks
The Company adopts stringent procedures when extending credit
terms to customers and in the monitoring of credit risk. The
Company deals only with customers that have an appropriate
credit history and seeks to obtain sufficient security, where
appropriate, to mitigate credit risk. Historically, only immaterial
credit losses have been incurred.
Laws and regulations risks
The Cadeler Group and its business are subject to laws and regulations
governing the offshore industry. Future changes in the domestic and
international laws and regulations applicable to the Cadeler Group and
its activities are unpredictable and beyond the Cadeler Group’s
control. Such changes could imply the need to materially alter the
Cadeler Group’s operations and organisation and may prompt the
need to apply for permits, which could have a material adverse effect
on the Cadeler Group’s business, prospects and financial results and
condition. Any change in, or the introduction of, new regulations may
increase the Cadeler Group’s operating costs, which could have an
adverse effect on its profitability. For example, changes in regulations
governing vessel fuel requirements could materially affect the Cadeler
Group’s cost base. If any of the Cadeler Group’s vessels fails to comply
with the extensive regulations applicable from time to time, the
Cadeler Group may be unable to continue operating such vessels
without costly and time-consuming retrofits, or may be subject to
financial penalties or operational restrictions which could in turn have
a material adverse impact on the Cadeler Group’s business, prospects
and financial results and condition.
26
Regulatory
The Cadeler Group is subject to various regulatory and compliance
requirements under international and national maritime regulations
that significantly affect the ownership and operation of the Cadeler
Group’s fleet. These regulations mainly relate to marine safety,
environmental protection, and maritime security. Below is a
description of the general regulatory framework in which the Cadeler
Group operates. This description should not be considered exhaustive
either in respect of the subjects covered or the details provided.
International Maritime Organisation (IMO)
Most of the regulations relating to vessel operations are based on
international rules issued predominantly by the IMO, the United
Nations (UN) agency for maritime safety and the prevention of
pollution by vessels. The primary IMO regulations include the
International Conventions for the Safety of Life at Sea (SOLAS), the
International Convention of the Standards of Training, Certification
and Watchkeeping for Seafarers (STCW), and MARPOL.
Vessel Safety and Security Requirements
The SOLAS Convention was adopted to address the safe manning of
vessels and emergency training drills. The Convention of Limitation of
Liability for Maritime Claims (LLMC) sets limitations on liability for loss
of life, personal injury, or property claims against ship owners.
Under Chapter IX of the SOLAS Convention, or the International
Safety Management Code for the Safe Operation of Ships and for
Pollution Prevention (the “ISM Code”), the Cadeler Group’s
operations are also subject to environmental standards and
requirements. The ISM Code requires the party with operational
control of a vessel to develop an extensive safety management
system including the adoption of a safety and environmental
protection policy setting forth instructions and procedures for the
safe operation of its vessels and for responding to emergencies.
The IMO has also adopted the International Convention on Standards
of Training, Certification and Watchkeeping for Seafarers (STCW). As
of February 2017, all seafarers are required to meet the STCW
standards and hold a valid STCW certificate.
The IMO’s Maritime Safety Committee and the MEPC each adopted
relevant parts of the International Code for Ships Operating in Polar
Water (the “Polar Code”). The Polar Code covers design, construction,
equipment, operational, training, search and rescue as well as
environmental protection matters relevant to ships operating in the
waters surrounding the two poles. It also includes mandatory
measures regarding safety and pollution prevention as well as
recommendatory provisions. The Polar Code applies to new ships
constructed on or after 1 January 2017 and after 1 January 2018, ships
constructed before 1 January 2017 are required to meet the relevant
requirements by the earlier of their first intermediate or renewal
survey.
Decarbonisation, Energy Efficiency and Air Emissions
MARPOL is applicable to vessels of any type operating under
countries that are signatories to the convention and is divided into six
Annexes, each regulating a different source of pollution. Annex I
relates to oil leakage or spillage; Annexes II and III relate to harmful
substances carried in bulk liquid form or in packaged form,
respectively; Annexes IV and V relate to sewage and garbage
management, respectively; and Annex VI relates to air emissions.
Annex VI to MARPOL addresses air pollution from vessels. Annex VI
sets limits on sulphur oxide (SOx) and nitrogen oxide (NOx) emissions
from all commercial vessel exhausts and prohibits deliberate
emissions of ozone-depleting substances (ODS) (such as halons and
chlorofluorocarbons), emissions of volatile compounds from cargo
tanks, and the shipboard incineration of specific substances.
Annex VI also includes a global cap on the sulphur content of fuel oil
and allows for special areas to be established with more stringent
controls on sulphur emissions, as explained below. Emissions of
volatile organic compounds (VOCs) from certain vessels, and the
shipboard incineration (from incinerators installed after 1 January
2000) of certain substances, such as polychlorinated biphenyls, PCBs
are also prohibited.
27
Regulatory
Continued from previous page
Pollution Control and Liability Requirements
The IMO has negotiated international conventions that impose
liability for pollution in international waters and the territorial waters
of the signatories to such conventions. The IMO has, inter alia,
adopted the International Convention for the Control and
Management of Ships’ Ballast Water and Sediments (the “BWM
Convention”) in 2004. The BWM Convention requires ships to
manage ballast water in order to remove, render harmless, or avoid
the uptake or discharge of new or invasive aquatic organisms and
pathogens contained in ballast water and sediments. The BWM
Convention’s implementing regulations provide for a phased
introduction of mandatory ballast water exchange requirements,
which are to be replaced in time by mandatory concentration limits,
and require all ships to carry a ballast water record book and an
International Ballast Water Management Certificate (IBWMC).
The IMO has also adopted the International Convention on Civil
Liability for Bunker Oil Pollution Damage (the Bunker Convention)
which imposes strict liability on ship owners (including the registered
owner, bareboat charterer, manager or operator) for pollution
damage in jurisdictional waters of ratifying states caused by
discharges of bunker fuel. The Bunker Convention requires registered
owners of ships over 1,000 gross tonnes to maintain insurance for
pollution damage in an amount equal to the applicable limits of
liability under national or international limitation regime (but not
exceeding the amount calculated in accordance with the LLMC).
Anti-Fouling Requirements
In 2001, the IMO adopted the International Convention on the
Control of Harmful Anti-fouling Systems on Ships (the Anti-fouling
Convention). The Anti-fouling Convention prohibits the use of
organotin compound coatings to prevent the attachment of molluscs
and other sea life to vessel hulls. Amendments were adopted in 2021
to include controls on anti-fouling systems containing cybutryne.
Vessels of more than 400 gross tonnes engaged in international
voyages are required to undergo an initial survey before being put
into service or before an International Anti-fouling System Certificate
(the IAFS Certificate) is issued for the first time; and subsequent
surveys when anti-fouling systems are altered or replaced.
International Labour Organisation
The International Labour Organisation (ILO) is a specialised agency of
the UN that has adopted the Maritime Labour Convention 2006 (MLC
2006). A Maritime Labour Certificate and a Declaration of Maritime
Labour Compliance are required to ensure compliance with MLC
2006 for all ships of 500 gross tonnes or more that are engaged in
international voyage or flying the flag of a member state and
operating from a port, or between ports, in another country.
28
Regulatory
Continued from previous page
EU Regulations
Decarbonisation and energy efficiency
The EU made a unilateral commitment to reduce overall GHG
emissions from its member states by 20% compared to 1990 levels by
2020. The EU also committed to reduce its emissions by 20% under
the Kyoto Protocol’s second period from 2013 to 2020. Regulation
(EU) 2015/757 of the European Parliament and of the Council of 29
April 2015 (amending EU Directive 2009/16/EC) (The MRV Regulation)
governs the monitoring, reporting and verification of carbon dioxide
emissions from maritime transport, and, subject to some exclusions,
requires ships of more than 5,000 gross tonnage to monitor and
report carbon dioxide (CO2) emissions annually. As of 1 January 2025,
the MRV regulation also applies to offshore vessels above 5,000 gross
tonnage.
Effective from 1 January 2025, the FuelEU Maritime Regulation
mandates a gradual reduction in the GHG intensity of energy used on
board ships of more than 5,000 gross tonnage calling at EU ports.
The required GHG intensity reductions are set to increase over time,
starting with a 2% reduction in 2025 and targeting an 80% reduction
by 2050, compared to 2020 levels. This regulation applies to all
relevant ships sailing in EU waters, regardless of their flag state.
FuelEU will not initially apply to offshore vessels and dredging vessels
as these are deemed not to be used predominantly for transportation
purposes, but a review of the legislation is scheduled by the end of
2027.
The EU has adopted several regulations and directives requiring,
among other things, more frequent inspections of high-risk ships, as
determined by vessel type, age and flag as well as the number of
times the ship has been detained. The EU also adopted and extended
a ban on substandard ships and enacted a minimum ban period and
a definitive ban for repeated offenses. The regulation also provided
the EU with greater authority and control over classification societies,
by imposing additional requirements on classification societies and
providing for fines or penalty payments for organisations that failed
to comply. Furthermore, the EU has implemented regulations
requiring vessels to use reduced-sulphur-content fuel for their main
and auxiliary engines. The EU Directive 2005/33/EC (amending
Directive 1999/32/EC) introduced requirements parallel to those in
Annex VI relating to the sulphur content of marine fuels. In addition,
the EU imposed a 0.1% maximum sulphur content requirement for
fuel used by ships at berth in the Baltic, the North Sea and the English
Channel (so called Sulphur Emission Control Areas). As of January
2020, outside sulphur emission control areas, a global sulphur limit
was introduced, requiring fuels with a 0.5% maximum sulphur
content.
On 15 September 2020, the European Parliament voted to include
GHG from the maritime sector in the EU Emissions Trading System EU
ETS. On 14 July 2021, the European Commission formally proposed its
plan, to gradually include the maritime sector from 2024, with a
phased inclusion over a three-year period. This requires shipowners
to buy permits to cover these emissions. On 18 December 2022, the
Council and European Parliament agreed to include maritime
shipping emissions within the scope of the EU ETS in phases, whereby
shipping companies will pay for 40% of verified emissions from 2024,
70% in 2025 and 100% in 2026. Most large vessels will be included in
the scope of the EU ETS from the start, with offshore vessels being
included from 2027. Offshore vessels of more than 5,000 gross
tonnage will be included in the EU ETS from 2027. The inclusion of
general cargo vessels and offshore vessels between 400 and 5,000
gross tonnage will be reviewed in 2026.
29
Regulatory
Continued from previous page
Pollution Control and Liability Requirements
EU Directive 2009/123/EC (amending Directive 2005/35/EC) on ship-
source pollution and on the introduction of penalties for
infringements imposes criminal sanctions for illicit ship-source
discharges of polluting substances, including minor discharges, if
committed with intent, recklessly or with serious negligence and the
discharges individually or in the aggregate result in deterioration of
the quality of water. Aiding and abetting the discharge of a polluting
substance may also lead to criminal penalties. The directive applies to
all types of vessels, irrespective of their flag, although certain
exceptions apply to warships or where human safety or the safety of
the vessel is in danger.
Ship Recycling
The EU has put in place regulatory requirements on the recycling of
vessels. The recycling of vessels is subject to various international,
regional and national requirements, including the 1989 Basel
Convention/EU Waste Shipment Regulation (1013/2006), the 2009
Hong Kong Convention and the EU Ship Recycling Regulation
(1257/2013) which may apply depending on the flag of the vessel and
the location of the vessel at the time the decision to recycle is taken.
The regulations establish certain requirements relating, inter alia, to
the requirements for vessels and recycling facilities to ensure that
vessel recycling takes place in an environmentally safe and sound
manner, impose restrictions on the installation and use of hazardous
materials on ships, and establish a list of approve ship recycling
facilities.
30
Regulatory
Continued from previous page
Inspection by Classification Societies
The hull and machinery of every commercial vessel must be classed
by a classification society authorised by its country of registry. The
classification society certifies that a vessel is safe and seaworthy in
accordance with the applicable rules and regulations of the country
of registry of the vessel and SOLAS. Most insurance underwriters
make it a condition for insurance coverage and lending that a vessel
is certified “in class” by a classification society that is a member of
the International Association of Classification Societies, the IACS.
A vessel must undergo annual surveys, intermediate surveys,
drydockings and special surveys. In lieu of a special survey, a vessel’s
machinery may be subject to a continuous survey cycle, under which
the machinery is surveyed periodically over a five-year period. Every
vessel is also required to be dry-docked periodically for inspection
of the underwater parts of the vessel. If any vessel does not
maintain its class and/or fails any annual survey, intermediate
survey, dry docking or special survey, the vessel will be unable to
operate between ports and will become unemployable and
uninsurable and may be subject to further adverse commercial
consequences.
Other Coastal State Requirements
As a matter of international law, coastal states are permitted, subject
to certain restrictions, to impose requirements on vessel operations
in the territorial waters. Furthermore, coastal states are entitled to
exploit natural resources, such as wind power, in its exclusive
economic zones and/or continental shelf subject to restrictions set
out in the United Nations International Law of the Seas Convention
(UNCLOS), Part II, Art. 2(2), Part V and VI, or under customary
international law.
Internationally, coastal states have elected to put significantly
different regulatory requirements in place. The local law
requirements may relate to matters such as the ownership/
nationality of the vessel, nationality and/or work permits for crew,
and/or use of local port infrastructure. In the Cadeler Group’s
activities, the Cadeler Group is confronted with a range of
government policies that restrict international trade and protect
domestic industries. Such protectionist measures manifest
themselves mostly through cabotage laws which protect the
domestic shipping industry from foreign competition and thus
prevent or limit Cadeler from operating in certain countries.
Examples of such include, the United States through the Merchant
Marine Act of 1920 (also known as the Jones Act), as well as in many
other jurisdictions.
Corporate Sustainability Reporting Directive
The Corporate Sustainability Reporting Directive (CSRD) is an EU
regulation aimed at enhancing and standardising sustainability
reporting across organisations. It requires large public-interest
entities, including listed companies, to disclose detailed non-
financial information, related to environmental, social, and
governance (ESG) matters. The CSRD, which amends the Non-
Financial Reporting Directive (NFRD), mandates that companies
provide information on sustainability impacts, risks and
opportunities, with the aim of ensuring greater transparency and
accountability. This includes the requirement for companies to
follow European Sustainability Reporting Standards (ESRS) in order
to align with global sustainability efforts and enhance comparability
across sectors. The scope of the CSRD has been simplified under the
Omnibus agreement, but continues to apply to large EU public
interest entities with more than 1000 employees. The CSRD aims to
improve the quality, consistency, and reliability of sustainability
reporting to better inform investors, stakeholders, and policymakers.
31
Corporate Governance
Cadeler is incorporated in Denmark and its shares are admitted to
trading on the Oslo Stock Exchange (the “OSE”). Cadeler therefore
follows the Norwegian Code of Practice for Corporate Governance
and applicable Danish law in respect of its corporate governance
practices. In addition, and as a result of the listing of American
Depositary Shares (each representing four of the Company’s
ordinary shares) on the New York Stock Exchange (NYSE), the
Company complies with applicable United States federal securities
laws and regulations as well as the rules of the NYSE, in particular
the corporate governance standards of Section 303A of the NYSE
Listed Company Manual, to the extent applicable to the Company
as a foreign private issuer.
A description of the internal control and risk management system
relating to financial reporting can be found in the Corporate
Governance Report. The Company has established internal controls
and risk management systems in relation to the financial reporting
process. As a company listed on NYSE, the company is required to
be compliant with Sarbanes-Oxley Act section 404b (SOX 404b).
The company’s internal control framework is based on the Internal
Control – Integrated Framework 2013 as issued by the Committee of
Sponsoring Organizations of the Treadway Commission (COSO).
A full copy of the Company’s corporate governance code is
available on the Company’s website: https://www.cadeler.com/
assets/uploads/PDFs/Investors/Cadeler-Corporate-Governance-
Policy-2026.pdf.
Statutory CSR Report
To fulfil the requirement for statutory reporting on corporate social
responsibility (CSR) under sections §99a and §107d of the Danish
Financial Statements Act, and in accordance with the EU’s Corporate
Sustainability Reporting Directive (CSRD), the Company has
integrated its annual sustainability statements into this Annual
Report 2025. For the sustainability statement, see pages 40-137.
The Cadeler Group’s Board of Directors
Cadeler’s Board of Directors considers the maintenance of high
standards of corporate governance as an essential element of the
Cadeler Group’s capacity to deliver on its strategy and to drive long-
term value creation. The Board oversees the Cadeler Group’s
governance structure and processes, ensuring that these remain
robust and appropriate as the Cadeler Group pursues its strategic
objectives with an emphasis on execution, efficiency and growth.
The Board also seeks to be responsive to the views of shareholders
and other stakeholders.
Board Composition
In 2025, there were no changes to the composition of the Board.
Ditlev Wedell-Wedellsborg, Colette Cohen and Thomas Thune
Andersen will stand for re-election to the Board at the Cadeler
Group’s 2026 Annual General Meeting (AGM). The remaining
directors serving on the Board were re-elected in 2025 to serve
through the Cadeler Group’s 2027 AGM.
Gender Diversity
Cadeler has previously communicated its objective to increase the
representation of women on the Board to at least 25% by the end of
2026. Cadeler is pleased to have achieved this objective early, as the
Board currently comprises two women and five men, representing
28.6% women. Cadeler aims to maintain at least the current level of
female representation on the Board through 2026. See Sustainability
section for further reference to Gender Diversity at Cadeler.
32
Corporate Governance
Continued from previous page
Board Committees
The Board delegates certain responsibilities to its committees to assist in
ensuring effective corporate governance across the business:
Audit Committee
The Cadeler Board has established an audit committee. The primary
purposes of the Audit Committee are to:
•assist the Board in discharging its duties relating to the
safeguarding of assets, the operation of adequate systems
and internal controls, control processes and the
preparation of accurate financial reporting and statements
in compliance with all applicable legal requirements,
corporate governance and accounting standards; and
•support the Board in its oversight of the risk profile and
risk management of the Cadeler Group.
In 2025, the Audit Committee devoted considerable attention to (i)
the continued implementation and testing of internal controls as
required under the US Sarbanes Oxley Act of 2002, as amended, by
virtue of Cadeler’s listing on the NYSE and (ii) the integration of the
Cadeler Group’s business operations, including the migration of
certain legacy operations to a unified enterprise reporting and
management platform for the Cadeler Group.
The Audit Committee reports to, and makes recommendations to
the Board, but the Board retains responsibility for implementing
such recommendations.
Remuneration Committee
The Board has established a Remuneration Committee. The primary
purpose of the Remuneration Committee is to advise the Board on
the salaries and other elements of compensation of Cadeler’s
Executive Management and the broader Cadeler Group.
The Remuneration Committee reports to, and makes
recommendations to, the Board, but the Board retains responsibility
for implementing such recommendations.
Nomination Committee
Consistent with the Norwegian Code of Practice for Corporate
Governance, Cadeler has established a Nomination Committee, the
composition of which is determined by election by its shareholders
at each AGM. Members of the Nomination Committee are not
required to be, and are not currently, members of the Board.
Cadeler’s nomination committee makes recommendations to the
general meeting regarding the election of shareholder-elected
members to the Board and to the Nomination Committee, as well as
the remuneration of members of the Board.
33
Board of Directors
Andreas Sohmen-Pao | Emanuele A. Lauro | Ditlev Wedell-Wedellsborg | |
Position | Chairman of the Board. | Vice Chairman of the Board of Directors. | Board Member and member of the Remuneration Committee. Former chair of the Audit Committee until January 2024. |
Nationality: | Austrian | Italian | Danish |
Born: | 1971 | 1978 | 1961 |
Gender | Male | Male | Male |
Joined the Cadeler board: | 2021 | 2024 | 2020 |
Current election period: | 2025-2027 | 2025-2027 | 2024-2026 |
Independence | Considered non-independent | Considered non-independent. | Considered independent. |
Other management duties, etc. | BW Group Limited (Executive Chairman) BW Offshore Limited (Chairman) BW Energy Limited (Chairman) BW LPG Limited (Chairman) BW Epic Kosan Ltd (Chairman) Hafnia Limited (Chairman) Global Centre for Maritime Decarbonisation (Chairman) Lloyd’s Register Foundation (member of the Board of Trustees) | Scorpio Holdings Limited (member of the Board and CEO) Scorpio Services Holding Limited (member of the Board and CEO) Scorpio Tankers Inc. (Chairman and CEO) Scorpio Offshore Holding Inc. (member of the Board) Moxie Corp (member of the Board and CEO) Gorgon Holdings Limited (member of the Board and CEO) Monaco Chamber of Shipping (Vice President) Fordham University (member of the London Advisory Council) | Wessel & Vetts Fond (Chair) Weco Travel CEE and associated companies (Chair) Vind A/S (Chair) Weco lnvest (Chair) Donau Agro (member of the Board) Damptech and associated companies (member of the Board) AeroGuest (member of the Board) Niki lnvest. Manager |
Education | MBA, Harvard University BA Honours in Oriental Studies, Oxford University | International Business, European Business School. | BA, Stanford University MBA, INSEAD |
Qualifications | More than 20 years of experience in the shipping industry. Chairman for multiple corporate boards and board experience from international listed companies. | Extensive shipping industry experience spanning two decades. Chairs multiple corporate boards and active participant in the maritime community and advisory boards. | Board experience from Nordic companies and from the transportation sector. Management experience from ship owning company. |
Attendance in Board and Committee meetings 2025 | 4/4 Board meetings 2/2 Remuneration Committee meetings | 4/4 Board meetings | 4/4 Board meetings 2/2 Remuneration Committee meetings |
34
Board of Directors
Andrea Abt | James Nish | Colette Cohen | |
Position | Board Member and member of the Audit Committee | Board Member and Chair of the Audit Committee | Board Member |
Nationality: | German | American | Irish |
Born: | 1960 | 1958 | 1968 |
Gender | Female | Male | Female |
Joined the Cadeler board: | 2023 | 2024 | 2024 |
Current election period: | 2025-2027 | 2025-2027 | 2024-2026 |
Independence | Considered independent | Considered independent | Considered independent |
Other management duties, etc. | Energy Technology Holdings LLC / Exide Technologies (Chair of Sustainability Committee and member of the Board) Gerresheimer AG (member of the Board) | Gibraltar Industries, Inc. (Chairman of Audit Committee and Capital Structure and Asset Management Committee) Alert360 Home Security Business (Lead Director) | Forth Ports (member of the Board) Technip Energies (member of the Board) Bluenord (member of the Board) Deepocean (member of the Board) Former CEO of the Net Zero Technology Centre. |
Education | English and Spanish Philology, Rheinische Friedrich-Wilhelms University, Bonn MBA, Rotman School of Management, University of Toronto | BS in Accounting and Business, State University of New York. MBA, Wharton School of the University of Pennsylvania | BSc (Hons), Queens University MBA, Ceram Sophia Antipolis |
Qualifications | Listed and non-listed board experience in European and US companies, broad executive background in a variety of functions. Specialist knowledge in procurement and logistics. | Over 30 years of experience in investment banking, serving clients across a variety of international industrial markets. Certified public accountant and adjunct professor at Baruch College, Zicklin School of Business in New York and at Pace University, Lubin. | Extensive executive experience, with a particular focus on the energy transition. Non-executive board experience, having served on the boards of several companies in the energy industry. |
Attendance in Board and Committee meetings 2025 | 4/4 Board meetings 4/4 Audit Committee meetings | 4/4 Board meetings 4/4 Audit Committee meetings | 4/4 Board meetings |
35
Board of Directors
Thomas Thune Andersen | |||
Position | Board Member | ||
Nationality: | Danish | ||
Born: | 1955 | ||
Gender | Male | ||
Joined the Cadeler board: | 2024 | ||
Current election period: | 2024-2026 | ||
Independence | Considered independent | ||
Other management duties, etc. | T. Andersen Consulting (Owner) Lloyd’s Register Group (Chairman) Lloyd’s Register Foundation (Chairman) IMI (Senior Independent Director) BW Group (member of the Board) Lambert Energy Advisory (member of the Board) | ||
Education | Graduate Diploma, Copenhagen Business School Senior Management Programme, Columbia University ISMP (Economics), Harvard University | ||
Qualifications | Extensive executive experience in various leadership positions, including at A.P. Moller Maersk, and non-executive experience in both listed and privately held companies within the energy, manufacturing and marine industries, with a particular focus on the energy transition. | ||
Attendance in Board and Committee meetings 2025 | 4/4 Board meetings |
36
Executive Management
Mikkel Gleerup | Peter Brogaard | |
Position | Chief Executive Officer (CEO) | Chief Financial Officer (CFO) |
Nationality: | Danish | Danish |
Born: | 1978 | 1965 |
Gender | Male | Male |
Joined Cadeler | 2017 | 2022 |
Independence | Mikkel Gleerup does not have other roles or positions of trust outside the Company. | Peter Brogaard does not have other roles or positions of trust outside the Company. |
Education | MBA, INSEAD, 2016 MSc in Transportation and Maritime Management, University of Southern Denmark, 2008 | MSc in Accounting and Auditing, Aarhus University, 1995 |
Qualifications | Experience from working within the offshore wind segment for more than 17 years inter alia with Siemens Wind Power, Global Marine Systems Ltd. and A.P. Møller-Maersk. | Significant experience from the shipping industry and finance, among others as Vice President, Group Finance at the product tanker shipping company TORM Plc. where he worked prior to joining the Company. |
37
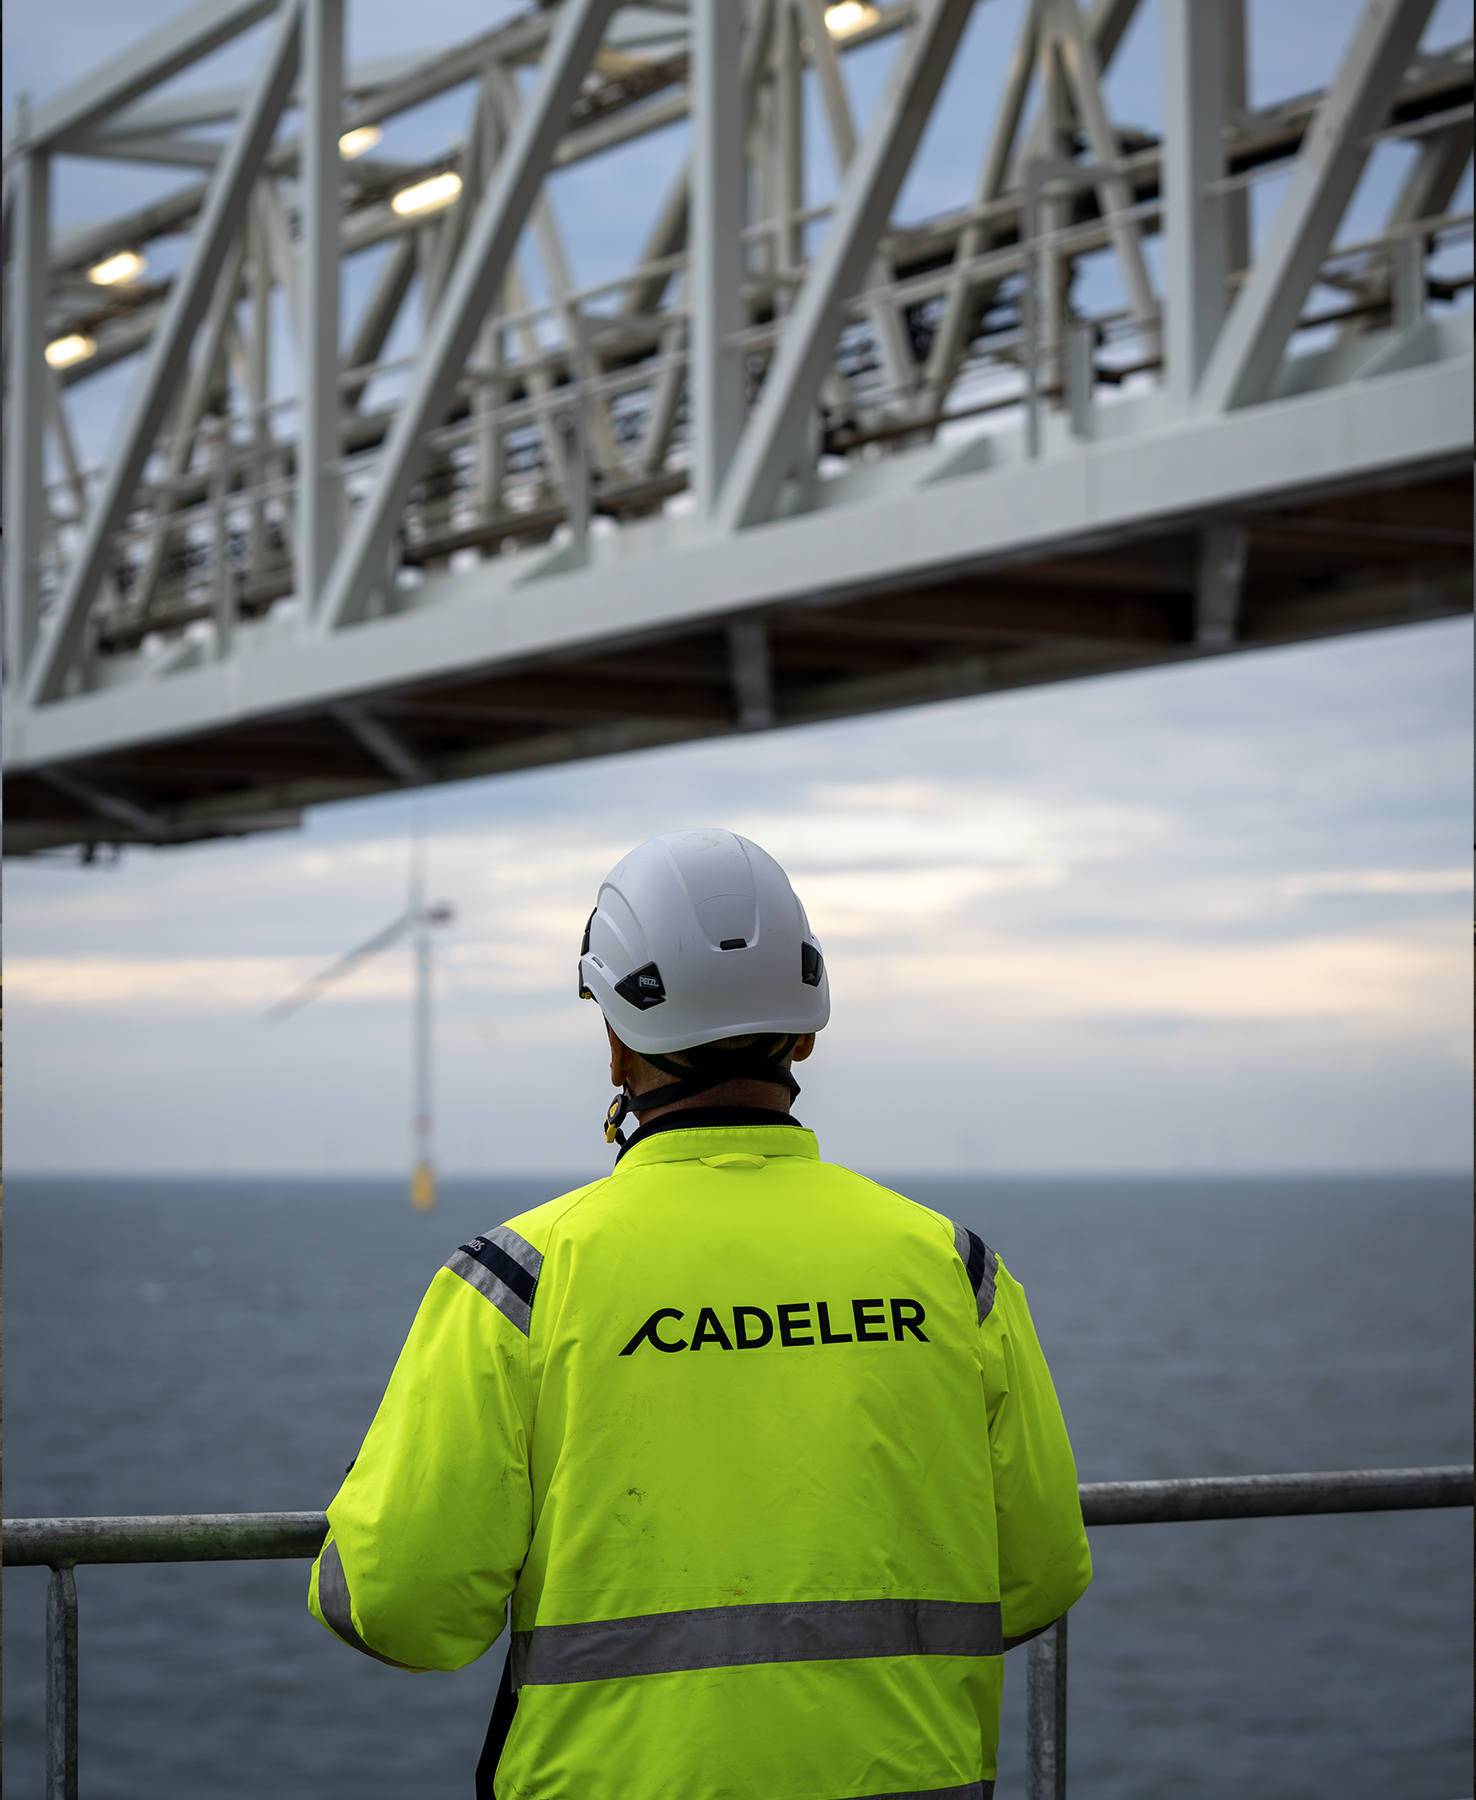
Corporate Governance
Continued from previous page
Largest Shareholders
As of 20 March 2026, five shareholders held shareholdings in excess
of 5% of Cadeler’s total share capital: BW Altor Pte. Ltd. held
27.40%, Scorpio Holdings Limited held 12.09%, Folketrygdfondet
held 5.26%, Marble Bar Asset Management LLP held 5.23% and
Nordea Investment Management AB held 5.69%.
Purchase of own shares
At Cadeler’s AGM, held on 22 April 2025, the Board of Directors was
granted an authorisation for the period until 21 April 2029 to permit the
repurchase by the Company of its own shares.
Between 26 May 2025 and 30 May 2025, Cadeler repurchased
395,200 of its own shares at an average price per share of NOK
49.92, corresponding to an aggregate purchase price of
approximately EUR 1.7 million, in order to enable the Company to
meet its obligations to employees arising under certain of its share-
based incentive programmes. The Company has no current plan or
intention to repurchase any more of its own shares, other than for
the same purpose.
Voting Rights
As of 31 December 2025, Cadeler had 350,957,583 shares issued
and outstanding, each with a nominal value of DKK 1. Each shares
carries the right to one vote at any general meeting of the
Company’s shareholders. No shareholders have any special or
different voting rights under Cadeler’s Articles of Association.
Resolutions at general meetings may generally be passed by a
simple majority of votes cast, unless otherwise prescribed under the
Danish Companies Act or by Cadeler’s Articles of Association. The
approval of amendments to the Articles of Association, a dissolution
of the Company, or a merger or demerger involving the Company
requires at least a two-thirds majority of the votes cast, as well as of
the share capital represented at the general meeting. The provisions
in Cadeler’s Articles of Association relating to changes in
shareholder rights or a change to the Company’s share capital are
not more stringent than those required by the Danish Companies
Act.
Change of Control
Certain of the Company’s debt facilities contain change of control
provisions that may be triggered if any person or group (excluding
the BW Group, and, with respect to certain of the Company’s debt
facilities, the Scorpio Group and their respective affiliates) acquires
control of 25% or more of Cadeler’s voting and/or ordinary share
capital. In addition, a change of control is triggered under the
Holdco Facilities if the BW Group holds less than 17.5% of the shares
in Cadeler.
Certain of Cadeler’s customer contracts may include change of
control clauses, which are considered customary for the industry.
38
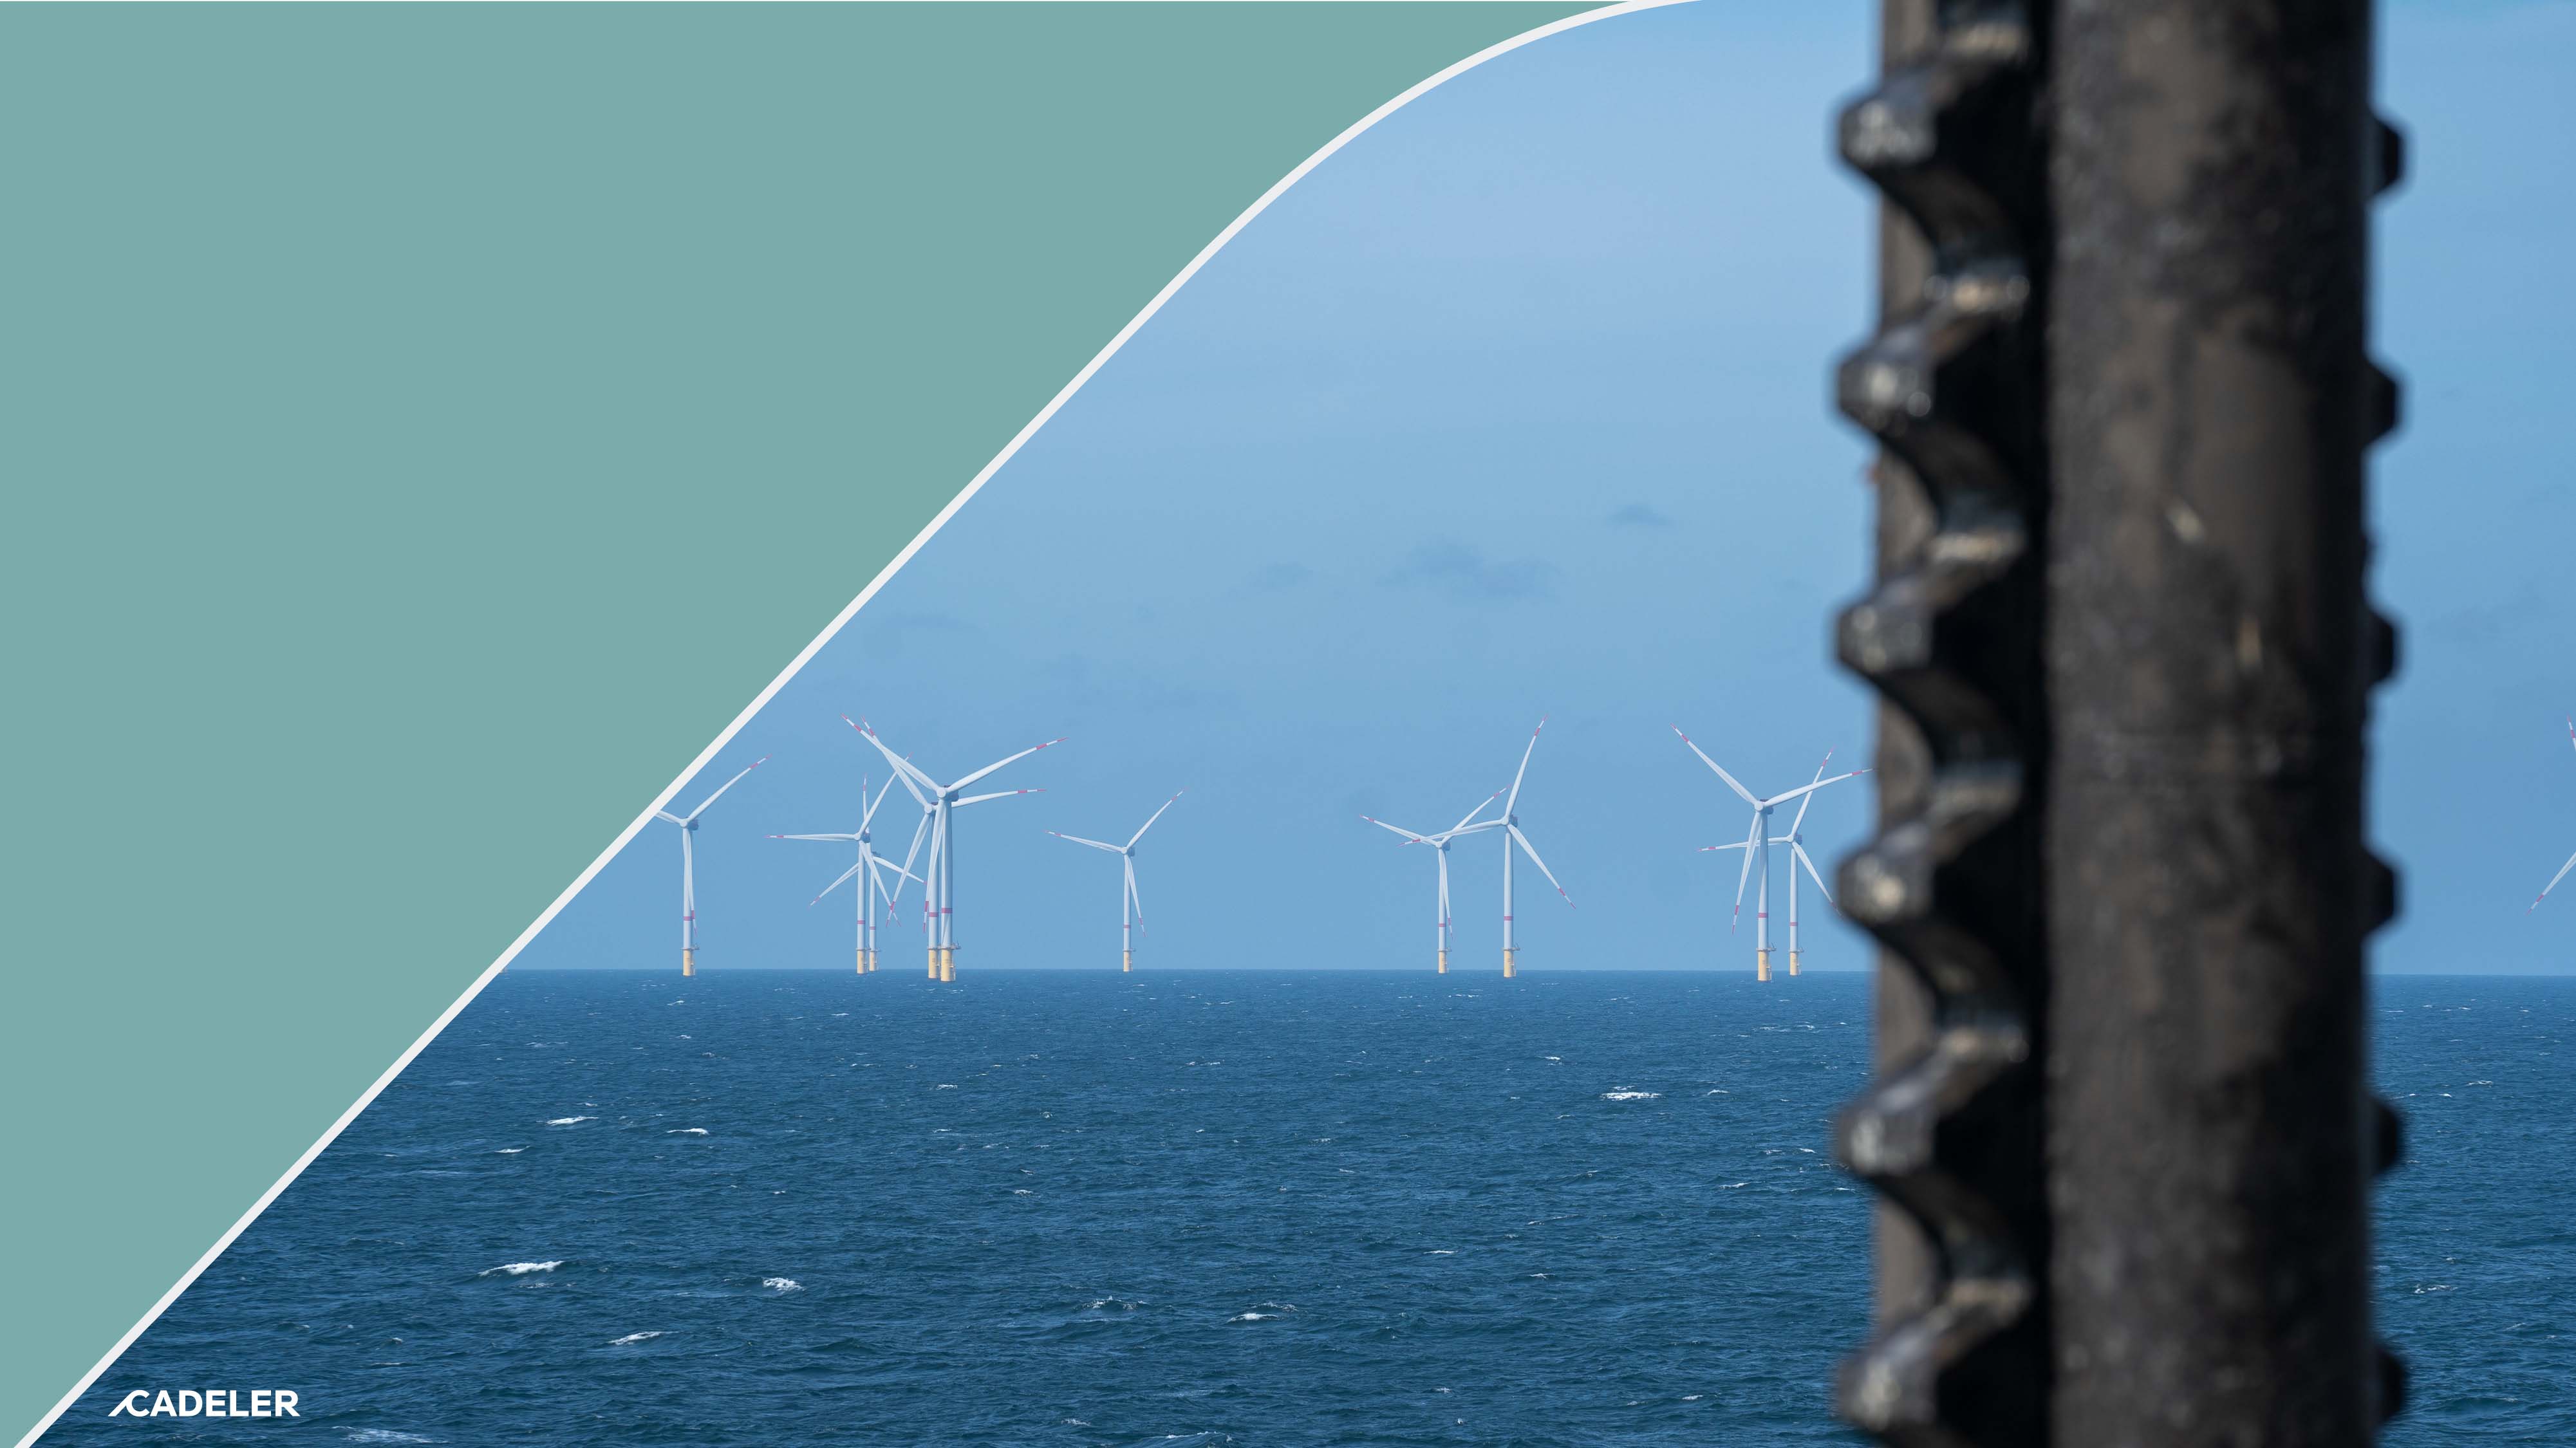
39
General
information

40
Disclosure requirements & incorporation by reference
Standard | Section/ Report* | Page(s) | Incorporation by reference | |
ESRS 2 - General disclosures | ||||
BP-1 | General basis for preparation of the sustainability statement | SUS | ||
BP-2 | Disclosures in relation to specific circumstances | SUS | ||
Datapoints that derive from other EU legislation | SUS | |||
GOV-1 | The role of the administrative, management and supervisory bodies | SUS/MR | MR pages 31 | |
GOV-2 | Information provided to and sustainability matters addressed by the undertaking’s administrative, management and supervisory bodies | SUS | ||
GOV-3 | Integration of sustainability-related performance in incentive schemes | SUS/RR | RR page 8 | |
GOV-4 | Statement on sustainability due diligence | SUS | ||
GOV-5 | Risk management and internal controls over sustainability reporting | SUS | ||
SBM-1 | Strategy, business model and value chain (products, markets, customers) | SUS/MR | ||
Strategy, business model and value chain (headcount by country) | SUS | |||
Strategy, business model and value chain (breakdown of revenue) | FS | |||
SBM-2 | Interests and views of stakeholders | SUS | ||
SBM-3 | Material impacts, risks and opportunities and their interaction with strategy and business model | SUS | ||
IRO-1 | Description of the process to identify and assess material impacts, risks and opportunities | SUS | ||
IRO-2 | Disclosure requirements in ESRS covered by the undertaking’s sustainability statement | SUS | ||
Standard | Section/ Report* | Page(s) | Incorporation by reference | |
ESRS E1 - Climate Change | ||||
ESRS 2, GOV-3 | Integration of sustainability-related performance in incentive schemes | SUS/RR | RR pages 8 | |
E1-1 | Transition plan for climate change mitigation | SUS | ||
ESRS 2, SBM-3 | Material impacts, risks and opportunities, and their interaction with strategy and business model | SUS | ||
ESRS 2, IRO-1 | Description of the processes to identify and assess material climate- related impacts, risks and opportunities | SUS | ||
E1-2 | Policies related to climate change mitigation and adaptation | SUS | ||
E1-3 | Actions and resources in relation to climate change policies | SUS | ||
E1-4 | Targets related to climate change mitigation and adaptation | SUS | ||
E1-5 | Energy consumption and mix | SUS | ||
E1-6 | Gross Scopes 1, 2, 3 and total GHG emissions | SUS | ||
E1-7 | GHG removals and GHG mitigation projects financed through carbon credits | SUS | ||
E1-8 | Internal carbon pricing | SUS | ||
E1-9 | Anticipated financial effects from material physical and transition risks and potential climate-related opportunities | SUS | ||
*SUS – Sustainability Statements; MR – Management Review; RR – Remuneration Report; FS – Financial Statements
41
Standard | Section/ Report* | Page(s) | Incorporation by reference | |
ESRS E2 -Pollution | ||||
ESRS 2, IRO-1 | Description of the processes to identify and assess material pollution-related impacts, risks and opportunities | SUS | ||
E2-1 | Policies related to pollution | SUS | ||
E2-2 | Actions and resources related to pollution | SUS | ||
E2-3 | Targets related to pollution | SUS | ||
E2-4 | Pollution of air, water and soil | SUS | ||
E2-6 | Anticipated financial effects from material pollution-related risks and opportunities | SUS | ||
ESRS E5 - Resource use and circular economy | ||||
ESRS 2, IRO-1 | Description of the processes to identify and assess material resource use and circular economy-related impacts, risks and opportunities | SUS | ||
E5-1 | Policies related to resource use and circular economy | SUS | ||
E5-2 | Actions and resources related to resource use and circular economy | SUS | ||
E5-3 | Targets related to resource use and circular economy | SUS | ||
E5-5 | Resource outflows | SUS | ||
E5-6 | Anticipated financial effects from material resource use and circular economy-related risks and opportunities | SUS | ||
Standard | Section/ Report* | Page(s) | Incorporation by reference | |
ESRS S1 - Own Workforce | ||||
ESRS 2, SBM-2 | Interests and views of stakeholders | SUS | ||
ESRS 2, SBM-3 | Material impacts, risks and opportunities and their interaction with strategy and business model | SUS | ||
S1-1 | Policies related to own workforce | SUS | ||
S1-2 | Processes for engaging with own workers and workers’ representatives about impacts | SUS | ||
S1-3 | Processes to remediate negative impacts and channels for own workers to raise concerns | SUS | ||
S1-4 | Taking action on material impacts on own workforce, and approaches to mitigating material risks and pursuing material opportunities related to own workforce, and effectiveness of those actions | SUS | ||
S1-5 | Targets related to managing material negative impacts, advancing positive impacts, and managing material risks and opportunities | SUS | ||
S1-6 | Characteristics of the undertaking’s employees | SUS | ||
S1-8 | Collective bargaining coverage and social dialogue | SUS | ||
S1-9 | Diversity metrics | SUS | ||
S1-14 | Health and safety metrics | SUS | ||
S1-16 | Remuneration metrics (pay gap and total remuneration) | SUS | ||
S1-17 | Incidents, complaints and severe human rights impacts | SUS | ||
*SUS – Sustainability Statements; MR – Management Review; RR – Remuneration Report; FS – Financial Statements
42
Standard | Section/ Report* | Page(s) | Incorporation by reference | |
ESRS S2 - Workers in the value chain | ||||
ESRS 2, SBM-2 | Interests and views of stakeholders | SUS | ||
ESRS 2, SBM-3 | Material impacts, risks and opportunities and their interaction with strategy and business model | SUS | ||
S2-1 | Policies related to value chain workers | SUS | ||
S2-2 | Processes for engaging with value chain workers about impacts | SUS | ||
S2-3 | Processes to remediate negative impacts and channels for value chain workers to raise concerns | SUS | ||
S2-4 | Taking action on material impacts on value chain workers, and approaches to managing material risks and pursuing material opportunities related to value chain workers, and effectiveness of those actions | SUS | ||
S2-5 | Targets related to managing material negative impacts, advancing positive impacts, and managing material risks and opportunities | SUS | ||
ESRS G1 - Resource use and circular economy | ||||
ESRS 2, GOV-1 | The role of the administrative, supervisory and management bodies | SUS | ||
ESRS 2, IRO-1 | Description of the processes to identify and assess material impacts, risks and opportunities | SUS | ||
G1-1 | Business conduct policies and corporate culture | SUS | ||
G1-2 | Management of relationships with suppliers | SUS | ||
G1-3 | Prevention and detection of corruption and bribery | SUS | ||
G1-4 | Incidents of corruption or bribery | SUS | ||
G1-6 | Payment practices | SUS | ||
*SUS – Sustainability Statements; MR – Management Review; RR – Remuneration Report; FS – Financial Statements
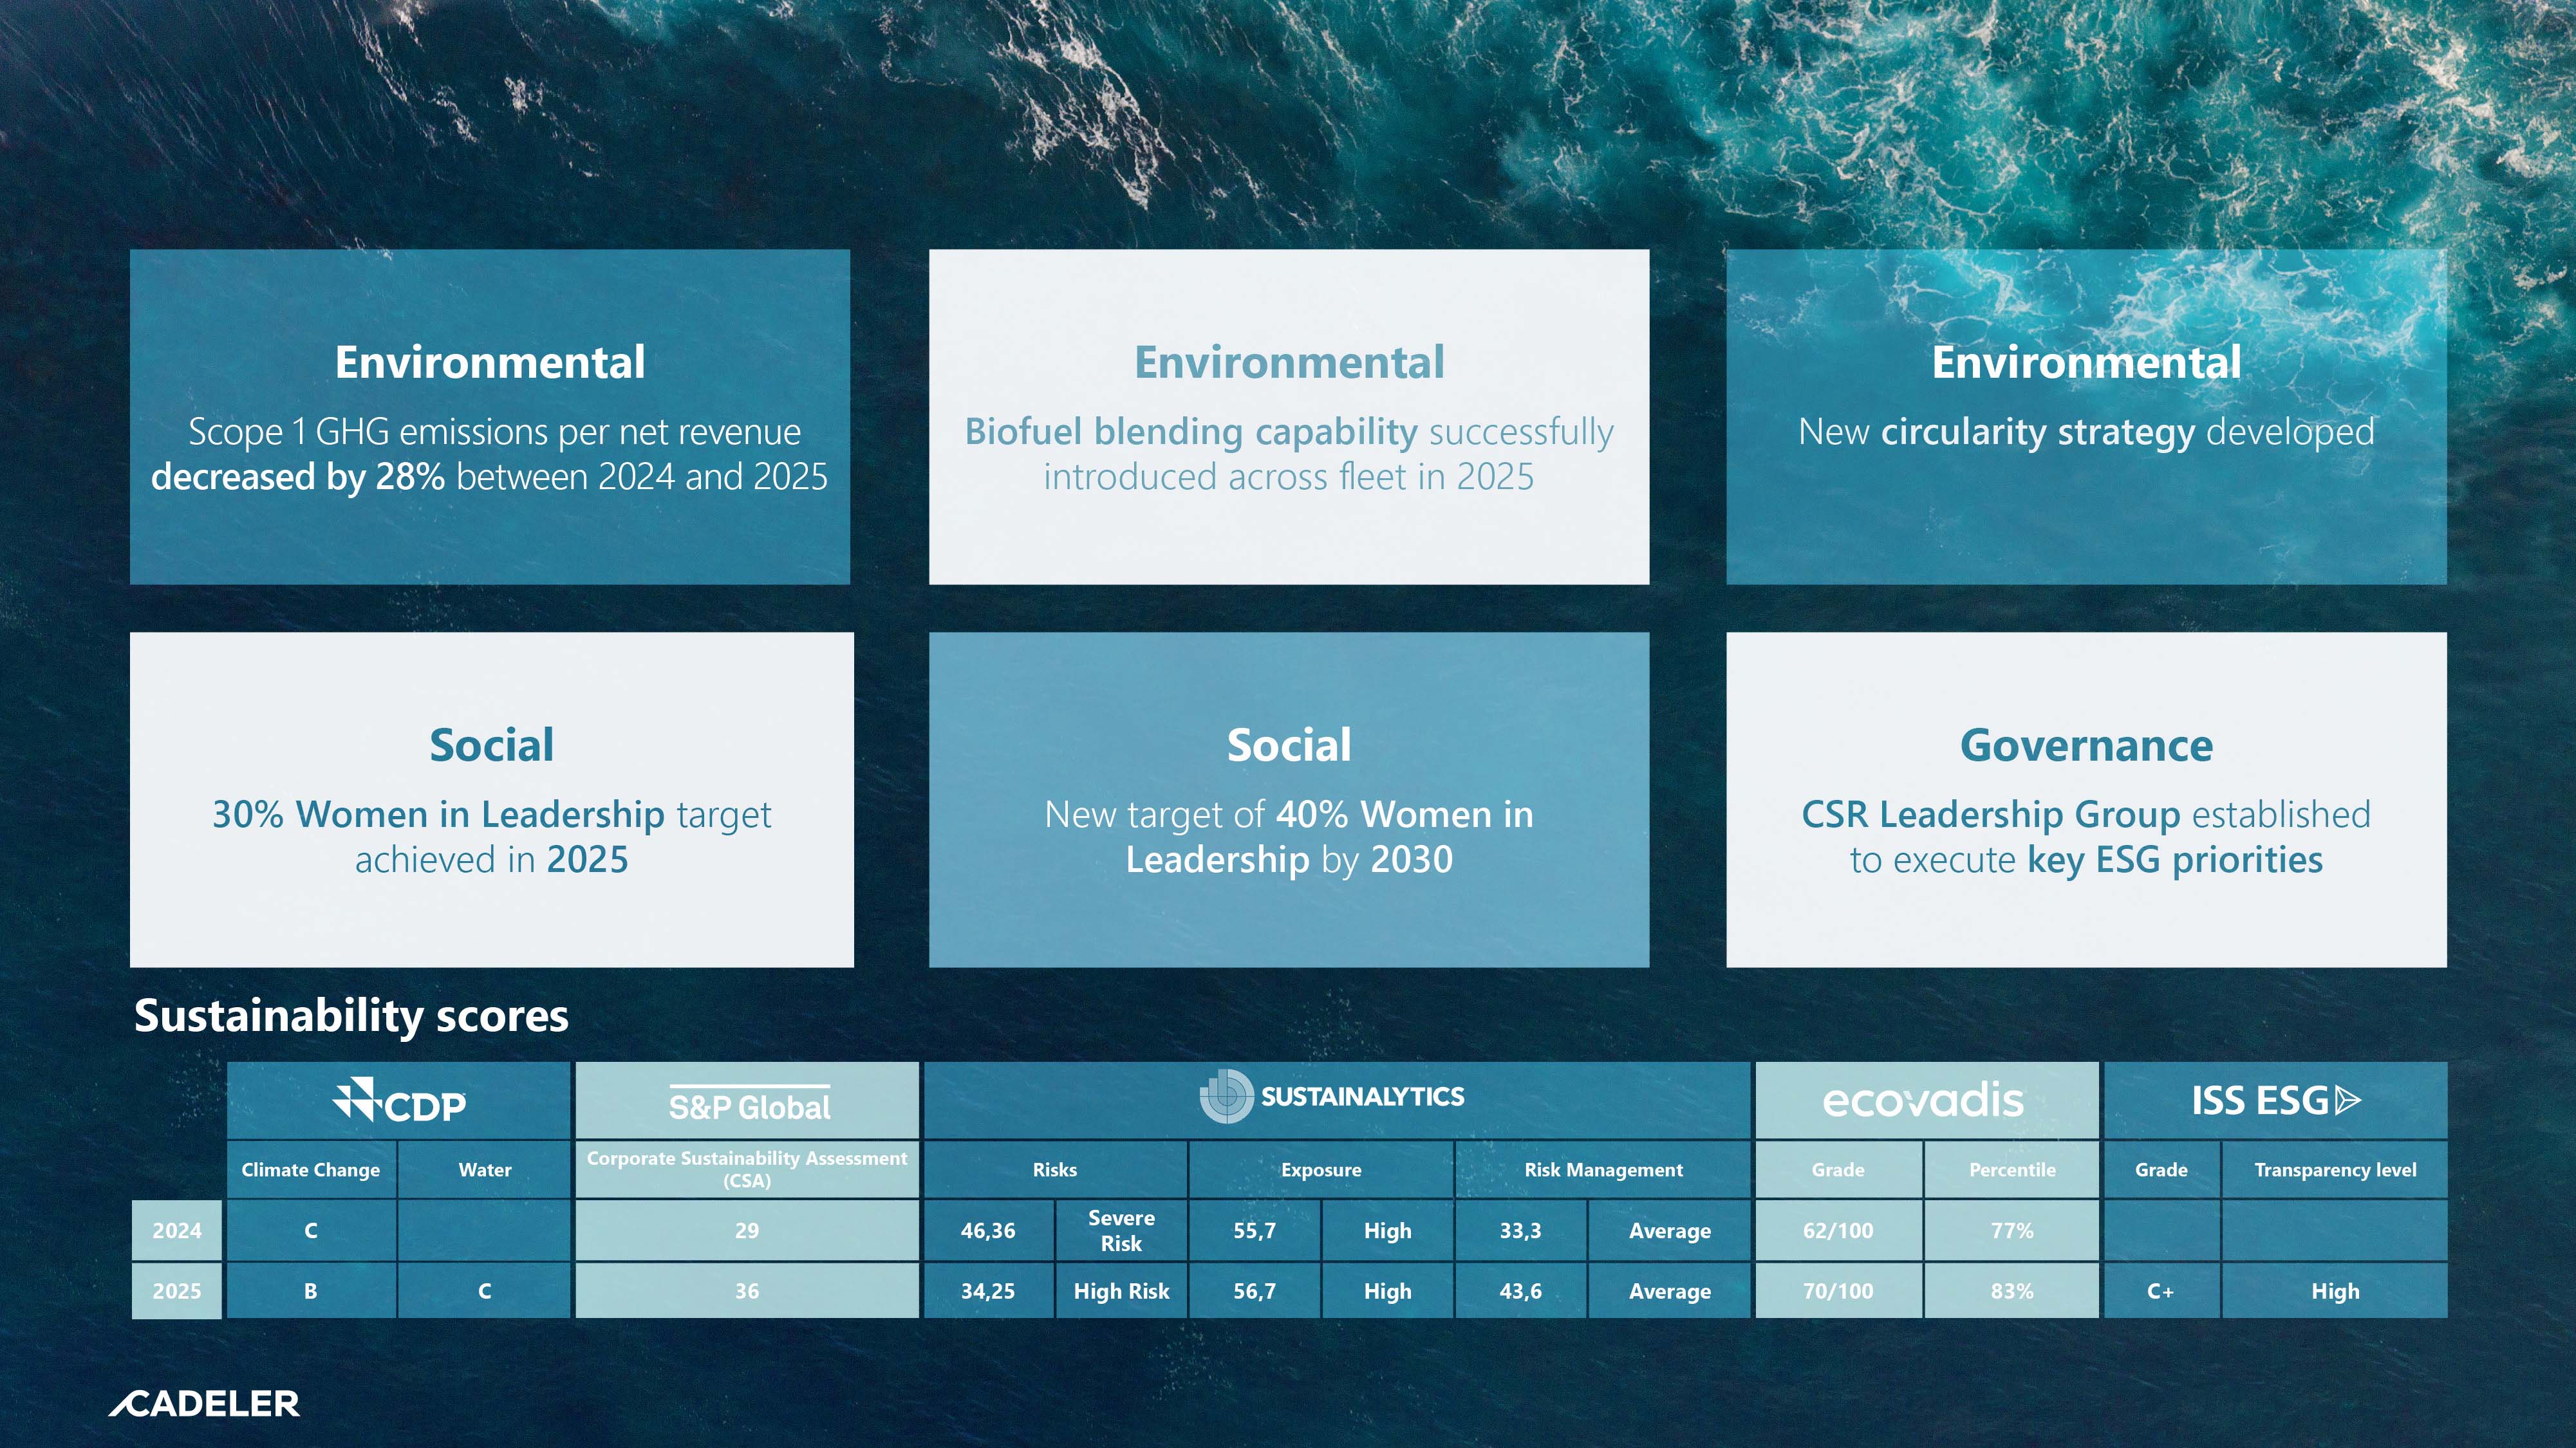
43
Cadeler’s 2025 Sustainability Highlights
44
Basis of preparation
How Cadeler prepared the Sustainability Statements in 2025
____________________________________________________________________________
ESRS 2 BP-1 – General basis for preparation of sustainability
statements frameworks and data selection
Framework of the Sustainability Reporting
Cadeler’s Sustainability Statements has been prepared in accordance
with the European Sustainability Reporting Standards (ESRS) as
required by the Danish Financial Statement Act. As of 31 December,
2025, the Corporate Sustainability Reporting Directive (CSRD) also
requires limited assurance to be provided on the sustainability
information. The reporting period for the Sustainability Statements
covers the period from the 1 January 2025 to the 31 December 2025.
Scope of the Sustainability Reporting
The scope of consolidation for the Sustainability Statement does not
differ from the scope of consolidation applied in the Financial
Statements. The Sustainability Reporting covers value chain
sustainability matters where relevant, especially throughout the
disclosures of the Scope 3 emissions and ESRS S2 – Workers in the
Value Chain disclosures. Cadeler allocates resources on an annual
basis in accordance with planned sustainability related action plans.
However, the available data is not granular enough to determine the
exact CAPEX or OPEX allocated to specific action plans. As a result,
there is no comprehensive overview of the total resources allocated,
at this point in time, to any of the action plans related to the topical
disclosure requirements in the CSRD framework. In addition, Cadeler
has not yet calculated any anticipated financial effects of the impact,
risks and opportunities across the topical standards.
Exceptions
No specific information in this statement has been omitted due to
member state regulations or to protect any of Cadeler’s intellectual
property, know-how or results of innovation.
ESRS 2 BP-2 – Disclosures in relation to specific circumstances
Whereas in the 2024 Sustainability Reporting Cadeler considered
long-term to cover a period of two to five years, the 2025
Sustainability Reporting adopts a broader perspective, with the long-
term referring to a period starting at two years and extending
indefinitely.
Taking into account the nature of its operations and the timing of the
impacts and dependencies across ESG matters, Cadeler considers
that a period longer than five years qualifies as long term and
remains fully part of the Company’s strategy. This has resulted in the
following time horizons:
•Short term is defined as less than one year
•Medium term as one to two years
•Long term as more than two years
For some metrics, uncertainty stems from the measurement
techniques (i.e. waste measurements are required to take place in
cubic meters for compliance with MARPOL requirements whereas
CSRD requests units in tonnage).
For others metrics, uncertainty arises from the availability and quality
of data from the entity’s upstream value chain (few suppliers are
currently able to provide primary data so calculations are largely
based on spend based data). Material sources of uncertainty are
explained throughout the report where relevant to specific metrics.
A significant portion of Cadeler’s Scope 3 reporting is not based on
direct data obtained from its value chain. By definition, Scope 3 data
comes from upstream and downstream operations and therefore, the
Company’s cannot control the collection of all information. A large
portion of the scope 3 footprint has been assessed using a model
developed to estimate the lifecycle carbon footprint associated with
the construction and operations of the Company’s windfarm
installation vessels.
For many aspects feeding into Cadeler’s overall scope 3 emissions,
the estimations of emissions are based on either a material or
process input with application of a conversion factor rather than
statements directly from the value chain on their emissions. Certain
categories are currently calculated using spend based data, which is
inherently associated with higher uncertainty than direct
measurements or estimates based on operational consumption data.
In addition, a description of the resulting level of accuracy is provided
for all data, including value chain data estimated using indirect sources.
In order to ensure the application of the Company’s policies by
business partners, Cadeler requires them to acknowledge and sign the
Code of Conduct and to respect the principles and values that Cadeler
embraces. Cadeler is working on increasing the level of accuracy of
metrics that include value chain data estimated using indirect sources.
Reporting methodologies are disclosed within each ESRS section of
this report to describe the practices applied to the quantitative data
presented. In these descriptions, Cadeler presents information related
to the metrics included within the relevant ESRS section. These
methodologies disclose where data is subject to high levels of
measurement uncertainty, the sources of such measurement
uncertainty, and whether assumptions, approximations or judgments
have been applied.
45
Governance and organisation of sustainability matters
ESG Governance
_____________________
ESRS 2 GOV-1 – The role of the administrative management and
supervisory bodies
The Cadeler Group’s Board of Directors consists of seven non-
executive members, of whom five (71.4%) are considered
independent members and none are employee-elected. All members’
CVs and merits are presented in the Management Review.
Two out of seven top managerial positions are held by women,
representing 28.6% of the Board of Directors. In the other managerial
positions, women hold three out of nine roles, meaning that 33.3% of
the Senior Leadership Team is composed by women.
The Chairman of the Board also serves as Chair of the Global Centre
for Maritime Decarbonisation, strengthening the insight on climate
issues within the Board of Directors. One member of the Board has
extensive knowledge of procurement and experience that is valuable
for topics such as potential impacts on workers and corporate
governance aspects of the value chain. Another Board member has
focused her career in recent years on the energy transition, and their
experience strengthens the Board’s collective knowledge of climate
change and the risk and opportunities of decarbonisation.
Regarding other material issues, such as pollution, circularity and
impacts on the own workforce, Cadeler has subject matter experts
within its workforce that can be leveraged by the Board of Directors
and Executive Management. External advice can also be sought
whenever additional knowledge is required on any topic.
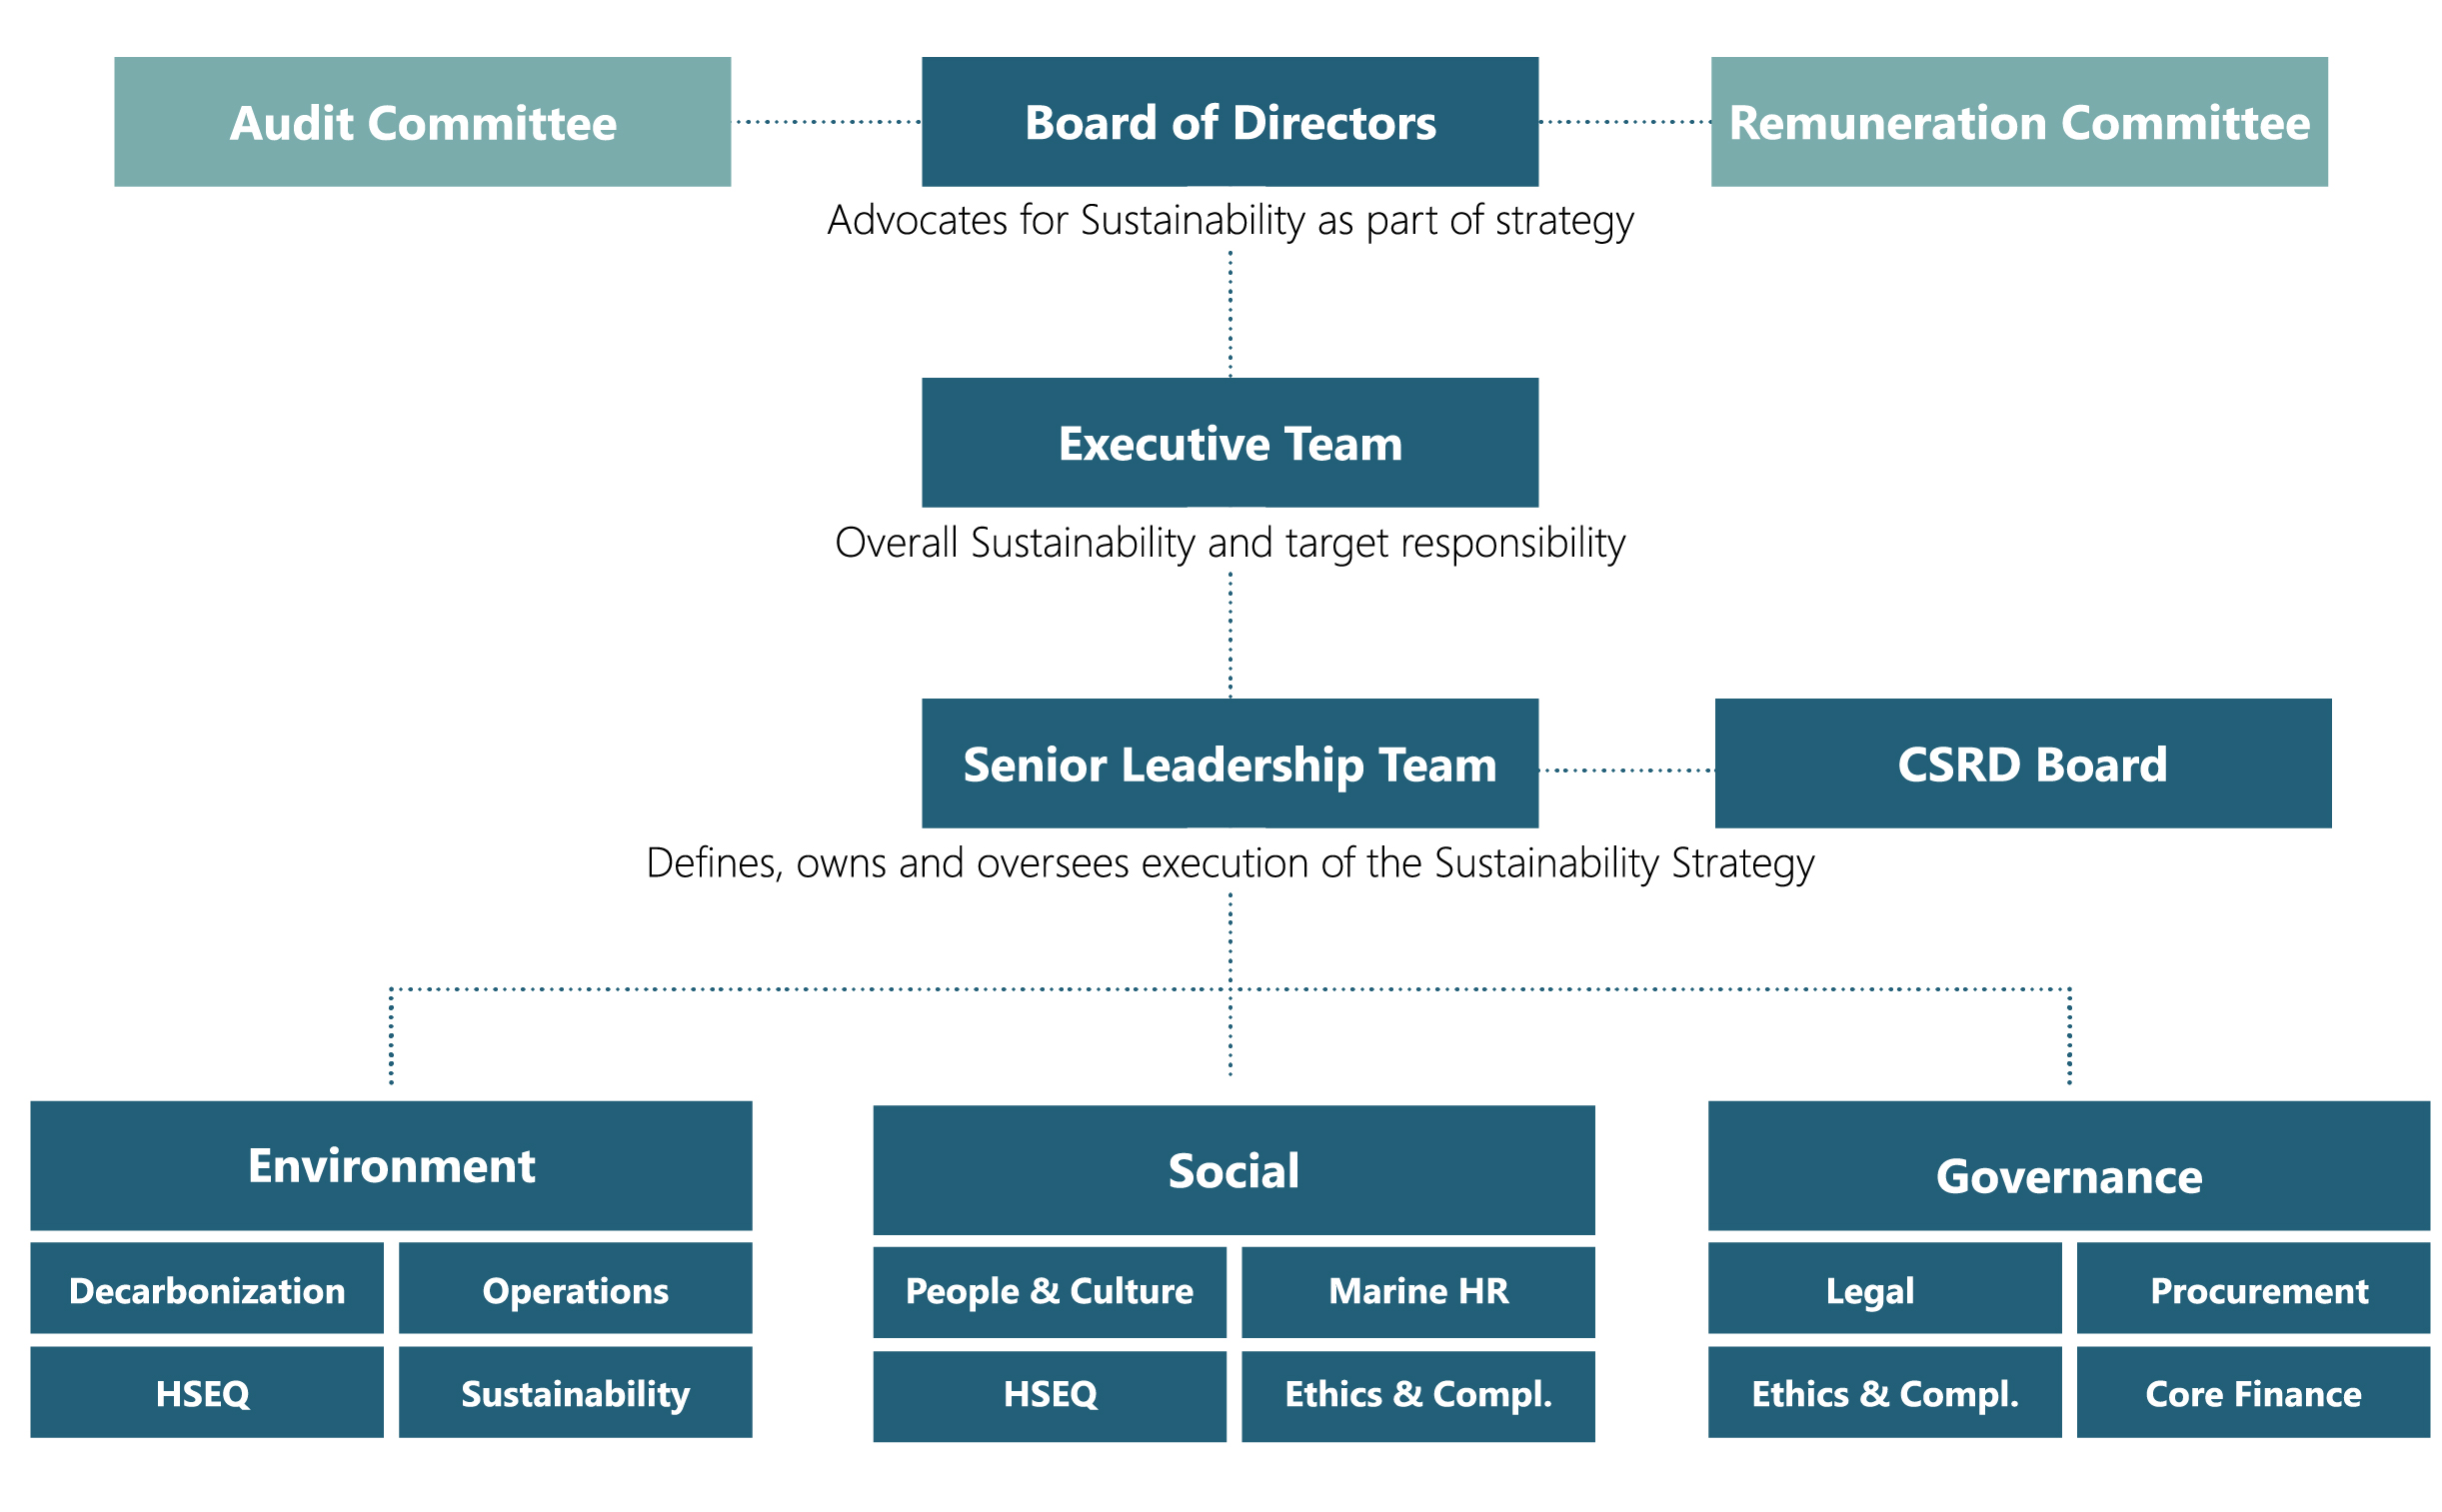
46
Governance and organisation of sustainability matters
Continued from previous page
To ensure that other ESG topics are managed in a manner consistent with industry standards and
expectations, all core ESG topics are owned by a department with relevant competencies:
•The Sustainability and Performance Department drives the Company’s decarbonisation efforts and
overall sustainability strategy.
•Cadeler’s People and Culture Department (onshore HR) and Marine HR Department (offshore HR)
are responsible for employment-related matters, including ensuring the Company follows up-to-
date labour standards, maintains a positive work environment and that personnel receive proper
training to keep up with potential changes arising from the transition to a sustainable economy.
•Cadeler has an Ethics and Compliance function that manages risks related to Company governance,
anti-bribery and corruption practices, human rights practices, etc. This function works in
coordination with the Procurement Department to push Cadeler’s expectations for sustainability
practices towards Cadeler’s supply chains and monitor supply chain risks due to issues such as
human rights and corruption.
•The Health, Safety, Environment and Quality (HSEQ) Department manages risks to workers in the
workplace and ensures that the Company’s safety management system implements appropriate
measures to protect the health and safety of Cadeler’s workforce.
•The Legal Department contributes to the preparation of the Sustainability Report through ongoing
regulatory monitoring, advising on governance-related matters, and ensuring that the Company’s
operations remain aligned with applicable environmental and social standards.
•The Core Finance team oversees the preparation of non-financial reporting, performs internal audits
of sustainability data, and ensures the report’s compliance with the Corporate Sustainability
Reporting Directive (CSRD).
The CEO has overall responsibility for important ESG matters and escalates issues to the Board of
Directors as they have the ultimate responsibility. A review of climate-related matters is conducted
periodically in coordination with the publication of the Annual Report. The Board uses this opportunity to
reassess how sustainability is embedded into the Company's strategy and governance framework. Other
important matters arising throughout the year are handled on an as-needed basis. Any matters
originating from Cadeler's employees are introduced to the Board of Directors through the CEO.
Cadeler’s corporate governance framework is intended to decrease business risk, maximise value and
utilise the Company’s resources in an efficient and sustainable manner for the benefit of shareholders,
employees and society at large.
The Board has delegated specific responsibilities for the management of material impacts, risks and
opportunities (IROs) and has established clear goals for the Company in its Corporate Social Responsibility
(CSR) policy and instructions to the Executive Management, both of which form part of Cadeler’s corporate
governance documentation. The Board is responsible for ensuring that Cadeler has sound internal controls
and systems for risk management (including those in respect of corporate values, ethical guidelines and
guidelines for CSR) that are appropriate and in proportion to the nature and scale of the Company's
activities.
To support the Board on matters related to sustainability, a broad range of expertise is directly represented
at executive and senior leadership levels through subject matters experts including the Chief Sustainability
and Performance Officer, Chief People and Culture Officer and Chief Legal Officer.
The Board must, at a minimum, carry out an annual review of the Company's risk exposure and risks
management, including CSRD topics. The Board ensures that such reporting reflects the Company's
corporate social governance performance, strategy, policies and targets.
47
ESG Processes and organisation
Continued from previous page
ESG Internal Communication
____________________________________
ESRS 2 GOV-2 - Information provided to and sustainability
matters addressed by the undertaking’s administrative,
management and supervisory bodies
The Board sets the overall direction for Cadeler’s sustainability
engagement through approval of major policies, targets,
performance metrics, material IROs, and through its review and
approval of the Annual Report, including the Sustainability
Statements. Management’s proposal for the material IROs is
presented in the first instance to the Audit Committee, and
subsequently to the Board of Directors. For the first time in 2024,
the Board of Directors considered all material IROs as part of its
review of Cadeler’s Double Materiality Assessment (DMA).
Although Cadeler has a process to inform Management of material
IROs, the Company is implementing a formal structure to report on
its due diligence processes and the effectiveness of sustainability-
related IROs, consistent with its enterprise risk management
framework.
ESG Performance and Incentives
________________________________________
ESRS 2 GOV-3 – Integration of sustainability-related
performance into incentive schemes
Sustainability-related measures are included in the Company’s
corporate key results and performance against such metrics is
considered in the determination of the annual bonus remuneration
for all Group employees, including members of the Company’s
Management team. In 2025, sustainability-focused targets
represented 16.6% of the Company’s corporate key results (with the
corporate key results having weighting of 70% in the calculation of
individual incentive awards, meaning that the portion of incentive
compensation directly linked to sustainability targets was 11.6%).
Climate-related considerations are not currently individually
factored into the remuneration of members of the Company’s
administrative, management or supervisory bodies. The
sustainability-related metrics cover both safety culture, overseen by
the HSEQ department, and sustainability, managed by the
Sustainability and Performance department. Regarding safety
culture, the incentive is based on the level of implementation of the
management system. For sustainability, the metric used in the
calculation is the level of completion of sustainability training. These
targets are described in the Objectives and Key Results (OKR)
accessible to all employees via the Company’s intranet.
Sustainability-related performance included in Cadeler
Remuneration Policy, sets out the principles for remuneration of the
Executive Management and the Board of Directors. The
Remuneration Committee reviews the remuneration annually, with
final approval by the Board of Directors.
ESG Due Diligence
________________________________________
ESRS 2 GOV-4 – Statement on due diligence
Cadeler aims to progressively strengthen the integration of
sustainability considerations into its governance, strategy and
operational decision-making processes. In 2024, the Company
established the position of Chief of Sustainability & Performance
Officer to support the integration of sustainability considerations
into its overall strategy. This role facilitates communication between
operational teams and Executive Management by keeping the
Executive Senior Leadership Team regularly informed of
sustainability-related impacts, risks and opportunities
The Audit Committee has overall responsibility for overseeing risk
management and internal control systems. In 2025, Cadeler further
developed its Internal Control over the Sustainability Reporting
(ICSR) framework.This includes the implementation of a new
reporting system for financial and sustainability information, thereby
supporting the Company in strengthening data monitoring and
further automating the reporting process.. In addition, Cadeler
decided to develop and implement additional preventive and
detective controls designed to reduce the risks of omissions and
misstatements in sustainability reporting.
In 2024, the Company conducted a DMA to identify and evaluate
material IROs. The process involved relevant internal functions and
subject matter specialists. The assessment considered:
•The potential and actual impacts of the Company’s
activities on environmental and social matters; and
•The financial risks and opportunities arising from
sustainability-related matters.
48
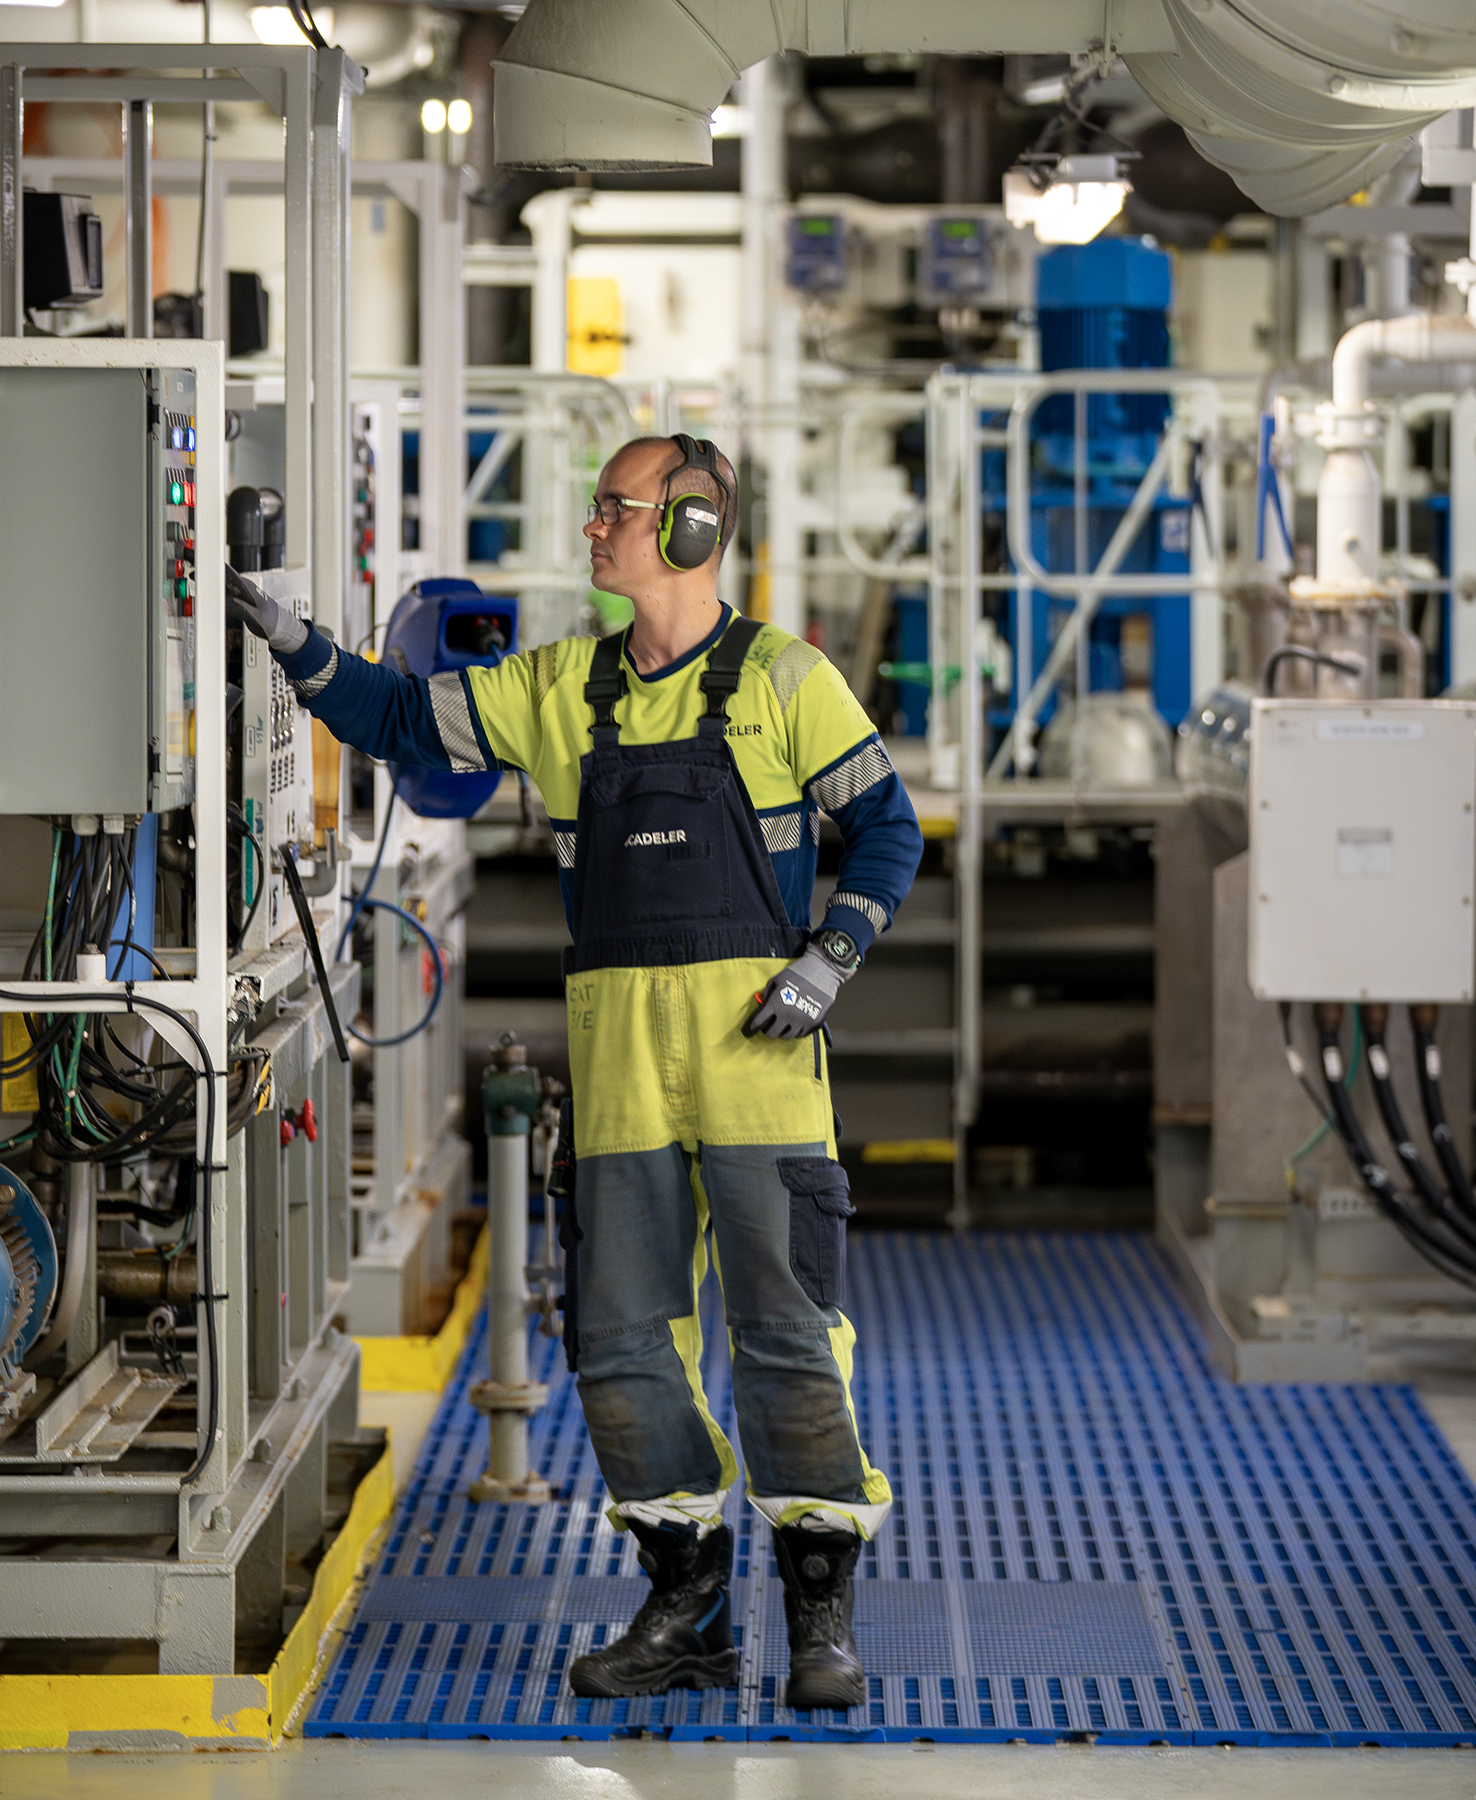
ESG Processes and organisation
Continued from previous page
The outcomes of the DMA continue to inform the Company’s
sustainability reporting and prioritisation of actions in 2025. The
Company intends to periodically review and update the assessment
to reflect changes in its activities and operating context.
In addition, a Human Rights Impact Assessment (HRIA) was
performed in early 2025 to identify salient human rights risks
associated with the Company’s operations and supply chain. Based
on this assessment, the Company formalised a three-year plan aimed
at addressing identified human rights risks.
The Company has established policies and procedures intended to
promote responsible business conduct across its operations and
value chain. Before entering any business relationship, suppliers are
subject to an assessment carried out by Procurement and Health and
Safety to ensure compliance with Cadeler’s policies. During the
Request For Quotation (RFQ), suppliers are requested to provide
information regarding their ISO certifications, including ISO 45001,
ISO 14001 and ISO 9001.
The Company’s governance framework also includes:
•Supply Chain Code of Conduct that sets out requirements
for suppliers in relation to environmental management,
health and safety, human rights, labour practices, business
ethics and community-related matters,a
•An HSEQ framework including Health, safety, environmental
and quality considerations; and,
•A Sustainable Development Policy outlining commitments
relating to environmental protection, labour standards and
human rights.
While policies are in place, the Company acknowledges that further
development of procedures and monitoring mechanisms is ongoing
in order to strengthen oversight and consistency of implementation.
Cadeler plans to identify areas for improvements through the
sustainability ratings and questionnaires so that sustainability
considerations are progressively integrated into the Company’s
strategy, governance and business model. In order to fully integrate
sustainability and improve due diligence, the Company plans to work
on ESG data so that the monitoring of the Company’s actions can be
evaluated more precisely and the targets defined with more insights.
Sustainability due diligence is part of Cadeler’s sustainability
performance and as such the Company considers that it needs to
keep progressing every year to contribute, where relevant, to
selected United Nations Sustainable Development Goals (SDGs)
through its policies, actions and targets. Cadeler has identified the
following goals to which it seeks to contribute:
•Good health and wellbeing,
•Decent work and economic growth,
•Affordable and clean energy,
•Reduced inequalities,
•Responsible consumption and production,
•Life below water,
•Climate action,
•Partnerships for the goals.
49
CORE ELEMENTS OF DUE DILIGENCE | PARAGRAPHS/SECTIONS IN THE SUSTAINABILITY STATEMENT |
a) Embedding due diligence in governance, strategy and business model | •Disclosure of how administrative, management and supervisory bodies determine whether appropriate skills and expertise are available or will be developed to oversee sustainability matters •Information about identity of administrative, management and supervisory bodies or individuals within body responsible for oversight of impacts, risks and opportunities •Disclosure of whether, by whom and how frequently administrative, management and supervisory bodies are informed about material impacts, risks and opportunities, implementation of due diligence, and results and effectiveness of policies, actions, metrics and targets adopted to address them |
b) Engaging with affected stakeholders in all key steps of the due diligence | •Interests and views of stakeholders •Description of methodologies and assumptions applied in process to identify impacts, risks and opportunities |
c) Identifying and assessing adverse impacts | •Description of methodologies and assumptions applied in process to identify impacts, risks and opportunities •Description of material impacts resulting from material assessment |
d) Taking actions to address those adverse impacts | •E1: disclosure of transition plan for climate change mitigation •E1: actions and resources related to climate change mitigation and adaptation •E2: actions and resources related to pollution •E5: actions and resources related to pollution •S1: action plans and resources to manage its material impacts, risks and opportunities related to its own workforce •S2: disclosures of actions on material impacts on value chain workers and approaches to managing material risks and pursuing material opportunities related to value chain workers, and effectiveness of those actions |
e) Tracking the effectiveness of these efforts and communicating | •E1: Disclosure of whether and how GHG emissions reduction targets and (or) any other targets have been set to manage material climate-related impacts, risks and opportunities •E1: Tracking effectiveness of policies and actions through targets •E2: Tracking effectiveness of policies and actions through targets •E5: Tracking effectiveness of policies and actions through targets •S1: Targets set to manage material impacts, risks and opportunities related to own workforce •S2: Disclosure of targets related to managing material negative impacts, advancing positive impacts and managing material risks and opportunities |
50
ESG Processes and organisation
Continued from previous page
Managing ESG reporting Risks and Controls
______________________________________________________
ESRS 2 GOV-5– Risk management & internal controls over sustainability
reporting
Cadeler integrates sustainability‑related risks into its overall
enterprise risk management (ERM) framework, ensuring these risks
are assessed and monitored alongside broader risks. The process
provides a structured approach for identifying and evaluating risks.
The risk assessment covers sustainability‑related risks such as working
conditions, health and safety, anti‑corruption and bribery, and
climate change. Risks are prioritised based on likelihood, potential
impact, and time horizon. Mitigating actions are defined and
implemented by designated risk owners in collaboration with relevant
functions. Cadeler’s sustainability‑related risks and associated actions
are disclosed within the relevant ESRS sections of this Sustainability
Statement. Cadeler has established internal controls over
sustainability reporting aimed at reducing the risk of
misstatements or incomplete information. In preparing its
Sustainability Reporting, Cadeler manages each business element
linked to the sustainability data to be published by:
•Ensuring the integrity and consistency of Internal Control
over Sustainability Reporting (ICSR),
•Identifying and assessing the risks and providing the Audit
Committee an objective perspective on potential exposure,
•Evaluating the existence, adequacy and design of controls
to ensure the reliability of Sustainability Reporting,
considering its materiality and complexity,
•Monitoring execution of controls in accordance with the
definitions set out in the risk and control matrices, through
inspection of supporting evidence and consultation with the
controls owners (scheduled for implementation in 2026),
•Contributing to the implementation of the corrective actions
identified through reviews of ICSR, and
• Assessing and evaluating ICSR supporting documentation,
confirming that all risks and controls have been properly
documented (to be carried out in 2026).
Risks identification must consider the concept of DMA as defined in
the CSRD. DMA aims to identify, assess and categorize IROs. Control
activities are designed to prevent errors or fraud that could affect
Sustainability Reporting and, more broadly, Cadeler’s ESG strategy.
Accounting manuals have been developed for ESRS datapoints to
establish data collection and recording processes and facilitate
review. Sustainability data undergo at least two levels of review, and
each datapoint is reviewed by someone other than the individual
responsible for its collection prior to publication of this report.
Cadeler began integrating sustainability reporting into its systems in
2025 and will continue enhancing this automation in 2026.
As a fast-growing Company, Cadeler acknowledges that its expansion
creates new risks. Accordingly, Cadeler takes into account the
evolving context of the Company, including, for example:
•An increasing number of assets,
•A growing workforce,
•Expansion into new markets.
The Audit Committee reviews both sustainability and financial
reporting. Review of Sustainability Reporting occurs on an annual
basis, while review of the processes and resources dedicated to
sustainability reporting has occurred as needed throughout the year.
The findings from the risk assessment and internal control activities
related to the sustainability reporting process are integrated into the
operational processes. Identified risks and control deficiencies are
communicated to the relevant functions, including the Sustainability
and Core Finance. Based on these findings, corrective actions and
control enhancements are defined and incorporated into existing
procedures, such as data collection protocols, validation controls and
reporting guidelines. Core Finance coordinates the implementation of
these improvements. Alignment with the Company’s overall internal
control framework will be integrated in the coming years. Significant
findings and remediation actions are reported to Senior Leadership
and, where relevant, to the Audit Committee. Progress on the
implementation of corrective actions will be monitored periodically to
ensure continuous improvement of the reliability and robustness of
the sustainability reporting process. Risks were identified for each
sub-process based on their ESG impact and likelihood of occurrence.
Data collection is inherently subject to some level of measurement
uncertainty. Uncertainties exist for some variables that are difficult to
measure and which require a proxy, while some datasets are based
on sampling. Some factors require assumptions in order to either
calibrate data or fill in data gaps. Examples include using financial
spend-based estimates for certain categories of scope 3 emissions,
application of proxies for data gaps. Where Cadeler uses proxies,
assumptions, conversion factors, etc., it aims to have multiple people
involved in the decision-making process to ensure that the reasoning
applied is backed by sound argumentation. The data collection
process is conducted by the end of the year to ensure the most up-
to-date information is reviewed and disclosed. A CSRD compliance
check is performed to ensure the disclosures meet ESRS
requirements. Both data collection processes are internally audited to
ensure they meet reporting requirements.
51
Strategy, business model and value chain
Continued from previous page
Sustainability Mission | Targets | Deep dive | |
Environment | Efficient operations with fewer emissions for every wind turbine installed, promoting circularity of resources and protecting the ecosystems and communities where Cadeler operates | 2030: | ESRS E1 |
Reduce company-wide scope 1 and 2 emissions intensity by 50% | ESRS E2 | ||
Source 100% of the electricity consumption from renewable sources | ESRS E5 | ||
Reduce waste from own operations by 50% | |||
2035: | |||
Deliver net-zero operations | |||
Reduce Scope 3 emissions by 35% | |||
Social | Maintain a safe, engaging, diverse, equitable and inclusive work environment on and offshore | 2025: | ESRS S1 |
30% women in leadership positions | ESRS G1 | ||
2030: | |||
40% women in leadership positions | |||
Ongoing priorities: | |||
Aim for zero lost time incidents and zero recordable cases | |||
Promote inclusivity in the workplace and zero tolerance for discrimination and harassment | |||
Ensure fair labour practices and develop promote respect for human rights | |||
Governance | Operate the business ethically and aim to implement practices that also hold Cadeler’s supply chain to the same standard | 2030: | ESRS S2 |
Work towards having all Cadeler’s key suppliers commit to the Supply Chain Sustainability Code of Conduct | ESRS G1 | ||
Ongoing priorities: | |||
Promote sustainability across value chain | |||
Perform supplier screening and due diligence for business ethics, human rights and environmental practices |


52
Strategy, business model and value chain
Continued from previous page
Cadeler’s Business Model
________________________________
ESRS 2 SBM-1 – Strategy, business model and value chain
Cadeler’s core business involves the safe, reliable and high-quality
installation of offshore wind turbines using cutting-edge specialised
Wind Turbine Installation Vessels (WTIVs). These vessels, which
Cadeler builds, owns and operates, are designed to operate
efficiently in challenging offshore environments, and Cadeler
continually invests in new vessels with innovative technologies and
processes to reduce emissions and minimise environmental impact.
Cadeler’s key inputs from a sustainability perspective include fuel
and energy for vessel operations, materials and components used in
fleet maintenance and upgrade projects, and the skills and expertise
provided by the workforce and suppliers. These inputs are sourced
through our operational activities and established supplier
relationships across the value chain.
Cadeler collaborates closely with developers, suppliers and other
operators to ensure timely and safe project execution. Cadeler has
offices in Denmark, the United Kingdom, Taiwan, Japan, Monaco
and the United States. Currently, the Company has vessels operating
off the coasts of Europe, Taiwan and the US. For further information
about the business model, please refer to the “Business Review”.
An overview of the Company’s business is presented in the
Management Review, in the This is Cadeler section. Key figures
relating to employee head count are presented below, in the
Management of the own workforce. Total revenue for the financial
year is presented in the Management Review, in Key Financial
Figures.
Cadeler’s Strategy towards a Sustainable Future
____________________________________________________________
Despite ongoing geopolitical uncertainties around the world, Cadeler
expects that the offshore market will continue to grow at a rapid pace.
Cadeler is well positioned to support the expansion of the offshore
renewables market, with a strategy built on delivering reliable,
efficient and lower-carbon services to the industry, thereby enabling it
to meet the growing global demand for renewable energy.
Cadeler recognises its role in supporting the energy transition and
advancing the industry’s move toward alignment with the Paris
Agreement. Cadeler’s strategic focus is to embed sustainable
practices and mindsets across its operations, allowing the Company
to build alliances around a shared vision, and create long-term value
for the Company’s shareholders.
To achieve this priority, Cadeler has implemented a Sustainable
Development Framework which is based on Company’s growth and
reviewed periodically. The Sustainable Development Framework is
committing to leadership in matters of environment, health and
safety, employment and corporate responsibility, both internally and
across the value chain. Cadeler pursues long-term objectives
towards sustainable growth, prioritising decarbonisation, operational
excellence and improving the circularity of its operations – while
ensuring the highest standards of ethics and compliance. These
goals and ambitions apply to the entire business of Cadeler,
focusing on offshore wind installation and O&M services.
Cadeler’s sustainability-related goals currently apply to all its operations.
As the Company currently provides only offshore wind installation and
maintenance services, these goals cover its entire business. If Cadeler
expands into activities with different sustainability considerations in the
future, it will establish specific goals appropriate to those operations.
Cadeler supports the Global Compact’s 10 Principles and the 17 UN
Sustainable Development Goals (SDG). The Company focuses on 8
SDG goals, relevant to its operations, using them to guide the
sustainable development strategy.
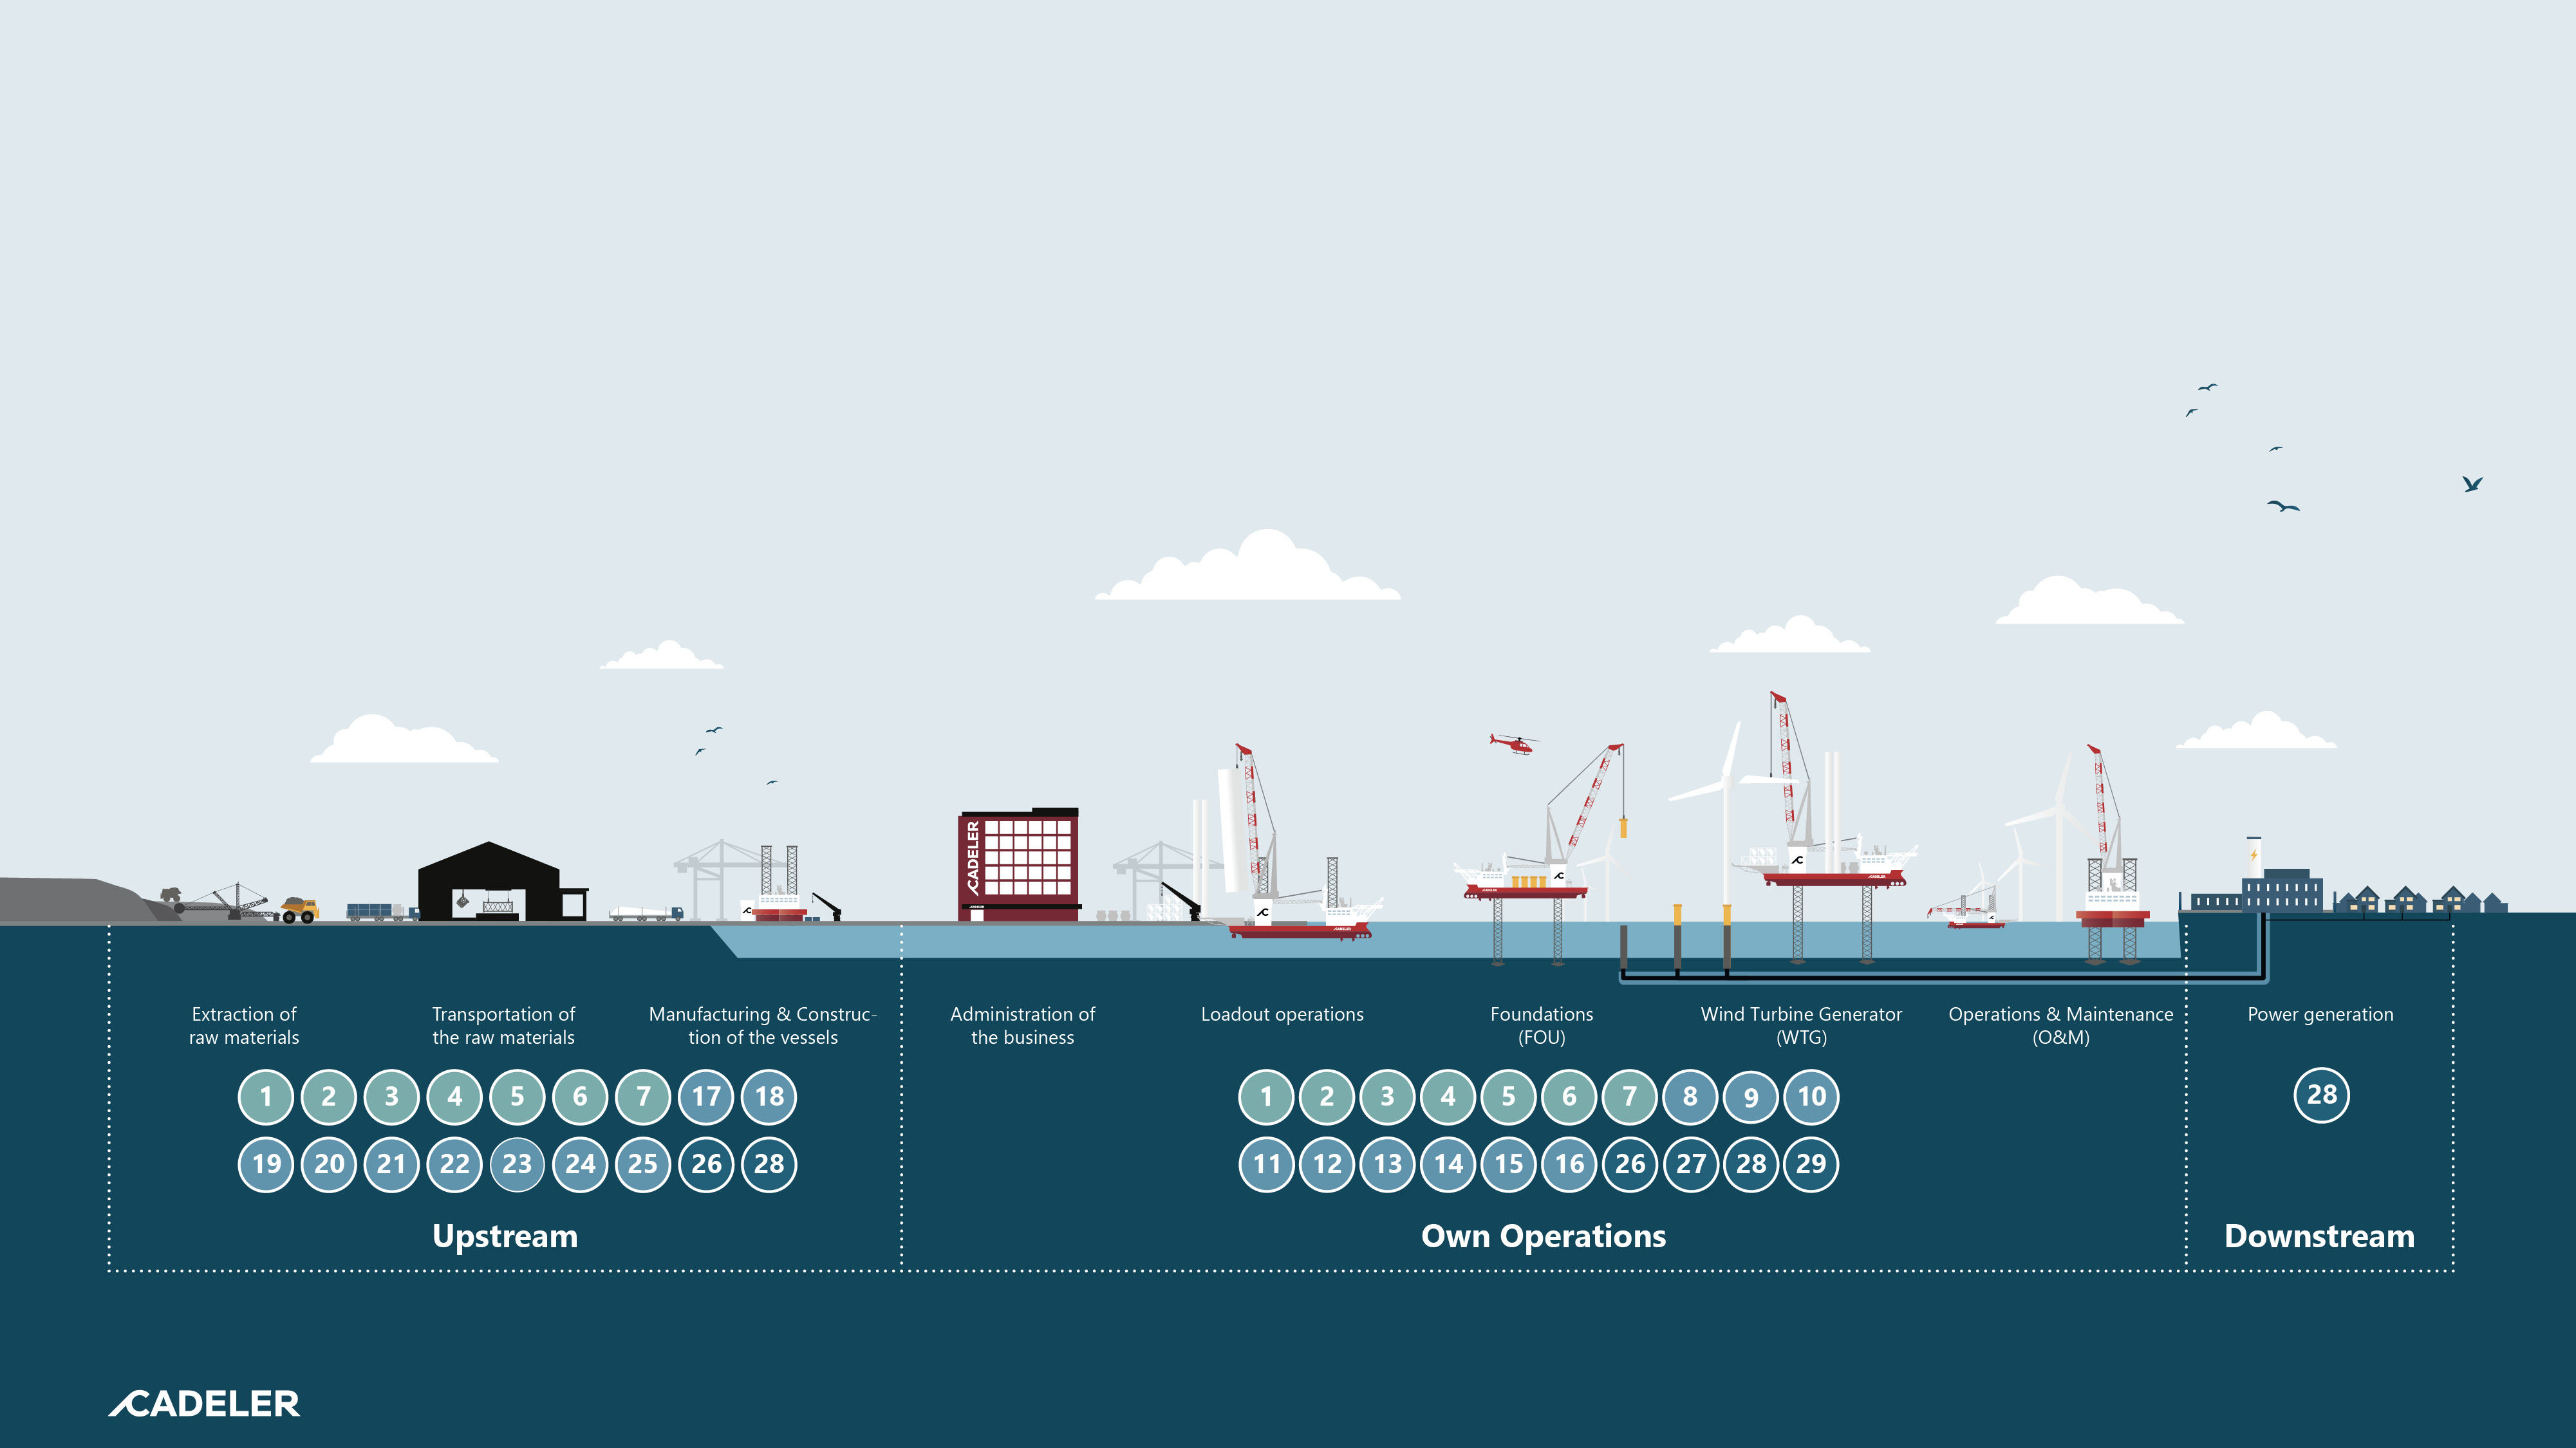
53
Strategy, business model and value chain
Continued from previous page
Creating value with Cadeler’s partners
________________________________________________
Cadeler actively engages with its value chain partners to promote
ethical conduct, sustainable practices across their products and
services, and respect for human rights. Cadeler’s key value chain
activities are illustrated below and include the construction of vessels,
the manufacture of vessel equipment, the manufacture of project-
specific equipment, energy and electricity (hydrocarbon fuels and
some renewables), engineering services, the provision of vessel
consumables and stores, the transportation of personnel and
equipment, and port services.
The icons displayed above are further detailed in the Double Materiality Outcome.
54
Double Materiality Assessment
Stakeholders’s ESG engagement
_________________________________________
ESRS 2 SBM-2 – Interests and views of stakeholders
In 2024, the outcome of the DMA, based on consultation with Cadeler’s main stakeholders, was aligned
with the topics previously identified by Cadeler. So stakeholders’ engagement generally reaffirmed that the
key focal points of Cadeler’s sustainability strategy are on the right track. A reassessment of marginally
immaterial topics has been performed in 2025. Further information is elaborated in the Cadeler DMA
approach in 2025. In general, stakeholder engagement is used to either reaffirm the direction of the
sustainability strategy or to identify areas where the current strategy may deviate from stakeholder
expectations. Where any gaps are identified between the Company’s current approach and stakeholders
expectations, Cadeler aims to use stakeholder feedback to inform potential changes to its strategy,
including policies, actions, and targets.
Cadeler engaged with different stakeholders in a variety of ways. The use of multiple approaches highlights
the diversity of stakeholders and reflects tailored engagement methods, ensuring that the Company
understands the stakeholders’ ESG expectations and industry standards. Engagement with the different
stakeholders has been coordinated by Sustainability and Performance, under the responsibility of the Chief
of Sustainability.
Cadeler plans to improve its process for engagement of stakeholders on an annual basis. Firstly, to ensure a
balanced distribution and holistic perspective, external stakeholders need to be selected based on distinct
clusters of stakeholders involved in or affected by the Company’s operations. Participants need to be chosen
to represent these clusters adequately, ensuring that all relevant perspectives are accounted for in the final
results. Regarding the management and employees’ selection, it is important to ensure a representative and
balanced selection by including employees from various departments and geographical regions, to obtain
feedback from a diverse cross-section of the workforce. Then, Cadeler expects to experiment with many
processes to get feedback: from one-to-one interviews, focus groups/workshops/online surveys or academic
and sector research or documentation analysis. The CSRD defines the frequency of sustainability reporting
under the ESRS as annual. However, Cadeler concludes, based on appropriate evidence, that the outcome
of the prior reporting period’s DMA is still relevant at the reporting date, so the preparation of the
Sustainability Statement as of 31 December 2025 uses the conclusions reached in 2024.
For the 2025 reporting year, no significant amendments were made to the business strategy or the
reporting model as a result of stakeholder engagement.
Stakeholders | Engagement | Purpose |
Customers & business partners | One-to-one meetings focused on ESG topics, client questionnaires, website reviews and audits. | Ensures alignment on ESG goals and understanding of client expectations. |
Employees | Workshops involving representatives from various departments with a focus on internal ESG initiatives. | Ensures employee perspective, drives ESG initiatives and informs company sustainability practices. |
Value chain workers | Indirect engagement through supplier and procurement activities. Staying up to date with guidance from organisations such as UN Global Compact. | To ensure ethical labour practices and sustainability in the supply chain. |
Industry bodies & regulators | Engagement with working groups on regulated topics using industry group guidance for shaping ESG policies. | To stay informed on industry standards, share best-practices and contribute to sector-wide sustainability efforts. |
Investors & Banks | Questionnaires, inclusion of ESG requirements in financing agreements and focus on standards such as SFDR and SASB that are broadly used in the financing sector. | To ensure alignment with investor expectations around sustainability and ESG reporting, ensure Cadeler complies with requirements for green financing instruments. |
Suppliers | Collaboration with procurement departments, internal workshops and reviews of supplier websites for ESG practices. | To assess suppliers’ ESG practices against international standards and ensure responsible sourcing and sustainability in the supply chain. |
55
Double Materiality Assessment
Continued from previous page
Financial effects of Cadeler’s ESG topics
__________________________________________________
●
ESRS 2 SBM-3 – Material impacts, risks and opportunities and their
interaction with strategy and business model
E1 Climate change
●
Climate change adaptation: Climate change poses a range of
acute risks to Cadeler and its supply chain. These risks include
potential unavailability of critical products, delays in vessel or
equipment delivery, and disruptions to port operations, all of
●
which can impact project timelines and costs. Additionally,
extreme weather events and changing climate conditions may
result in higher insurance premiums and increased operational
challenges. These climate-related impacts can have significant
consequences for both the Company and its stakeholders,
affecting financial performance.
●
Climate change mitigation: Climate change mitigation presents
both challenges and opportunities for Cadeler. Risks include
constraints on access to alternative fuels and the increasing cost
of carbon, which may increase operational expenses. New climate
●
protection legislation could impose additional compliance costs
or require significant adjustments to business practices. For
instance, the carbon pricing scheme ETS 2 requires polluters to
pay for their GHG emissions while generating revenues to finance
the green transition. Shipping companies are required to monitor
and report their emissions and surrender a corresponding
number of emission allowances. From 2027, Cadeler will be
required to report 100% of its carbon emissions. However, these
changes also bring opportunities, such as incentives for
advancements in renewable energy markets and potential cost
reductions through the adoption of more sustainable
technologies and practices.
●
Energy: Energy-related challenges and opportunities are also
important for Cadeler. Improvements in energy efficiency can lead
to cost reductions and potentially provide a competitive advantage
in the market. However, the limitations shore power due to
insufficient local grid infrastructure could result in continued reliance
on onboard power generation and increased operational costs.
E2 Pollution
Microplastics: Pollution, including the presence of microplastics in the
environment, presents potential financial risks for Cadeler. Changes in
EU packaging legislation could lead to increased products costs or
challenges related to the availability of compliant materials, affecting
both supply chain costs and product delivery. Additionally, compliance
●
with flag state requirements may impose additional operational and
compliance costs. These factors could result in fines, sanctions, and
reputational damage, as well as increased insurance premiums.
Adapting to evolving regulations and mitigating pollution-related risks
will be crucial to managing both financial and operational impacts.
Pollution of air: Air pollution regulations pose significant financial
and operational risks for Cadeler. Non-compliance with Emission
Control Areas (ECAs) or NOx limits could result in fines, sanctions,
and reputational damage. In response to increasingly stringent
environmental regulations, there may be a mandatory requirement
to install Selective Catalytic Reduction (SCR) systems on O-class
vessels and Wind Scylla, which could lead to substantial capital
expenditure related to retrofitting. In addition, extreme weather
events linked to climate change could disrupt operations, delay
projects, and increase operational costs. The combination of stricter
regulations and climate impacts may also influence access to
capital, as investors and lenders increasingly consider sustainability
and environmental risks in their decision-making processes.
Pollution of water: Effective control of water pollution has the
potential to provide Cadeler with a competitive advantage,
demonstrating environmental responsibility and compliance with
regulations. However, any adverse incident related to water
pollution—such as spills or contamination—could significantly
undermine this advantage, affecting the Company’s reputation and
public perception. Such incidents could also result in increased
regulatory scrutiny, fines, and additional operational costs,
highlighting the importance of maintaining robust environmental
practices to safeguard both the Company’s market position and
public trust.
E3 Water and marine resources
Water & Marine resources - Water discharges into the oceans:
Uncontrolled or unplanned water discharges into the ocean pose a
significant risk to both the environment and Cadeler's reputation.
Such discharges could negatively impact marine resources and local
water quality, leading to regulatory fines, sanctions and potential
reputational damage. In addition to the environmental
consequences, public perception of the Company could be
affected, making it crucial to implement stringent control measures
to prevent such incidents and ensure compliance with
environmental standards.
56
Double Materiality Assessment
Continued from previous page
●
E4 Biodiversity and ecosystems
●
Impacts on the state of species: Concerns regarding species
population levels and the potential impacts on biodiversity could
lead to cancellations of wind farm projects currently in the pipeline,
particularly if development sites are found to be in critical habitats.
Additionally, stricter environmental regulation could impose
limitations on working schedules, particularly during sensitive
breeding and migration periods for protected species, which may
further delay project timelines and increase operational costs.
E5 Resource use and circular economy
●
●
Resources inflows, including resource use: The transition to a circular
economy introduces both opportunities and risks for Cadeler,
particularly in terms of resource inflows and the use of resources. The
limited availability of critical materials could disrupt operations and
lead to project delays or increased costs. Additionally, the increasing
pricing on materials, including steel, driven by supply chain constraints
and market volatility, could further increase operational expenses.
These challenges underscore the importance of securing sustainable
supply chains and assessing alternative materials to mitigate risks
associated with resource availability and price volatility.
●
Resources outflows related to products and services: In the context
●
of a circular economy, resources outflows associated with the
disposal of products and services are becoming increasingly
important. More stringent EU regulation on vessel
decommissioning could result in higher costs due to enhanced
environmental and safety standards, requiring more complex and
potentially costlier processes for disposal and recycling. Similarly,
the introduction of stricter requirements for other equipment could
lead to increased operational expenses, as businesses may need to
invest in more sustainable and compliant solutions. These
regulatory developments emphasise the need for forward-looking
strategies in equipment lifecycle management and waste reduction.
●
Waste: Effective waste management becomes increasingly
important for Cadeler's operations. Improper waste disposal or
non-compliance with evolving regulatory requirements could lead
to fines and sanctions, as well as damage to the Company’s
reputation. Stricter requirements for waste handling and recycling
may further complicate operations, increasing both the cost and
complexity of compliance. The risk of non-compliance
underscores the importance of robust practices and proactive
●
management to avoid potential legal and financial penalties.
S1 Own Workforce
The working conditions of Cadeler’s employees may materially
impact operations as health and safety are paramount in the
shipping industry. Any incident at the industrial sites could result
in financial losses due to penalties and compensations related to
the incidents and adverse reputation impacts. Incidents can also
take the form of harassment towards employees. Such incidents
could lead to lost time, sick leave, a diminution of motivation and
●
less overall efficiency in the team in general. Consequently, it
could result in higher costs for the Company which Cadeler seeks
to anticipate and prevent.
S2 Workers in the Value Chain
Working conditions are also considered a risk for the workers in
the value chain, particularly from a training and skills development
perspective. Cadeler considers that strong performance can
increase efficiency and quality of services and products delivered
to Cadeler. Thus, the risk is mainly driven by cost efficiency
considerations.
Forced labour poses reputational risks from a financial
performance perspective. Any incidents of forced labour within
the supply chain may affect the Cadeler’s brand and reputation.
The Corporate Due Diligence Duty is considered by Cadeler as
part of its business and the Company seeks to manage this
process as an inherent part of its business practices to avoid any
costs, mainly fines, and impact on the revenue including loss of
business.
The protection of personal data represents matter that could bring
significant financial risks, particularly since the GDPR entered into
force. Any breach in terms of privacy that could appear within the
value chain would be financially and economically damaging to
Cadeler as improper management of personal data by Cadeler
could result in fines. An insecure whistleblower hotline may also
adversely affect the Company image and consequently its
commercial performance.
G1 Corporate Culture
Any incident related to corruption or bribery could result in
adverse impacts on the Cadeler’s brand, as well as fines and
increased legal defense costs. Management of suppliers’
relationship could affect suppliers’ willingness to engage with
Cadeler. This could affect the ability to procure necessary services
and goods, the possibility to improve cost efficiency, and Cadeler
can be liable for wrongdoing of a supplier in certain jurisdictions.
57
Double Materiality Assessment
Continued from previous page
Resilience of Cadeler’s Strategy and Business Model
____________________________________________________________________
Cadeler works to meet the ESG requirements of the countries in
which it operates. The Company aims to deliver effective monitoring
of its impact on these subjects, ensuring that risks associated with its
operations are appropriately identified and managed. To sufficiently
manage sustainability-related impacts, the organisation must
consider all the issues relevant to its operations, such as:
•Environment: Air pollution, water pollution, sewage
management, waste management, soil contamination,
climate change mitigation and adaptation, and resource use
and efficiency,
•Social: Working conditions, equal treatment and equal
opportunities for all, and other work-related rights
•Governance: Corruption and bribery, corporate culture, and
the management of relationships with suppliers including
payment practices.
To control and improve environmental and social performance,
Cadeler has a management manual, an HSEQ policy and a
sustainable development policy in place. These documents outline
the corporate practices for working towards a more sustainable
future, by maximising positive environmental impacts, minimising and
taking accountability for negative impacts. Cadeler’s ISO 14001:2015
certified environmental management system establishes a framework
formal policies, processes and requirements implemented to
minimise environmental impacts from its operations. It covers all
Cadeler’s vessels, operational sites, offices and activities. A dedicated
Ethics and Compliance (E&C) function has been established to be
able to monitor the performance of the Company and to set
ambitious targets in this area. Regulatory requirements can become
more restrictive, and it is important to anticipate such developments
and address them at an early stage.
Emissions for Scope 1, Scope 2 and Scope 3 activities are tracked and
reported annually. To report on emissions, Cadeler looks to the GHG
Protocol Corporate Standard as its guide. The Company uses the
definition of operational control to set its organisational boundary,
and therefore aims to account for emissions from all facilities and
assets where it has the authority to introduce and implement
operating policies. Cadeler has monitoring equipment installed on
board its vessels to track the consumption of fuel, lube oils and other
substances that eventually result in the release of CO₂ and other GHG
into the atmosphere. The marine gas oil purchased is required to
meet the sulphur emission caps applicable in the North Sea and
Baltic regions (0.1% concentration). Additionally, NOx emissions from
the vessels may not exceed the upper limits set out in MARPOL
Annex VI.
The Company monitors consumption of F-gases used as refrigerants.
Cadeler also has a water management plan in place, under which the
fresh water consumption is tracked and any discharges of ballast
water or grey water from the vessels are recorded. Another core
element of environmental management on board the vessels is the
garbage management plan. Cadeler records its total waste
generation and ensures waste segregation onboard enabling proper
management when waste is offloaded on the quayside. The vessels
also have a shipboard marine pollution emergency plan, which
outlines the practices intended to prevent spills into the ocean. It
ensures that crews are trained to respond in the event of an incident
and have the necessary clean-up equipment available.
Sustainability is part of Cadeler’s business model through the
Company’s contribution to climate change mitigation. However,
the shipping sector represents around 3% of global greenhouse
gas emissions. In response, the Company is taking steps to
enhance operational efficiency and reduce emissions where
feasible. As a fast-growing Company, Cadeler is still developing
its business model but the strategic direction towards a more
sustainable economy is clear. Even if the regulatory environment
is evolving slowly, the Company’s objective is to stay ahead of
European and National directives and legislation. For this reason,
sustainable data management is embedded in the Company’s
short-term and long-term strategy. The competitiveness of the
Company depends on its ability to anticipate and address
sustainability-related issues in the coming years. Cadeler has
designated dedicated departments responsible for managing
decarbonisation, sustainable development and environmental
matters.
58
Double Materiality Assessment
Continued from previous page
Impact, Risk and Opportunity management
_______________________________________________________
ESRS 2 IRO-1 - Description of the process to identify and assess
material impacts, risks and opportunities
As a large Company, Cadeler is required to disclose its material IROs,
which are in turn mapped to sustainability matters (i.e., topics,
subtopics, sub-sub-topics). In 2025, Cadeler assessed that no
significant events occurred that would trigger a major change in the
DMA, meaning that the IROs remained the same as those disclosed
in the 2024 Annual Report.
The process conducted in 2024 for the identification of IROs began
with an assessment of the Company’s overall context. To determine
the material topics, the Company first analysed its activities, business
relationships, value chain, affected stakeholders, and strategic
objectives.
Various stakeholders were involved, including internal specialists.
Cadeler overhauled its process for the performance of a materiality
assessment as compared to previous years to comply with the DMA
requirements under the CSRD. The process was divided into the
following steps:
Preparation
This step involved defining a long list of potentially material topics to
be included in the DMA. Cadeler considered all topics required in the
ESRS, including industry-specific topics from existing analyses and
material topics identified in previous years. The outcome was a
comprehensive list of potentially material ESG topics used for the
next step of the process.
Identification
This step involved gathering information relevant to assessing the
impact and financial materiality of the various topics. Cadeler
mapped its value chain and identified where IROs occur, set scope
boundaries, identified separate business areas, geographical linked
IROs, and received feedback from internal and external stakeholders
regarding their perception of relevant IROs. This step resulted in a
mapped value chain and a long list of IROs to be assessed for
materiality.
Assessment
In this step, Cadeler assessed the identified IROs for impact and
financial materiality. Workshops were conducted in which IROs were
reviewed line by line, first discussed by internal subject matter experts
and then ranked based on a defined set of criteria. IROs were ranked
for impact materiality based on scope, scale, irremediability and
likelihood, while they were ranked for financial materiality based on
the severity of the financial impact and likelihood. Based on the
scoring (from 1 to 5 for impact materiality and from 1 to 20 for
financial materiality), the ranking was classified into four categories:
insignificant, low, material, and critical. Cadeler chose to apply both
approaches in order to align financial materiality with the risk
approach already used for the Financial Statements. The results were
consolidated and calibrated before being presented to Executive
Management and the Audit Committee for final approval.
CSRD Preparation
Based on the results of the DMA, the material topics were mapped to
relevant ESRS disclosure points. Cadeler identified applicable
disclosure requirements and performed a gap assessment in 2024,
involving internal data owners, resulting in a list of material disclosure
requirements and datapoints. In 2025, the list of material disclosure
requirements was reviewed, with no changes to the scope of
disclosures, except for phase-in data points that became mandatory
due to Cadeler’s headcount exceeding 750 employees.
The connections between impacts and dependencies and the
associated risks and opportunities have been analysed to ensure the
business is not jeopardized. A climate-risk assessment has been
conducted to ensure that Cadeler’s assets and activities are not
significantly threatened by these impacts and dependencies. At the
same time, the organisation participates in an annual assessment of
its impacts and opportunities as part of the CSRD reporting process.
59
Double Materiality Assessment
Continued from previous page
Cadeler DMA approach in 2025
_______________________________________
In 2025, Cadeler reassessed topics that were marginally immaterial
in 2024.
Cadeler endeavoured to identify the business risks and
opportunities that ESG topics could bring. Cadeler considers that
ESG risks are pervasive and can affect the balance sheet, the P&L,
the cash flow in short-, medium- and long-term. Cadeler
organized workshops aiming to identify whether any change in
circumstances occurred, which would have conducted to a new
IROs assessment. It resulted from this analysis that no additional
material IRO needed to be disclosed.
In accordance with EFRAG implementation guidance, a value chain
mapping was prepared covering Cadeler’s key business segments,
activities, stakeholders, resources, customers, and geographical areas,
together with a mapping of upstream and downstream activities and
their associated internal and external resources. Every sustainability-
related risks within the value chain are presented to the Audit
Committee in the same manner as other types of risks. The Audit
Committee reviews all risks during the meeting, and the prioritisation
of the risks is discussed in this context.
In 2025, the results of the DMA were submitted to Executive
Management, which approved maintaining the same reporting
scope as in 2024, as no major changes to the business model
occurred. As in 2024, Cadeler has not yet formally integrated the
DMA into its overall business risk management processes. And yet,
the results of the DMA have been communicated to those
responsible for overall business risk management. Cadeler has not
yet determined how these processes can be more closely
integrated in future iterations. Cadeler intends to further elaborate
on this process in 2026.
Non-material topical standards
_______________________________________
No material IROs were identified for either S3 or S4 due to the
nature of Cadeler’s business which is offshore and service oriented
rather than product oriented. During the 2024 DMA, IROs were
identified for E3, but this was not assessed as material and
therefore, not reported in the Sustainability Reporting. Cadeler
considered its water withdrawals, water consumption, and water
discharges in its assessment. Water extraction and consumption
were not considered material due to operation in areas that aren’t
normally facing water shortages along with the ability to convert
seawater to fresh water on most of its vessels. Discharges were not
considered material as Cadeler treats blackwater and ballast water
onboard its vessels, and reports any potential pollution risks under
E2. For E4, Cadeler considered direct impact drivers of biodiversity
loss, including how the Company’s contribution to climate change,
seabed impacts, potential collisions with wildlife, ballast exchanges,
and noise disturbances may affect biodiversity. E4 has been
identified as material in 2025 reassessment. Cadeler uses the
phase-in option and is getting prepared to disclose information as
respect in 2027.
Biodiversity Materiality Assessment
_____________________________________________
Cadeler assessed Biodiversity and ecosystems as material from the
financial perspective. The assessed material IRO is the potential
cancellation of windfarms, limitations on working schedules and
potential for slowed growth of the industry due to limited available
zones for deployment or general public disapproval due to
impacts on species. Cadeler assessed that its own operations have
limited and largely temporary biodiversity impacts, mainly during
installation phases. Cadeler notes that the downstream value chain
(i.e. windfarm owners) have a longer term impact with a change in
sea-use within the offshore windfarm sites, but Cadeler has limited
control over windfarm developments.
Regardless, Cadeler acknowledges that biodiversity has become an
increasingly important topic and intends to outline a biodiversity
strategy in the coming years. Cadeler’s sustainable development
policy and HSEQ policies currently commit to reducing impacts on
the environment but do not currently make specific mention of
biodiversity. Cadeler will consider how to address the topic during
the next scheduled review of Company policies.
Cadeler has not yet set specific targets related to biodiversity, but does
take relevant actions to avoid negative impacts on biodiversity. The
Company’s fleet operates in compliance with IMO MARPOL
requirements, some of which are aimed at avoiding negative impacts
on marine ecosystems. Cadeler’s vessels operate with ballast water
treatment plants onboard; the vessels follow approved ballast water
management plans; Cadeler has performed patch tests for new paint
coatings in an attempt to find suitable less impactful products; the
Company uses noise mitigation measures for foundation installations in
areas assessed to have sensitive marine mammal populations and aims
to reduce its air emissions to reduce contribution to climate change and
other pollutant levels, which can have negative impacts on ecosystems.
60
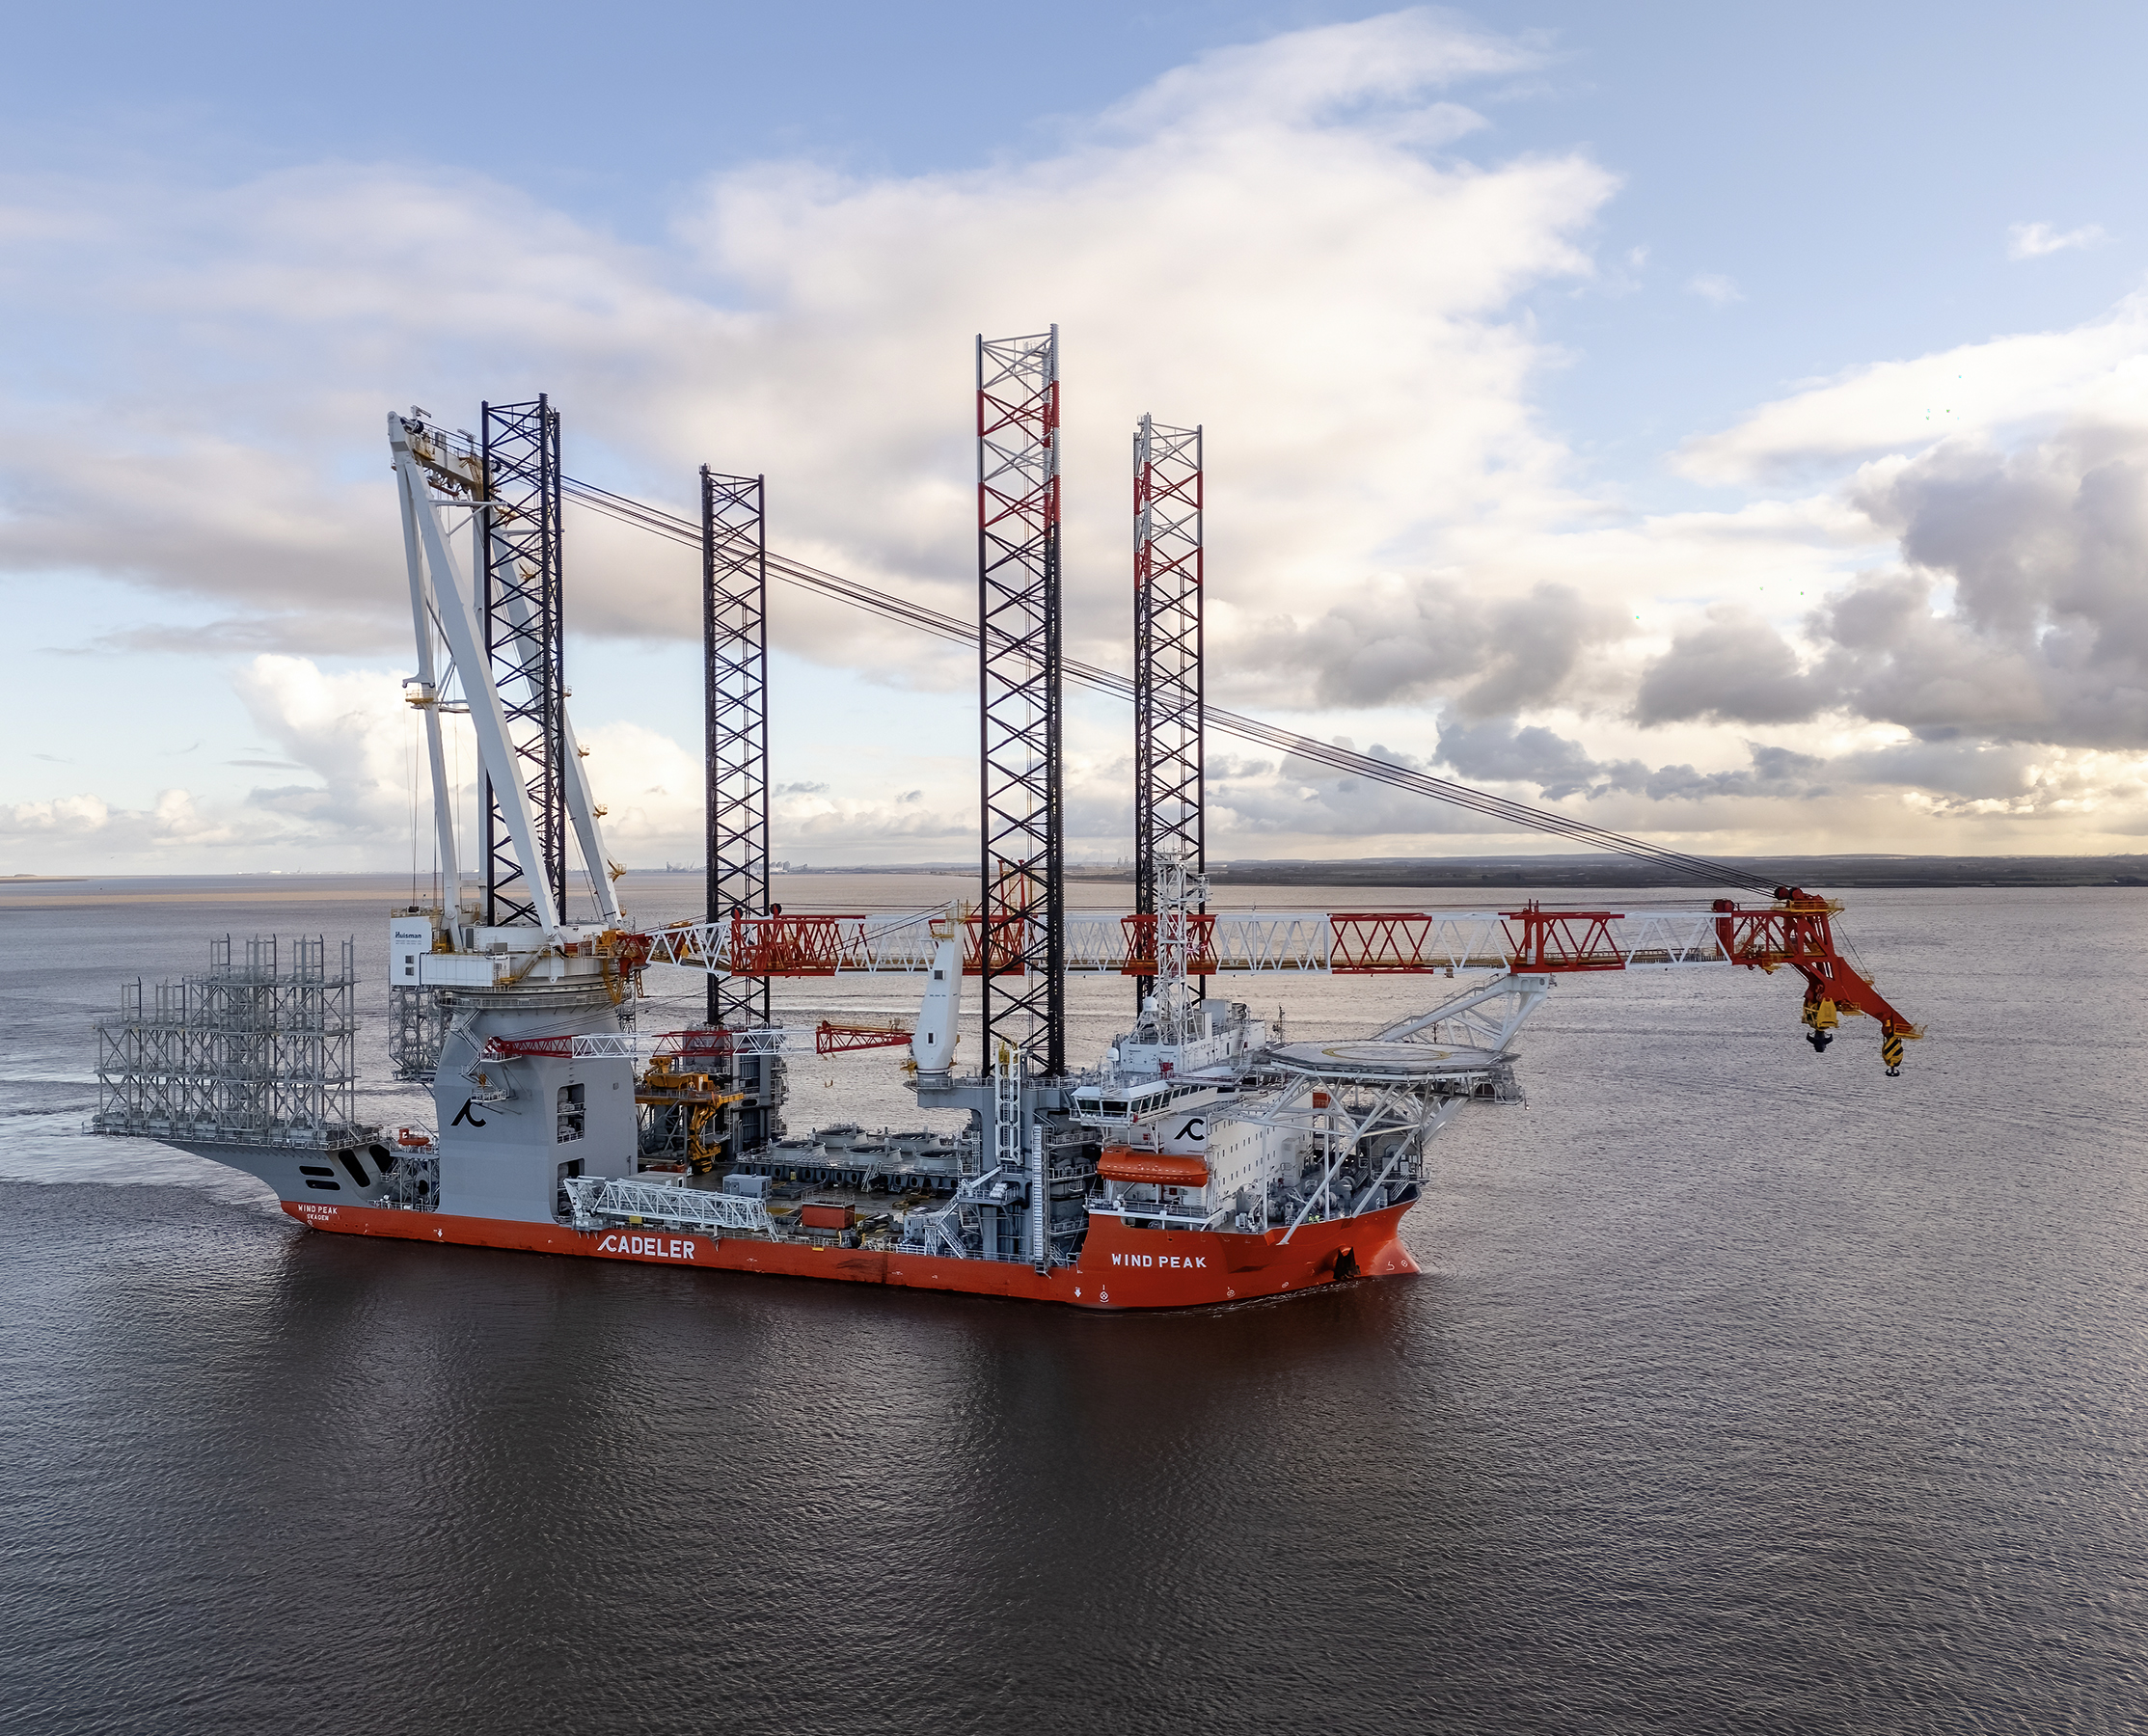
Double Materiality Assessment
Continued from previous page
ESRS 2 IRO-2 - Disclosure requirements in ESRS covered by the undertaking’s sustainability statement
Please see the section “ESRS 2 - Data points that derive from other EU legislation” and “Disclosure
requirements & incorporation by reference”.
Sustainability program is directly linked to the tables in annual report. Cadeler considers that its activities did
not change sufficiently in 2025 to justify any change to the identified material topics. However, as several
questions about Biodiversity impacts and dependencies were raised throughout the year, the
Decarbonisation and Performance department assessed the Biodiversity topic, resulting in the identification
of a material risk. Cadeler chose to apply the Phase-in option and the Biodiversity topic will therefore be
disclosed in the 2027 Sustainability Report. Since data collection for Biodiversity is particularly complex and
Cadeler aims to be well prepared for disclosing this topic, the next two years will be used for evaluating the
dependencies and impacts and to determine the metrics on which the Company will focus.
61
Double Materiality Assessment
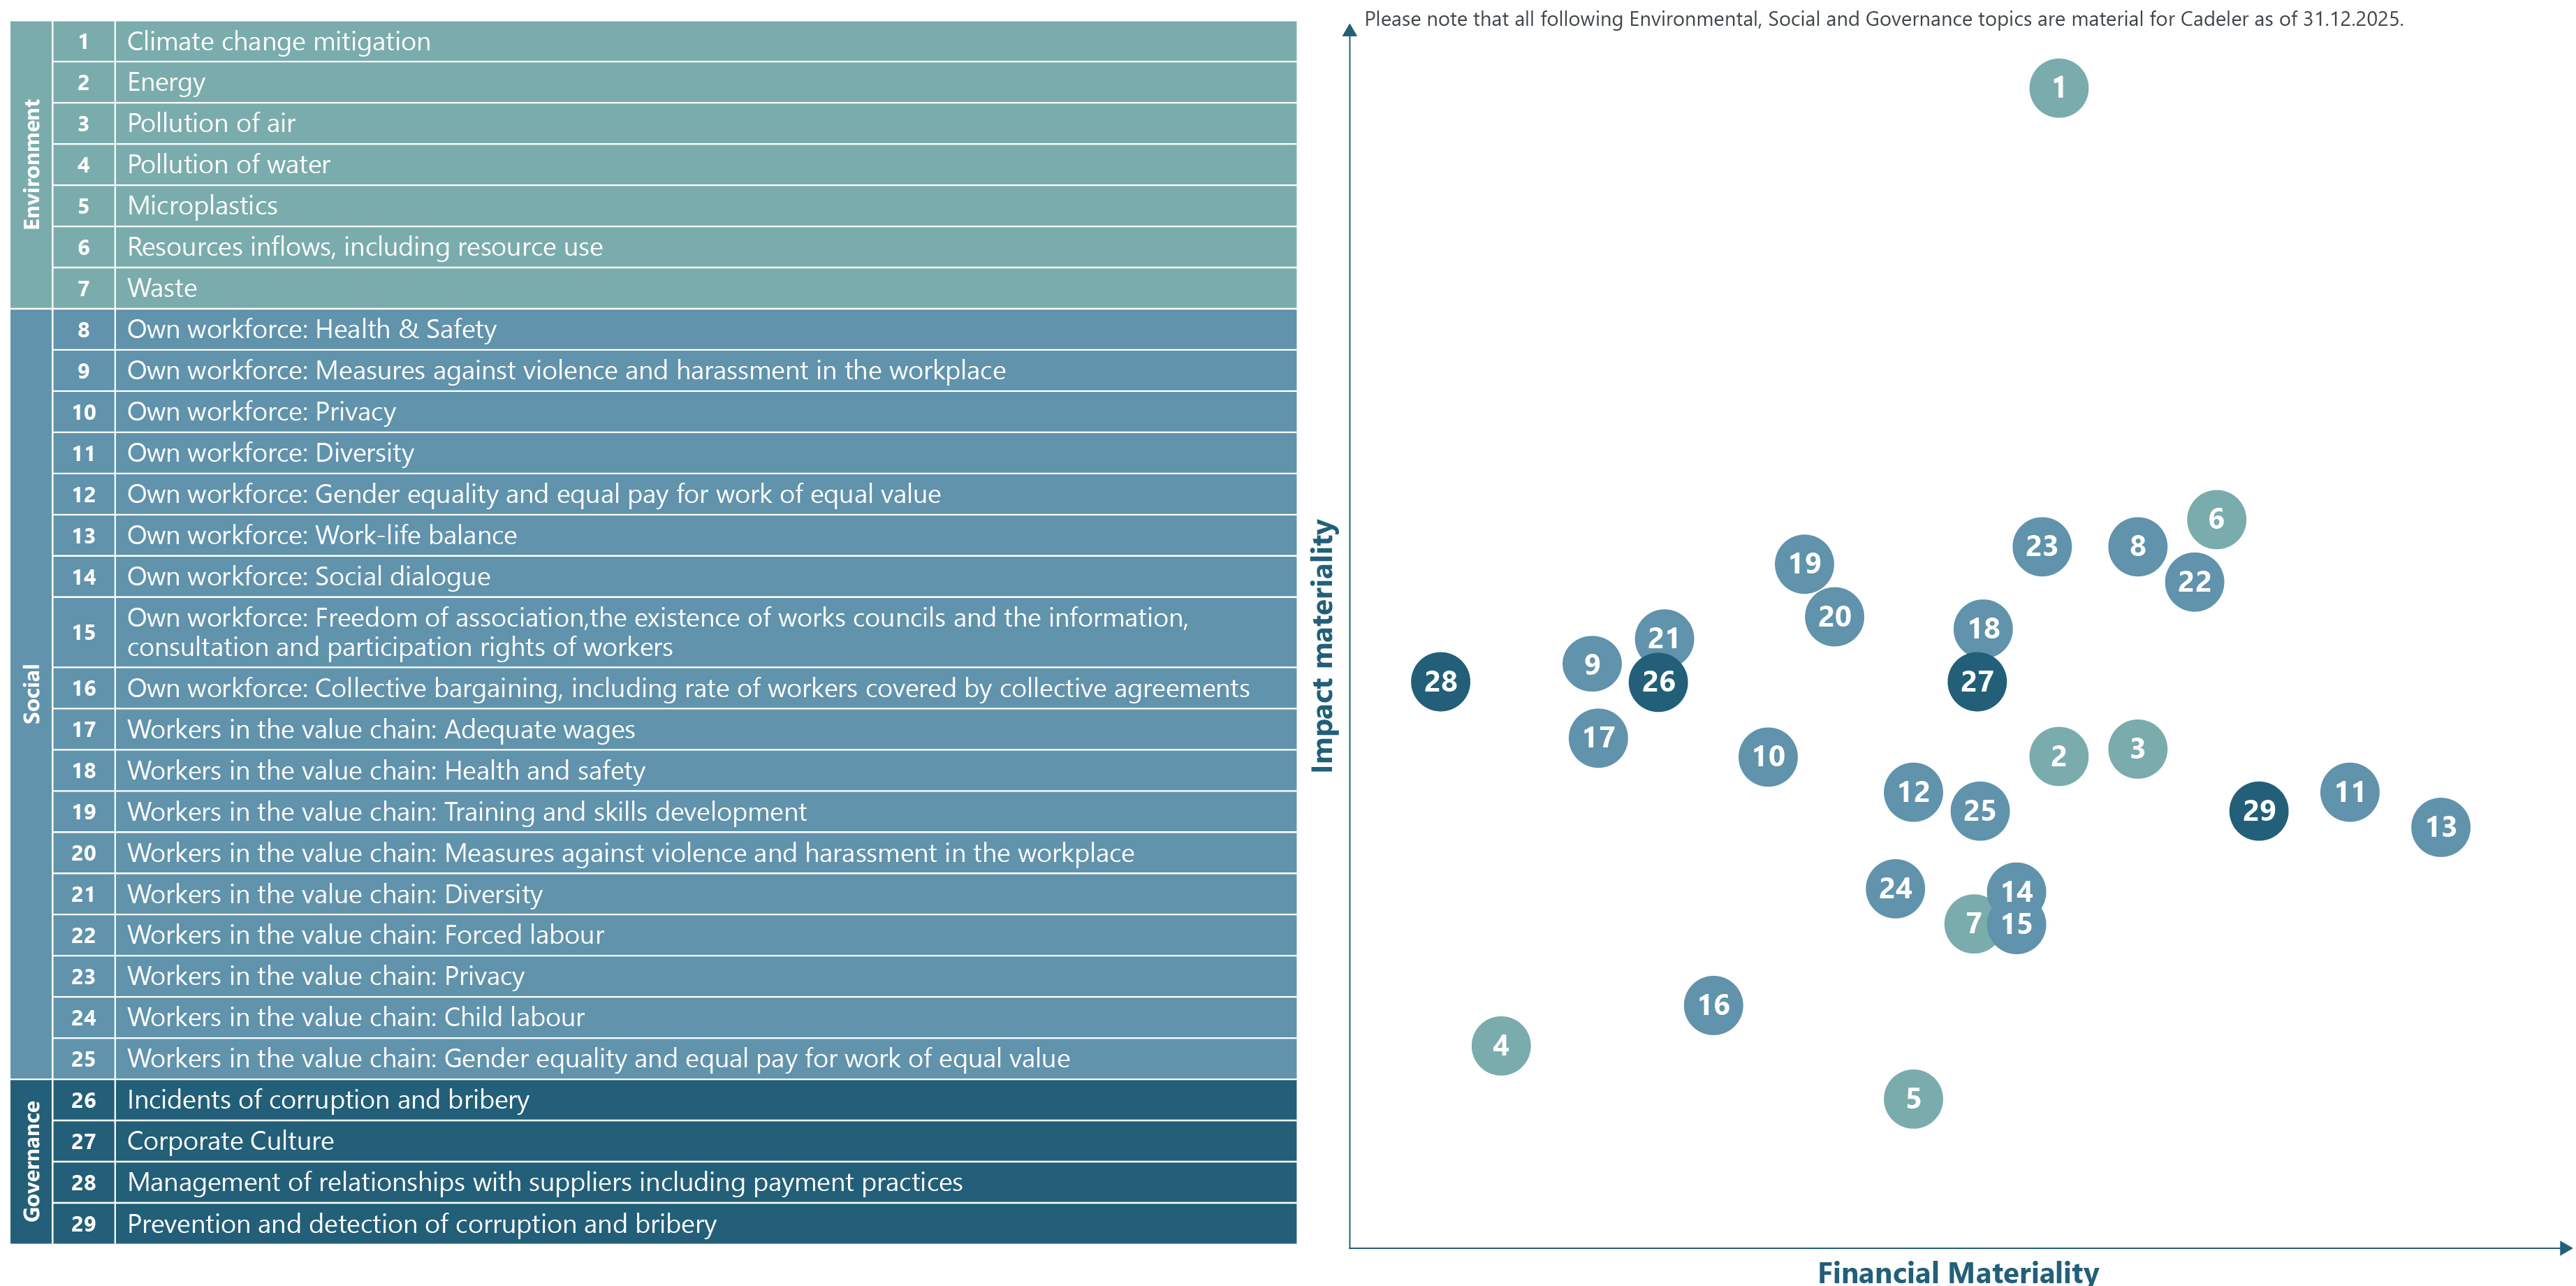
62
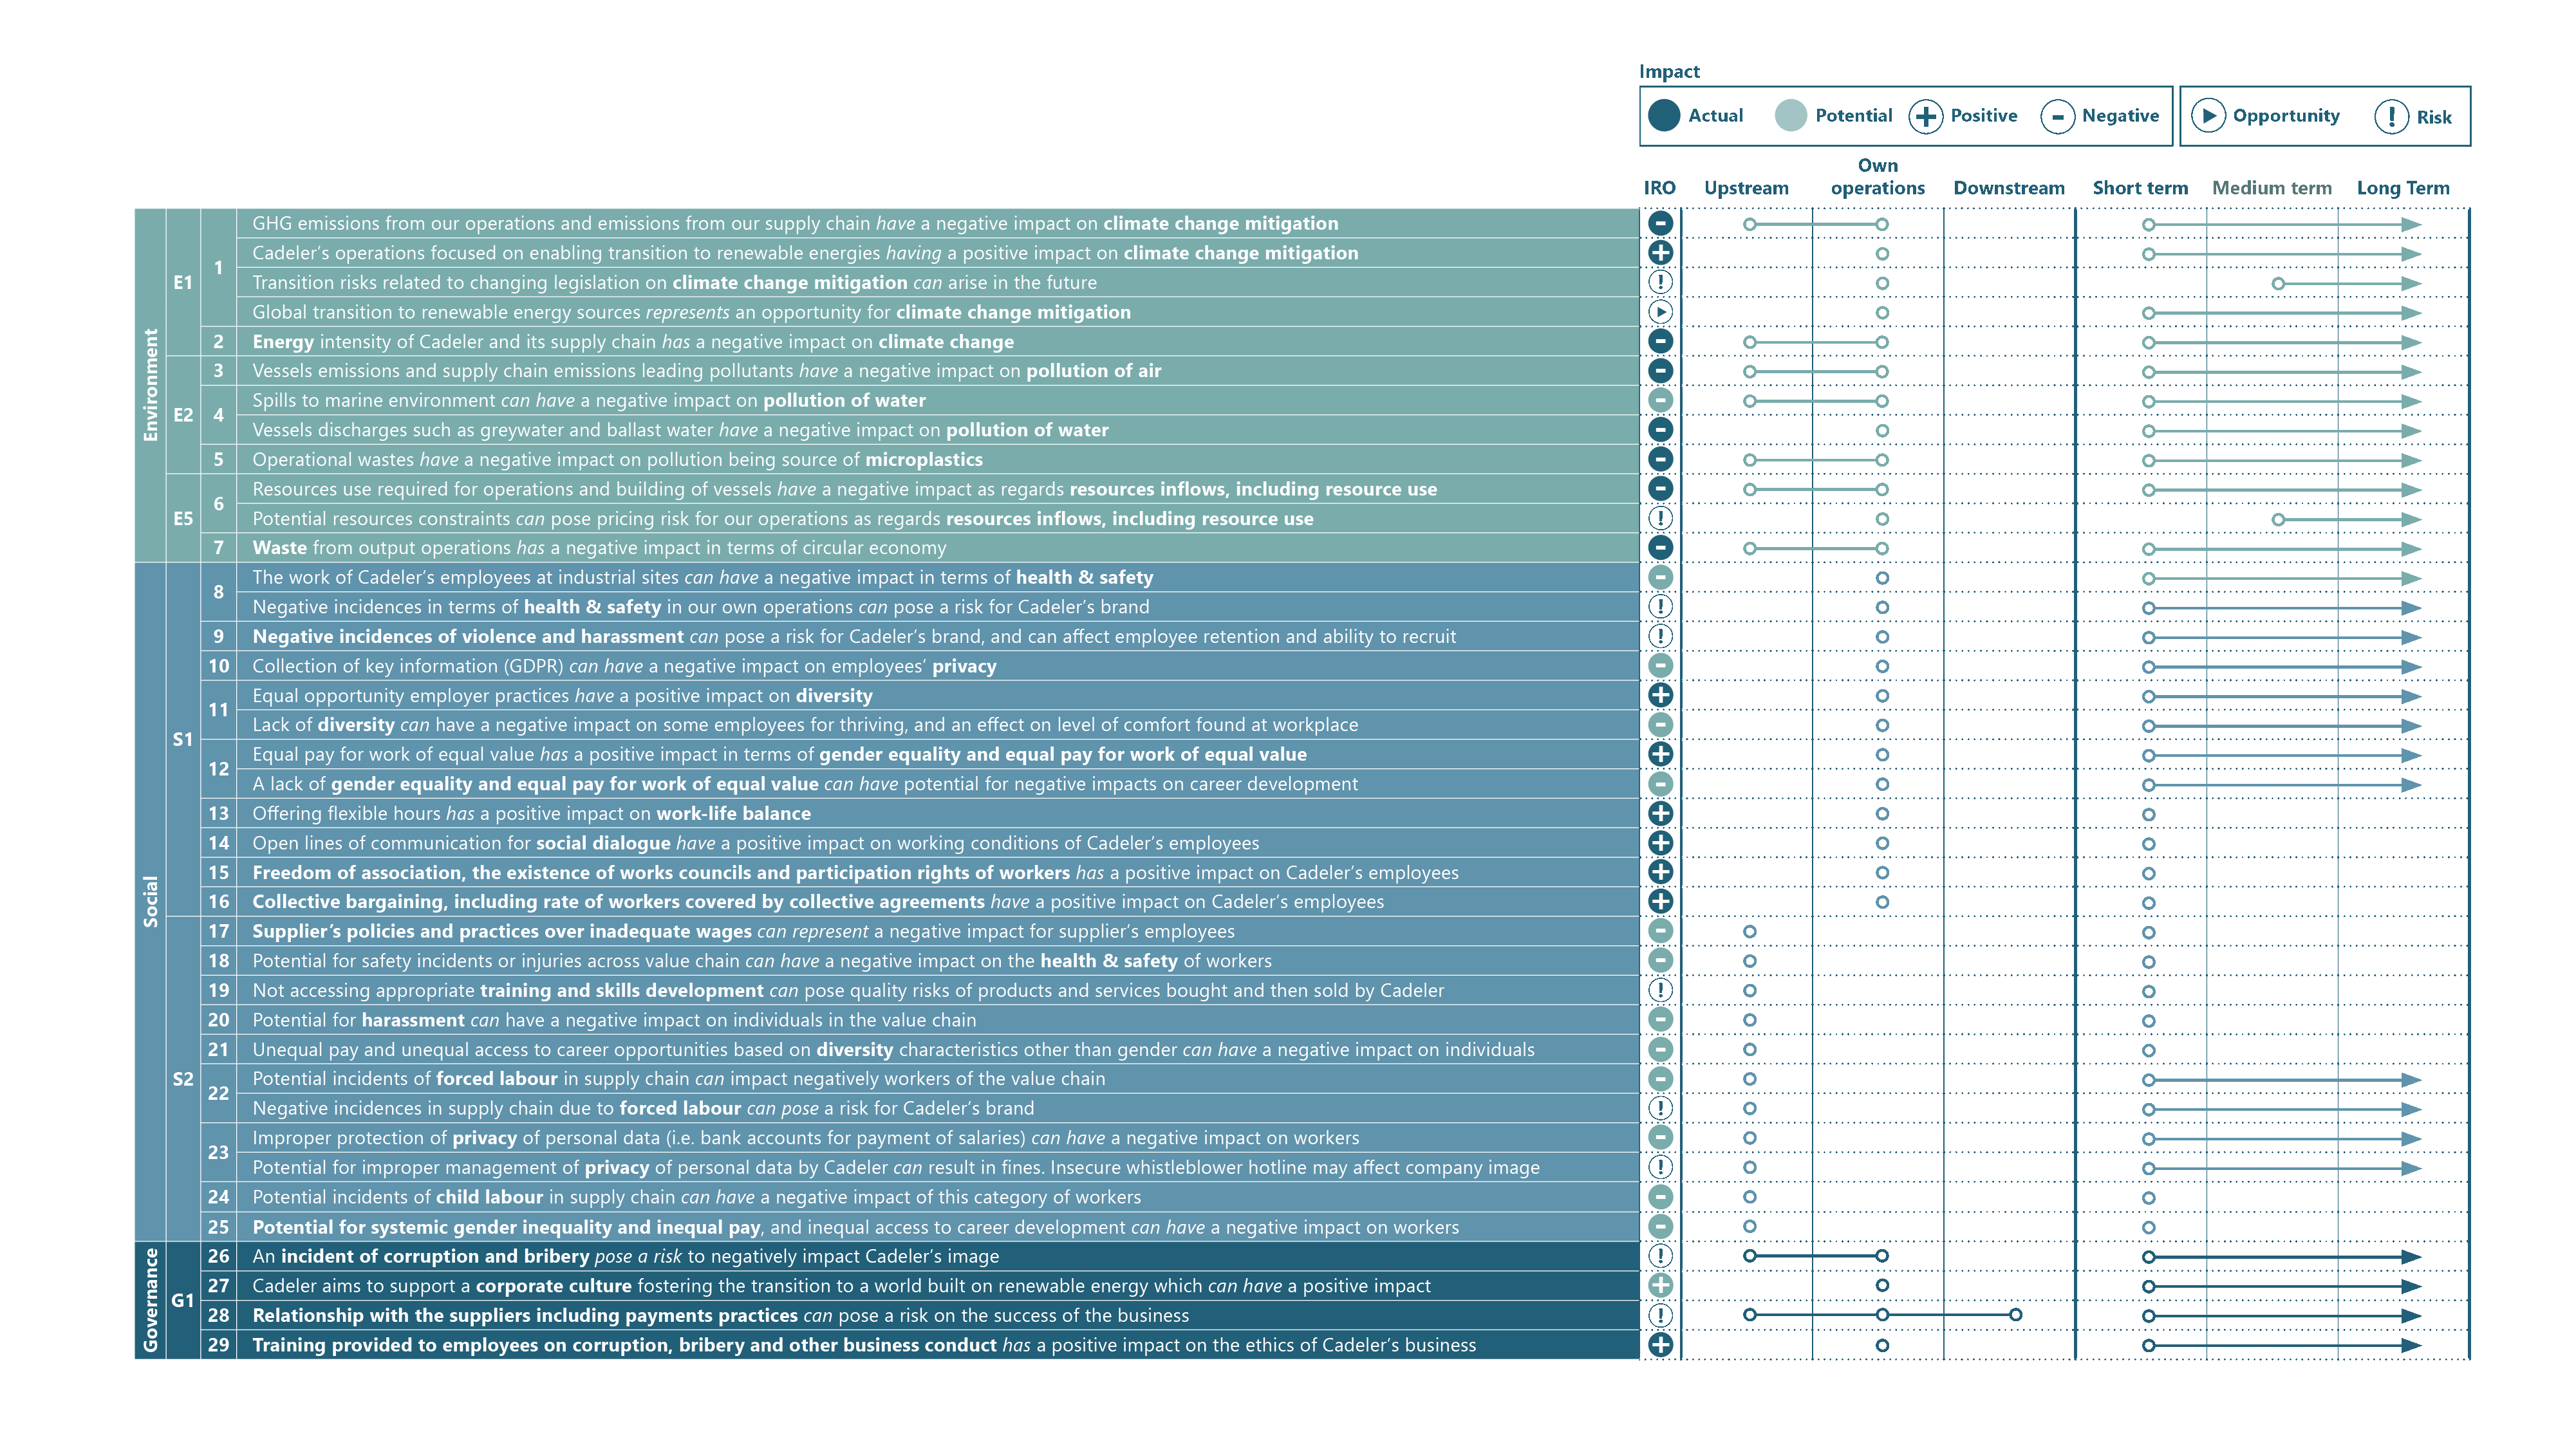
Double Materiality Assessment
63
Double Materiality Assessment
Description of material impacts, risks and opportunities resulting from materiality assessment


Climate change mitigation (E1)
Actual negative impact:
GHG emissions from operation of Cadeler’s windfarm installation
vessels, emissions from its supply chain: Cadeler's vessels currently
operate using marine gas oil as the main source of energy.
Although the purpose of operating Cadeler’s vessels is to install
and maintain offshore windfarms, the vessels require large
amounts of energy to perform the task at hand. Cadeler aims to
reduce its emissions of GHGs by focusing on improving energy
efficiency, making operational changes, and using increasing
amounts of renewable fuels and electricity to cover the Company
energy consumption. These improvements take time, but Cadeler
aims to reduce its impacts over the coming decade and aims at
closing the gap towards net-zero for its own operations by 2035.
Actual positive impact:
Cadeler is a pure play operator, solely focused on serving the
offshore renewables industry. The result of Cadeler services can

be measured in terms of MW installed or, indirectly, household-
equivalent electricity consumption installed and serviced.
Risk:
Transition risks related to changing legislation and climate
mitigation: increased political support for pushing climate
mitigation could see further measures similar to the EU ETS
implemented and having some financial impacts on companies.
Conversely, reduced support for the buildout of renewables
could see a slowdown in the market Cadeler serves.
Opportunity:
Global transition to renewable energy sources: Cadeler expects
continued growth in the global offshore wind industry and
therefore expects further opportunities for the growth of its
business.

Energy consumption of Cadeler and
its supply chain (E1)
Actual negative impact:
Cadeler's vessels require energy to operate, which is currently
supplied largely by fossil fuel sources. To reduce the negative
impacts of energy consumption, Cadeler aims to reduce energy
demand by implementing further energy-efficiency initiatives
and by decarbonising the energy it consumes.
Risk:
Potential resource constraints may pose pricing risk for key
resources for Cadeler’s operations: the key resources include
steel, marine gas oil, biofuels, methanol and other potential
fuels. The Company’s operations are quite dependent on access
to certain resources and energy sources. Variations in the market
value of certain items have the potential to impact the business.
Pollution of air (E2)

Actual negative impact:
Emissions of air pollutants are mostly related to the operation of
Cadeler’s vessels. A key part of the strategy is to use shore
power where available on future projects to reduce air pollutants
in ports, near population centres.
Pollution of water (E2)
Potential negative impact:
Offshore operations have an inherent risk of spilling fuel and
other chemicals into the marine environment. Cadeler works to
minimise this risk through proper chemical management, by
practicing oil cleanup drills and ensuring proper processes for
bunkering and storage of fuels and chemicals.
Actual negative impact:
Grey wastewater is generated by domestic activities such as
using sinks and showers or doing laundry and dishwashing.
Greywater can be contaminated with microplastics, micro-
organisms, chemicals such as detergents and other materials.
Ballast water is used in ship ballast tanks for stability. Ballast
water can be a source of invasive species upon release but is
treated on Cadeler’s vessels with ballast water treatment systems
that meet IMO requirements before being released back into the
oceans.
Microplastics (E2)
Actual negative impact:
Use of single-use plastics across Cadeler’s operations and value
chain contributes to the creation of microplastics after disposal.
Paint coats on the vessels contribute to microplastic pollution in
oceans as they break down over time, as does runoff from
onboard laundry services. Cadeler is in the early phases of
mapping its sources of microplastic pollution and aims to set
improvements in place that begin to reduce the Company’s
contribution to the global microplastic issue.
64


Resources inflows, including
resource use (E5)
Actual negative impact:
Resources use required for operations, building of vessels:
examples include mining of iron ore required for production of
steel that is used for building the vessels, cranes and project
equipment. Cadeler aims to identify opportunities for reusing
and using recycled materials where possible.

Waste (E5)
Actual negative impact:
Operational and accommodation waste from the vessels have a
negative impact on the environment. Waste from Cadeler’s
office buildings. Cadeler monitors waste output and has set a
target of reducing waste by 50% by 2030. The Company aims to

achieve this goal by redirecting waste from landfilling to reuse
and recycling wherever possible as well as by reducing Cadeler’s
overall consumption.

Health and Safety (S1)
Potential negative impact:
Cadeler's vessels are industrial sites that are often located
offshore. The offshore industry in general, due to harsh oceanic
and weather conditions, the nature of the work and isolation from
shore, poses an elevated risk to the health and safety of workers.
Cadeler’s safety management system is in the core of everything
it does, ensuring continuous improvement of health and safety
risks at the Company’s worksites aiming at reducing risk as much

as possible.
Risk:
Since the offshore industry can have a negative impact to the
health and safety of workers, Cadeler considers that HSEQ
incidents may happen and they have potential to result in brand
issues or lawsuits.
Measures against violence and
harassment in the workplace
Risk:

Although not likely, Cadeler views any risk of harassment or
discrimination as a serious risk for its brand and the trust the
employees place in the business. Risk of incidents is not
widespread, but would impact individuals significantly. To
reduce the risk of incidents, Cadeler has policies in place that
make its position known and ensure that employees know that it
has no tolerance for harassment and discrimination and will do
everything in its power to protect employees against such
incidents.
Other work related rights: Privacy (S1)
Potential negative impact:
Cadeler collects certain key information on its employees as part
of required employment processes. As this is necessary, Cadeler
works to ensure that data storage and data management are
responsible and secure, aiming to reduce the risk of data leaks
and exposure to cybercrime to the lowest extent possible.
Equal treatment and opportunities
for all: Diversity (S1)
Actual positive impact/Potential negative impact:
Cadeler is an equal opportunity employer and has seen the
benefit of its position, as it is able to attract a diverse workforce.
The Company believes this is fundamental to offering a
workplace where employees can thrive and find a sense of
belonging. The Company believes its performance in this area
affects the entire workforce, although potential for negative
impacts would be felt most strongly by affected individuals.
Equal treatment and opportunities
for all: Gender equality (S1)
Potential negative impact/potential positive impact:
Equal opportunity and equal pay impact on the professional and
personal development of employees. Cadeler aims to improve
its performance in this area to make sure this topic, which has
the potential to have negative impacts, has a positive impact on
Cadeler’s workforce.
65


Work-life balance (S1)
Actual positive impact:
Cadeler views its offering of flexible working hours, number of
vacation days, equal opportunities for parental leave regardless
of gender, etc. as core to ensuring employee satisfaction.

Social dialogue (S1)
Actual positive impact:
Cadeler has established many lines for its employees to voice

their concerns and feedback on how it operates its business.
Safety representatives are elected from among the workforce on
O-class vessels. Safety coaches onboard S- and Z-class are
appointed by the Company. Quarterly meetings are set up with
the COO and Head of HSEQ for seafarers to have a platform to
share their voice. Cadeler has established Speak Up! and well-
being hotlines to further support employees.

Freedom of association, the existence
of works councils and the
information, consultation and

participation rights of workers (S1)
Actual positive impact
Cadeler views freedom of association as a right for its employees
but does not track what percentage of its employees make use
of this right. Additionally, via the supply chain Code of Conduct,
the Company requires that its suppliers respect the right of their
own workforce to freedom of association.

Collective bargaining, including rate
of workers covered by collective
agreements (S1)
Actual positive impact
Many of the seafarers are hired on collective bargaining
agreements, ensuring Cadeler meets the requirements for
labour conditions and wages set by the maritime authorities it

operates under.
Adequate wages (S2)
Potential negative impact
Cadeler views adequate payment of workers as an important
aspect of a sustainable business. Cadeler recognises the risk that
some companies across any supply chain could potentially not
live up to the expected standard. For this reason, supply chain

due diligence and management is an important part of Cadeler’s
growing business and is an area the Company works to mature
year after year. This potential negative impact is considered
systemic.
Health and safety (S2)
Potential negative impact
Cadeler sees the potential for safety incidents or injuries across
the value chain. It is therefore viewed as an important part of
Cadeler’s supplier onboarding process to check how the
business partners manage safety. This potential negative impact
is considered systemic.
Training and skills development
Risk:
Access to appropriate training has an impact on the career
development of affected individuals. Ensuring access to training
is viewed as a risk for Cadeler, as the quality of products and
services is dependent on employee access to sufficient training.
Measures against violence and
harassment (S2)
Potential negative impact
Systemic negative impacts on individuals potentially affected
related to harassment cases. Cadeler aims to work with suppliers
who have policies in place that align with its supply chain
requirements.
Diversity (S2)
Potential negative impact
There is a potential risk of systemic unequal pay for equal work
and unequal access to career development opportunities across
the supply chain, based on diversity characteristics other than
gender.
66


Potential incidents of forced labour in
supply chain (S2)
Potential negative impact
While unlikely, any potential incident is expected to have grave
impacts on the affected individual. The Company aims to reduce
the systemic potential impact/risk of any impacts via due
diligence of suppliers, performance of human rights impact
assessments, and appropriate reporting mechanisms.
Risk:

Negative incidents in supply chain could negatively affect Cadeler’s
brand and have negative impact on delivery of products and
services to Cadeler.

Protection of personal data (S2)
Potential negative impact:
Potential for personal data leaks, including data of people in the

value chain, has the potential to negatively affect individuals and
has potential to affect Cadeler via EU GDPR. Cadeler aims to
ensure that personal data is only collected when necessary and
erased when no longer needed. Additionally, Cadeler maintains
its IT systems to ensure a high level of security. This potential
negative impact/risk is considered widespread.
Risk:
Potential for improper management of personal data by Cadeler
could result in fines. Insecure whistleblower hotline may affect the
Company image.

Potential for instance of child labour
in supply chain (S2)
Potential negative impact
Although unlikely, any incident in the supply chain or even
extended supply chain has the potential to greatly impact the
affected young individuals. This potential negative impact is
considered systemic.

Gender equality and equal work of
equal value (S2)
Risk
There is a risk for systemic unequal pay for equal work, and
unequal access to career development opportunities across
supply chain.
Incidents of corruption and bribery (S2)

Risk:
Although Cadeler has systems in place for training employees in
proper conduct, an incident would have the potential to
negatively impact Cadeler's image. Cadeler continues to work on
educating its employees about proper business conduct and
maintaining a culture where there is no tolerance of incidents of
bribery or corruption.
Corporate culture (G1)
Potential positive impact
One of Cadeler goals is to facilitate the transition to a world built
on renewable energy, aiming to set a more sustainable course
for people and planet. Cadeler aims to support this goal with
corporate policies and culture aligned with the corporate values.
Management of relationships with
suppliers including payment practices
Risk:
Cadeler’s relationship to its suppliers has both short-term and
long-term influence on the success of its activities, as the
Company relies on mutually beneficial partnerships with the
suppliers of the products and supporting services necessary for
delivering its operations. Cadeler aims to offer fair contracts and
meet its payment terms.
Prevention and detection, including
training on corruption & bribery (G1)
Actual positive impact
Training provided to employees on corruption, bribery and
other business conduct issues has the potential to positively
influence behaviour. Such training is vital for ensuring that
employees understand how to operate ethically across all
functions, locations and activities.
67
Environment
68
Tackling Climate Change
Tackling Climate Change
_______________________________
E1-1 – Transition plan
As the offshore wind industry sharpens its focus on lifecycle GHG
emissions, demand for lower-carbon solutions across the value chain
is accelerating. Cadeler is committed to meeting this shift with
innovative strategies and sustainable practices. Cadeler has a
decarbonisation plan in place, but this plan does not fully meet the
definition of a “transition plan” as per all required characteristics set
out in the EU CSRD regulation. The current decarbonisation plan
covers the full business. SBTi has published sector-specific guidance
for the shipping industry indicating that a carbon intensity reduction
between 51% and 61% is required to meet the IPCC 1.5-degree
scenario. Cadeler has set an intensity reduction target of 50% by 2030.
SBTi’s shipping guidance also requires net-zero emissions by 2050 for
alignment with the Paris Agreement. Cadeler’s net-zero target is within
this boundary. Cadeler aims to continue exploring its commitment to
Science Based Targets (SBTi) for future verification. Cadeler is not
excluded from the EU Paris-aligned Benchmarks. As part of the
continued development, the Company is working to further clarify
how the targets align with the Paris-aligned 1.5-degree pathway.
The Company’s transition plan has been developed by the
Sustainability and Performance team and approved by the Executive
Management and Board of Directors. Cadeler believes that its
transition plan needs to be embedded it the overall Company
strategy. Hence, concrete yearly metrics and actions are set in the
Corporate Objectives, which are prepared and approved by the
Senior Leadership Team. Additionally, the Executive Senior
Management and the Board of Directors review the budget for
executing the decarbonisation roadmap on an annual basis. This
budget is specifically allocated to vessel retrofits, alternative fuels,
training of crews or industry collaboration, amongst other priorities.
Emissions for Scope 1 and Scope 2 activities have been tracked and
reported annually since Cadeler’s IPO in 2020. In 2024, Cadeler also
started presenting its full Scope 3 emissions, capturing the upstream
and downstream impacts related to its operations. In consequence,
Cadeler also set its Scope 3 ambitions with a 35% emissions
reduction target by 2030. To report on emissions, Cadeler uses the
GHG Protocol Corporate Standard as a guide and, in 2025, also
started acquiring annual verification of its GHG reporting in
accordance with the ISO 14064 standard. Cadeler obtained its first
verification in accordance with the ISO 14064 for 2024 GHG
emissions report. Since the Company uses the definition of
operational control to set its organisational boundary, Cadeler aims
to account for emissions from all facilities and assets where it has
authority to introduce and implement operating policies as Scope 1
emissions. Cadeler updates its list of potential emission sources on
an annual basis. This process is managed by the Sustainability and
Performance team, which is also responsible for developing methods
to measure emissions from any newly identified emission sources,
ensuring that such sources within the organisational boundary are
included in the emissions accounting process.
As part of Cadeler’s ongoing efforts to enhance climate‑related
financial transparency, the Company is working to integrate
analytical accounting capabilities that will allow the organisation to
systematically identify, track, and report climate‑related OpEx and
CapEx.
Sustainability & Performance department role
___________________________________________________________
Cadeler has a Sustainability and Performance department that is
responsible for the implementation of its transition plan. The Chief
Sustainability and Performance Officer, leads this department, sits on
the Executive Senior Leadership team, and has responsibility for both
the design and execution of the strategy and roadmaps for
decarbonisation initiatives. This strategic decision was a consequence
of the Company’s recognition of both importance and the
complexity of addressing the challenges within these areas.
Strategy for decarbonising Cadeler’s operations
_____________________________________________________________
Cadeler continues to focus on reducing its emissions through three
key levers:
1) optimising energy consumption
2) enabling direct electrification, and
3) adopting sustainable fuels.
1) Optimising Energy Consumption
Cadeler’s existing vessels operate on a baseline system that relies on
marine gas oil for power generation. While full decarbonisation will
require significant investment in optimising energy consumption,
direct electrification, and/or the adoption of alternative fuels, Cadeler
considers that further decarbonisation is technically feasible.
Accordingly, Cadeler does not consider its vessel-related emissions
to be locked in.
69
Tackling Climate Change
Continued from previous page
Unlocking the potential for optimised energy consumption across
the fleet remains a top priority for Cadeler in the short and long
term. This involves the continuous assessment and implementation
of both operational and technological energy-efficient solutions for
existing assets to further reduce carbon intensity. The new builds are
delivered with many technical energy efficiencies in the vessel
design. Understanding energy consumption onboard the vessels is a
critical focus area for improving efficiency. In 2024, Cadeler rolled
out energy efficiency monitoring dashboards, providing increased
awareness and data to drive actionable improvements. To maximise
the potential of the vessel efficiencies and support a continued focus
on optimising operations, specific energy-efficiency training for
crews was initiated in 2024 and expanded in 2025, first on the O-
Class, and planned for fleet-wide implementation in the coming
years. Additionally, Cadeler has placed a strong emphasis on
delivering newbuild assets with significantly higher levels of efficiency
by design. Together, these initiatives form the foundation of
Cadeler’s transition to a future lower-carbon fleet.
2) Enabling direct electrification
Due to the nature of Cadeler’s cycle-based operations, electrifying
the vessels through shore-power connections while loading and
unloading at port will be an essential driver of emission reductions.
In 2025, this solution is already enabling both onboard the O-class
vessels and the newbuilds and is estimated to result in up to an 15%
reduction in annual emissions when onshore infrastructure becomes
available. Benefiting from renewable power sources while at berth,
however, requires the port and grid infrastructure to be developed
before the vessel systems can be used. Cadeler has a continuous
focus on working closely together with its major service ports and
customers to overcome the onshore infrastructure barriers.
3) Adopting sustainable fuels
The transition towards the use of alternative fuels in Cadeler’s vessels
will be essential for the Company’s decarbonisation journey.
Sustainable fuels are a necessary part of the pathway towards its net-
zero commitments, and have potential to provide up to 95% GHG
emission reductions. In 2024, Cadeler prepared its operations,
vessels and crews to start blending certified biofuels and renewable
diesel in the current O-class vessels, as these provide a readily
available solution for reducing emissions related to engine
combustion, replacing fossil fuels. This feasibility was successfully
demonstrated by biofuel testing completed on Wind Osprey in early
2025 and has been followed up with biofuel blending on Wind Orca
in December 2025. Additionally, a major focus of Cadeler is on
building a fleet of vessels capable of operating on alternative fuels of
the future. With the ordering of seven newbuilds, work has
continued throughout 2025 to prepare these vessels and ensure they
are ready for future conversion. In 2023, green methanol was
identified as the optimal and earliest available option following
increased demand for this fuel within the shipping sector, which has
encouraged the entire supply infrastructure to be developed in the
coming years. In 2024, Cadeler signed the first Letter of Intent (LOI)
for the future provision of green methanol and will continue
assessing alternative fuel available in the market going forward.
Decarbonisation Model to meet Cadeler’s 2030 and 2035
climate targets (see next page for graphic)
_______________________________________________________________________
Cadeler views the reduction of emissions at source as a more
effective and responsible strategy than reliance on carbon offsetting
to achieve reductions in its carbon footprint. As the fleet has grown
significantly, the absolute Company emissions are expected to
increase with the growth of the fleet, but Cadeler aims to reduce
emissions intensity of its operations and reduce average emissions of
the vessels in its fleet. The Company does not envision a linear
decrease in emissions but rather considers decarbonisation to be a
transition process involving continuous improvements and upgrades
until 2035 and beyond, based on technical readiness of key
decarbonisation technologies and the Company’s growth
projections.
70
Tackling Climate Change
Cadeler Decarbonization Pathway
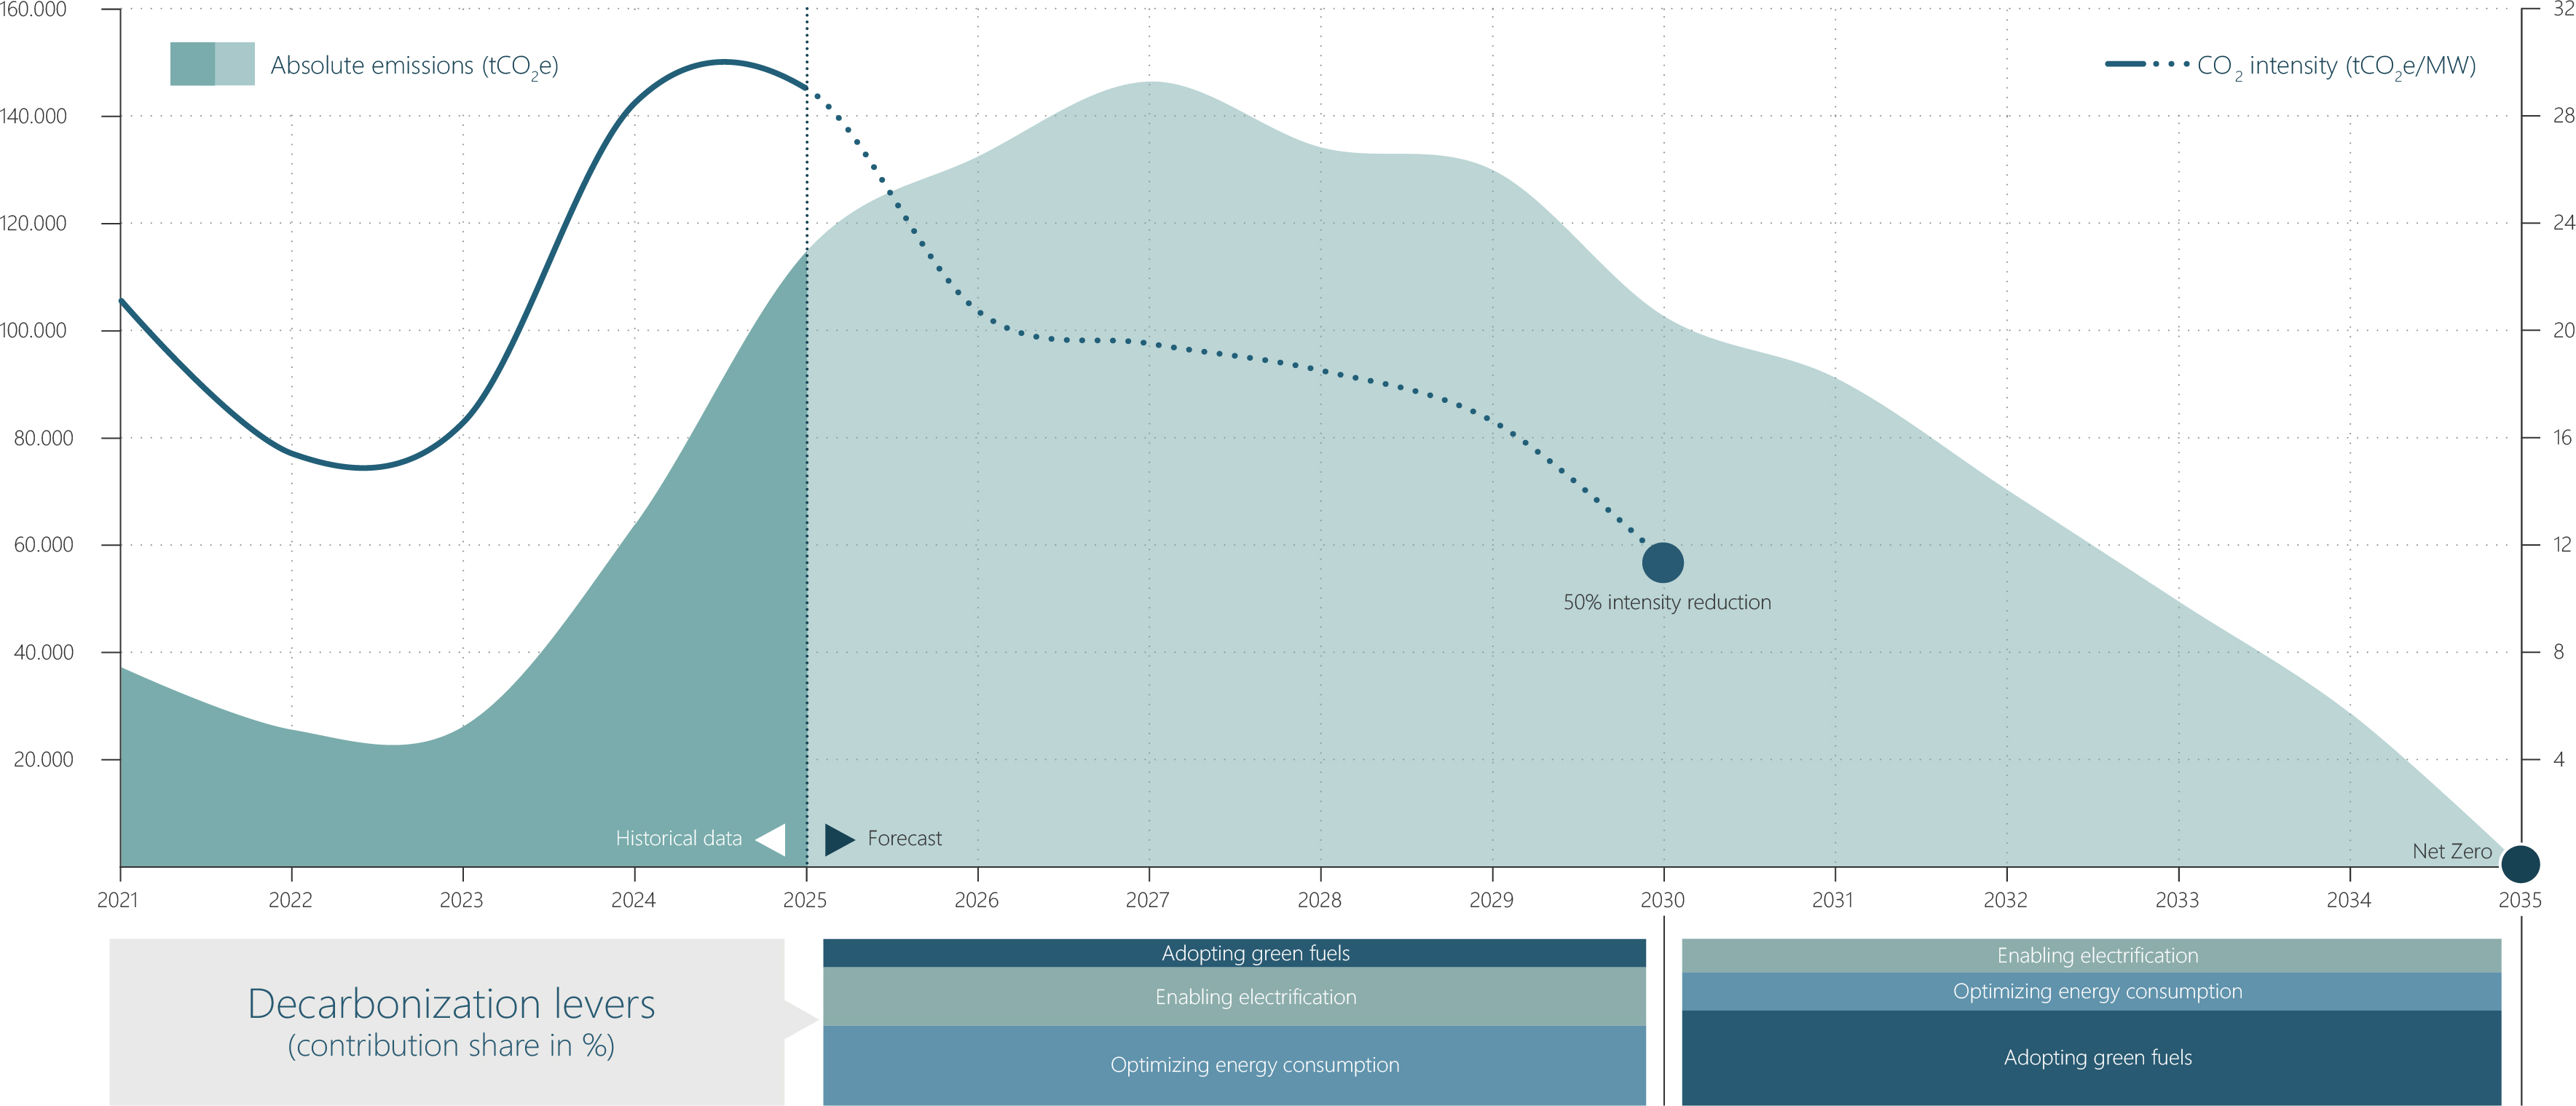
71
Tackling Climate Change
Continued from previous page
ESRS 2 SBM-3 – Material impacts, risks and opportunities and their
interaction with strategy and business model(s)
Cadeler’s operations are largely focused on marine transportation
and installation activities. While the Company’s main assets are
vessels, and therefore not stationary, they are exposed to harsh
offshore weather conditions which require appropriate safety
precautions and engineering measures.
Cadeler sees some potential for varying levels of weather-related
operational downtime with respect to its own operations as a slight
risk due to changing wind and precipitation patterns. The Company
also recognises some elevated risks within its supply chain where
fixed assets and providers, such as ports and shipyards, are exposed
to climate-related risks, including extreme precipitation events,
flooding, droughts, storms, changing wind patterns and heat waves
which may periodically interrupt operations or in some cases,
damage infrastructure that Cadeler relies on for its vessel operations
or the delivery of core operational equipment and provisions.
Cadeler has considered physical climate hazards as defined by the EU
Taxonomy requirements as part of a climate risk assessment. For the
assessment, Cadeler considered its own vessel operations, including
all known future wind farm locations at the time of the assessment, all
known ports that would be used to complete these projects, and
potential impacts on core suppliers such as shipyards and a shortlist
of critical equipment providers. Cadeler first performed a climate risk
assessment in December 2023 and has now performed a second
iteration of this assessment. Cadeler used a third party Climate Risk
Tool to assess physical risks that may be faced by Cadeler and its
supply chain. Using the information produced by this tool, Cadeler
finalised its second internal assessment of its exposure to the
identified risks in early 2026. The platform assessed the 28 climate-
related hazards defined by the EU Taxonomy. The second resilience
analysis was finalised in early 2026, and the resulting report was
shared with relevant stakeholders within the Company. The first step
in the process was to assess exposure to risks arising from Cadeler’s
operations and supply chain setup. To achieve this, Cadeler mapped
its operations and supply chain to identify potential climate-related
hazards. These hazards were then analysed using the Climate Risk
Tool to evaluate risk exposure at Cadeler’s main offices, installation
sites, ports and key supplier locations. Criticality of locations was
adjusted based on financial importance to the Company.
Cadeler focused on impacts through two time horizons (2030 and
2050) under the RCP 8.5 scenario. This scenario was selected for the
initial climate risk assessment to identify all potential impacts on the
Company because the 8.5 model provides the most visible
representation of risks. This approach enabled Cadeler to determine
whether climate impacts could pose a material risk to its business. In
future iterations, Cadeler plans to adopt a more nuanced approach,
incorporating multiple RCP scenarios to further examine the
likelihood and severity of the identified risks. In 2025, Cadeler
continues to see a relatively low level of vulnerability within its own
operations due to climate-related impacts. The primary risk is likely
to be changing weather conditions affecting the weather downtime
of the vessels. Cadeler did identify medium and high levels of
vulnerability in some parts of its supply chain; for example, at ports
due to potential flooding and high wind incidents which could result
in extended periods of inaccessibility due to possible infrastructure
damage. Additionally, elevated risk for impacts when it comes to on-
time delivery of vessels and larger items of equipment were
identified, as some manufacturing facilities are located in riverine
and coastal areas in typhoon-impacted regions. As a result, an
elevated potential for damage to supplier facilities due to high
winds, changing precipitation and flooding was seen in the climate
risk model. As of 31 December 2025, only 2 ordered newbuilds
remain undelivered.
Cadeler’s vessels can be redeployed if damaging climatic
conditions are forecasted. For this reason, Cadeler views its own
operations as having a relatively low vulnerability to asset
damage. However, there is a vulnerability to increased
operational downtime due to changing weather conditions.
Cadeler aims to ensure that its contractual agreements are
designed to minimise exposure to potential changes in climatic
conditions. Parts of the supply chain, with factories and
production sites in fixed locations, may have higher exposure to
the risk of damaged facilities due to climate change. One
solution to mitigate this vulnerability may be to ensure sufficient
contingency time when ordering key equipment from areas with
elevated climate risk and maintain a stock of critical spare parts.
Additionally, Cadeler should consider exposure of storage
locations for critical parts to extreme wind and flooding risks.
72
Tackling Climate Change
Continued from previous page
Management of climate-change mitigation IROs
_____________________________________________________________
ESRS 2 IRO-1 – Description of the process to identify and assess
material climate-related impacts, risks and opportunities
Cadeler has screened its assets and business activities for
exposure to physical and transition events using several methods:
•Updating its environmental risk and impact assessment,
•Performing a climate risk assessment,
•Performing a DMA for the production of a CSRD-
compliant report,
•Implementing processes in place for keeping up with
changing regulatory and stakeholder requirements.
These processes include the use of vessel management
systems for compliance with relevant regulations, the
use of external advice, and an internal working group
that focuses on keeping abreast of new regulations.
As part of its environmental management system, Cadeler
requires an environmental risk and impact assessment to be
carried out on an annual basis. The scope of the assessment is
limited to Cadeler’s installation and maintenance operations, but
also considers value chain impacts directly linked to these phases.
Cadeler conducted the environmental risk and impact
assessments for its wind turbine installation and foundation
installation operations in March 2025. The intention is to perform
such an assessment at least annually, with the result from the
previous year used as the starting point. Additional assessments
are also performed any time Cadeler takes on a project with a
new scope of work.
The results of these recurring environmental risk and impact
assessments, feed into the DMA, supporting the identification of
topics for consideration.
Separately, via the climate risk assessment (described under ESRS
2 SBM-3), Cadeler identified various physical risks to its operations
and to its upstream supply chain. These risks are already present
in the short term but may potentially increase in likelihood over
the medium to long term due to climate change. The outcome of
the climate risk assessment was shared with Cadeler’s Senior
Leadership Team, so that the risks identified could be considered
in the Company’s planning. If any climate-related assumptions are
made in the Financial Statements, consistency with Sustainability
Statements will be ensured by Core Finance, managing both
reporting. Cadeler intends to repeat this risk assessment on a
recurring basis.
In 2025, Cadeler’s Sustainability and Performance department
maintains responsibility for identifying and managing climate
risks, as well as informing relevant stakeholders of risks that
require action, while the Core Finance department has overtaken
responsibility for the Sustainability Reporting, ESG internal
controls, ensuring data collection from internal specialists, and
audit of ESG data. This process ensures that segregation of duties
exists.
In the policy arena, Cadeler tracks regulatory changes which may
impact its operations. Cadeler vessels will be incorporated into the
EU ETS starting in 2027 for operations within the EU. This change
will subject the Company to increased costs associated with GHG
emissions. Cadeler is also monitoring potential developments that
could expand GHG pricing, including a potential UK ETS scheme.
Additionally, Cadeler is subject to several regulations aimed at
enhancing corporate reporting on ESG matters. These include the
EU Monitoring, Reporting and Verification (MRV) regulation for
vessel fuel reporting and the EU CSRD, which requires more
comprehensive accounting and verification of ESG performance.
Meeting these additional reporting requirements required
increased resources at Cadeler, both in terms of personnel and
financial investment, so Cadeler increased the headcount
dedicated to these topics during 2025.
There is an increasing interest from the stakeholders related to
Cadeler’s decarbonisation plan and the Company expects this
interest to grow further. Additionally, Cadeler considers that
volatility in the cost of resources, such as steel and fuels,
represents a risk. As a consequence, Cadeler views technology
developments as an important aspect to consider in its business
strategy. The organisation has already recognised the costs
associated with the transition to lower emission technologies in its
business planning and considers that progress on decarbonisation
must be a business priority for continued success.
Cadeler’s general business strategy aims to be compatible with a
climate-neutral economy. Its operations are focused on
supporting the buildout of renewable offshore wind energy.
Cadeler recognises its current dependence on fossil fuels to
operate its installation vessels and acknowledges that significant
decarbonisation efforts are required to fully align vessel
operations with a climate-neutral economy.
73
Tackling Climate Change
Continued from previous page
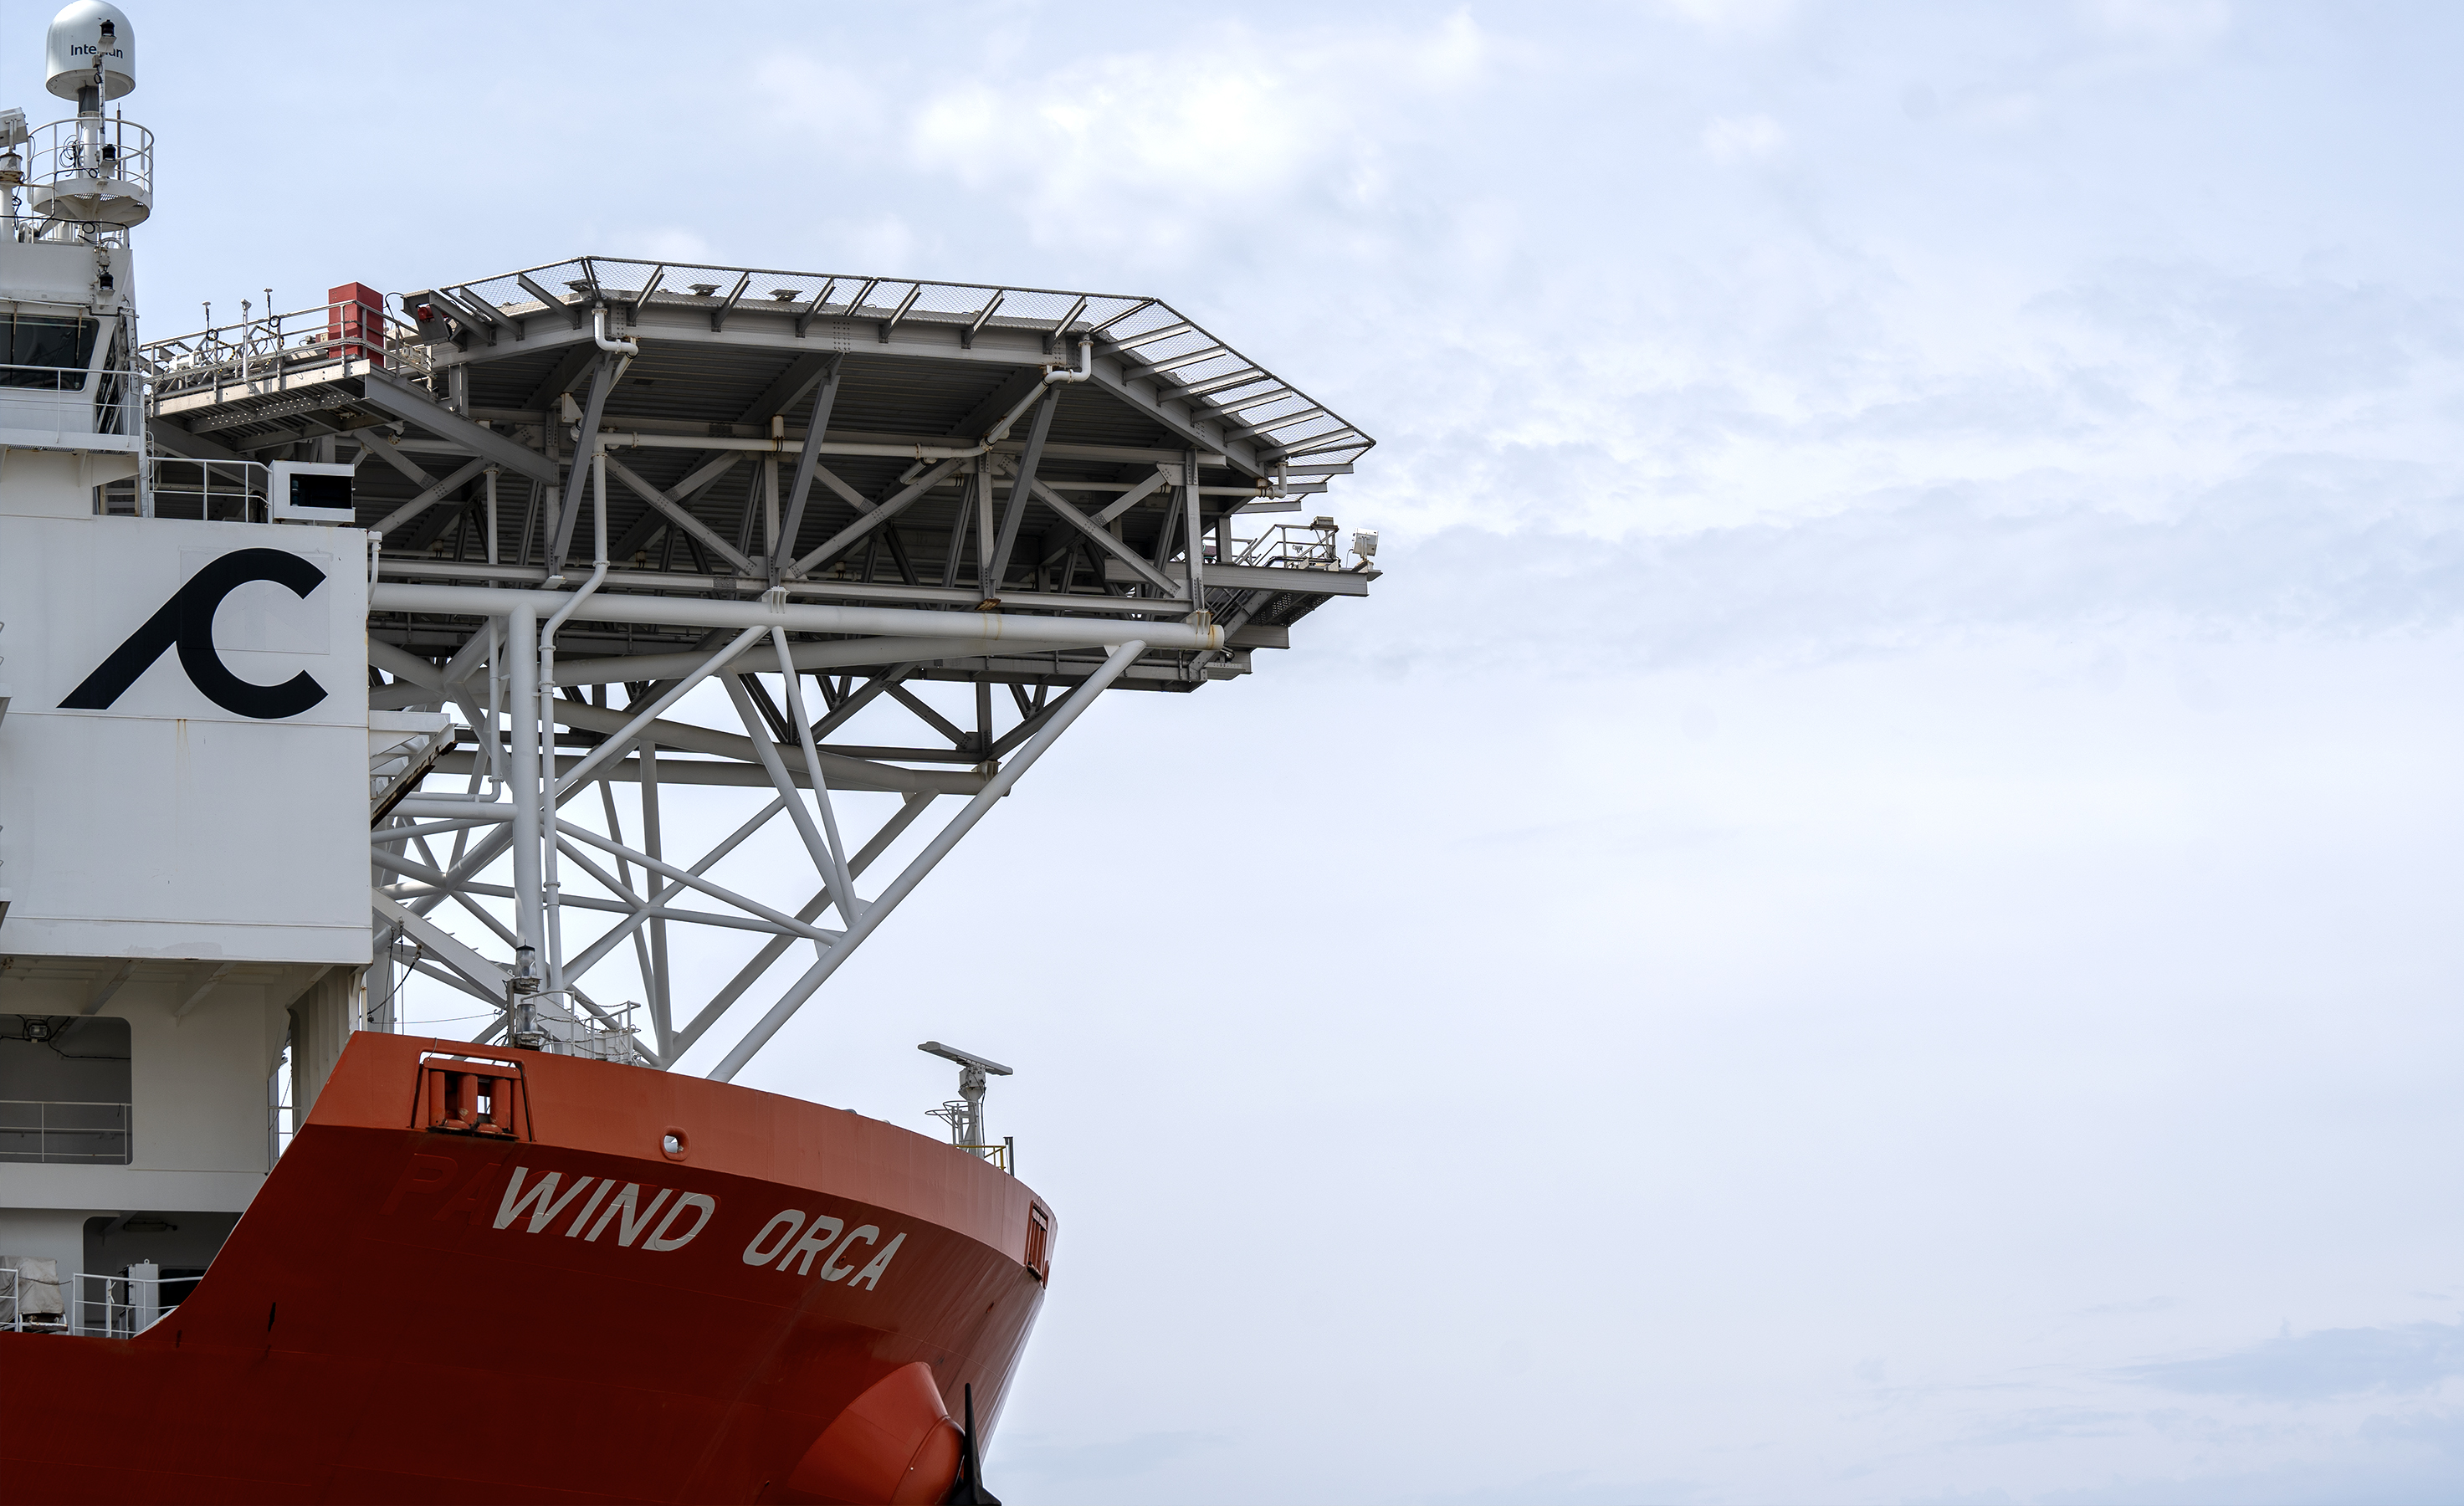
E1-2 – Policies related to climate change mitigation and adaptation
As a key supplier in the offshore wind industry, Cadeler is working
towards a transition to a global sustainable energy system built on
renewable energy. The Company recognises that its operating
methods are just as important as its end goal, and Cadeler
commits to continuously improving its environmental
performance across its operations.
Cadeler has a sustainable development policy in which its
environmental and climate change ambitions are outlined.
Cadeler is publicly committing to 8 of the UN Sustainable
Development Goals (SDGs), aiming to meet the needs of the
present without compromising the needs of the future. For further
information, please refer to Cadeler’s Strategy towards a
Sustainable Future. Moreover, the organisation maintains an
environmental management system in accordance with ISO
14001:2015, with a focus on continuous environmental
improvements. This includes reducing the carbon intensity of its
operations, improving the energy efficiency of the Company’s
assets, minimising the use of resources, and working toward a
circular economy.
The policy regarding climate change applies to all offshore and
onshore employees, as well as other individuals contracted to
work for Cadeler. Cadeler also encourages all business partners
and suppliers to adhere to similar standards. The policy is publicly
available on Cadeler’s website and accessible via the Company’s
intranet for employees. The policy is approved by management
while the Sustainability and Performance department is
responsible for ensuring effective implementation across the
business.
74
Tackling Climate Change
Continued from previous page
E1-3 – Actions and resources in relation to climate change policies
As previously outlined, Cadeler vessels will be incorporated into the
EU ETS starting in 2027 for operations within the EU. This change will
subject the organisation to increased costs associated with GHG
emissions. Additionally, the Company is monitoring potential
developments that may expand GHG pricing mechanisms to other
operations, including the anticipated UK ETS scheme and FuelEU
Maritime. In response, Cadeler is taking steps to continuously
adopting lower-emission solutions across the fleet, allocating CAPEX
and OPEX on an annual basis to support the implementation of its
action plans. An overview of the actions implemented and planned
for each vessel class is presented on this page.
The implementation of the sustainability-related actions depends
partly on the availability and allocation of financial resources. For
instance, access to biofuel at a competitive cost supports the
execution of strategic initiatives.
The Company also relies on green financing instruments, including
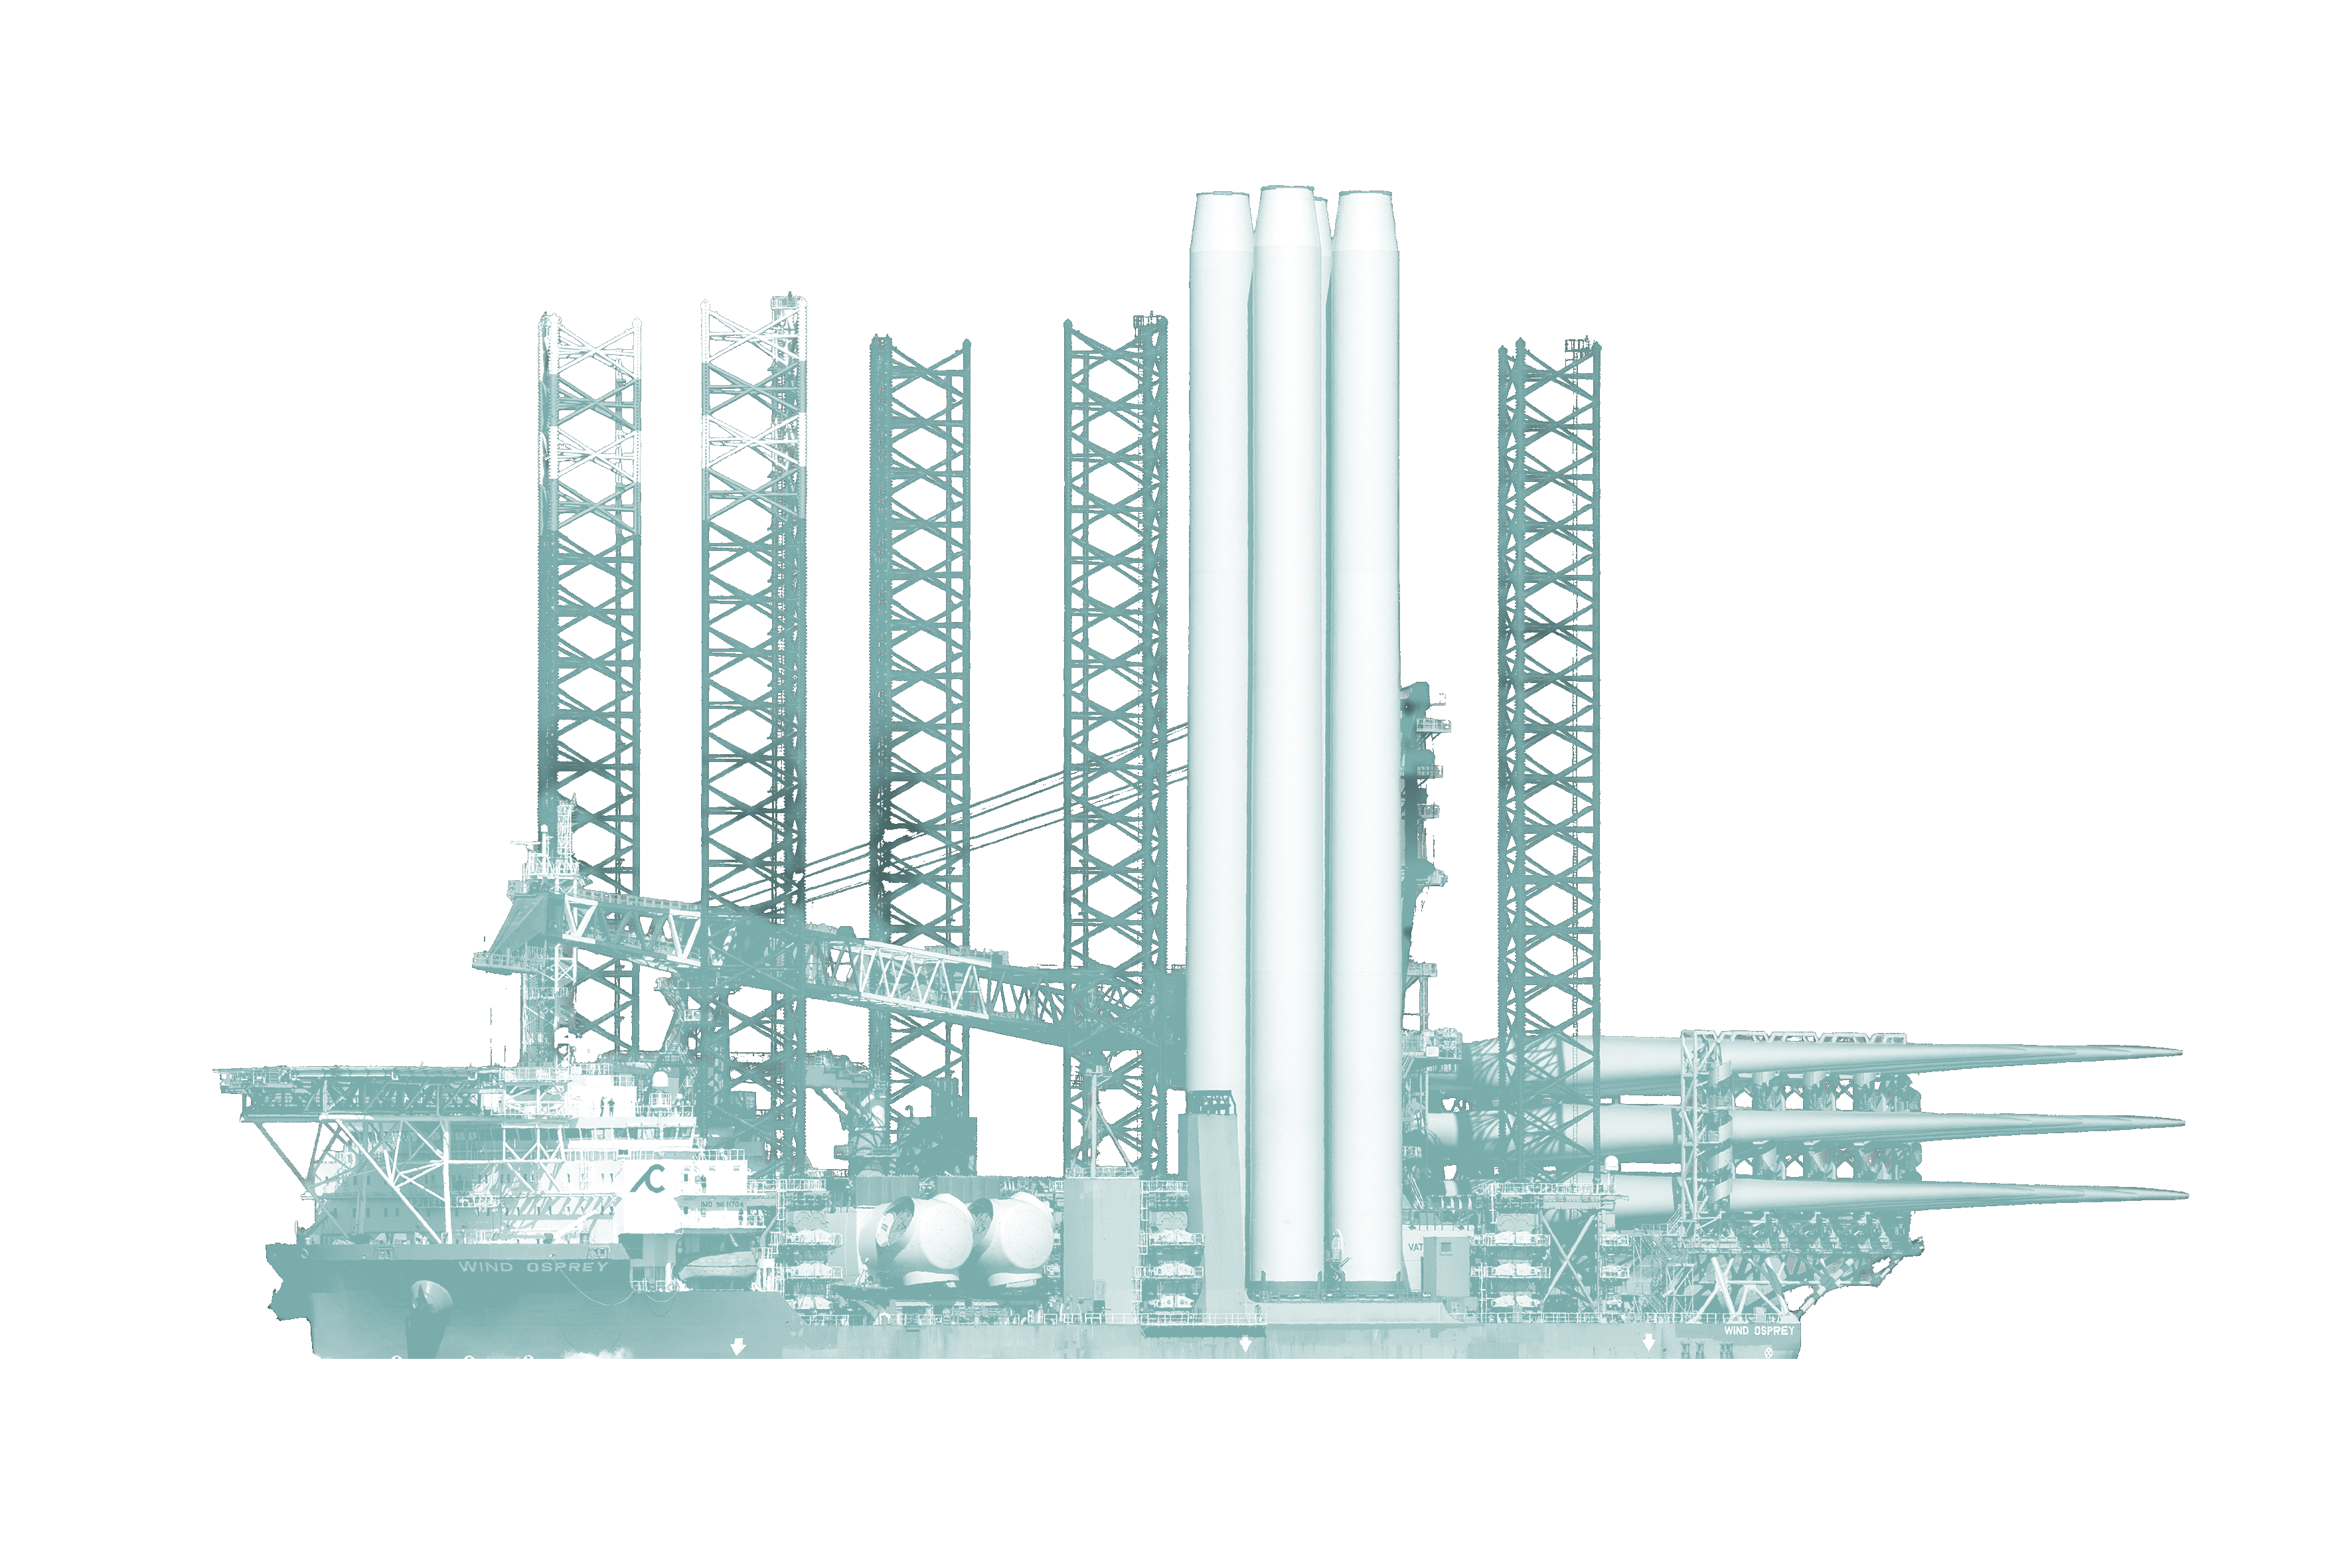
green loans subject to external review and monitoring, which
contribute to funding projects aligned with its sustainability
objectives.
Regarding the amounts of Opex and Capex required for the
implementation of actions, Cadeler is not yet ready to disclose this
information.
O-class vessels, Wind Orca and Wind Osprey
On the O-Class, Cadeler has installed improved fuel monitoring
systems, and has paired this improvement with a crew training
programme aimed at using data to identify operational
improvements that reduce emissions. The installation of the shore
power system on Wind Osprey commenced in early Q1 2025 and
had been commissioned during Q1 2026. In Q1 2025, Cadeler
performed a feasibility test for biofuel on Wind Osprey and later a
second test on Wind Orca Q4 2025. The trials have required
preparation of Cadeler’s operations, vessels and crews to receive
and operate on a certified biofuel blends in the current O-class
vessels. The trials have provided valued learnings towards a readily
available solution for emissions reduction by replacing fossil fuels.
The use of biofuels will be part of the decarbonisation strategy on
across all vessel classes in the Cadeler fleet even if it represents a
higher cost (around 60%). There is planned a purchasing strategy
and order of additional biofuels during 2026.
P-class vessels, Wind Pace and Wind Peak
Wind Peak was delivered in 2024 and Wind Pace was delivered in
2025. Both vessels are more eco-friendly than Wind Orca and Wind
Osprey as a decade of technological developments since the
delivery of the O-class vessels has enabled the implementation of
enhanced energy efficiency and emission reduction technologies
onboard. Improvements to the delivered design include shore
power connections (expected to reduce fuel consumption by up to
15%), fuel-efficient engines and optimised engine sizing. Additional
refinements include an onboard power-saving system, incorporating
battery capacity covering more than 10% of the energy required for
crane operations and approximately 10% of the energy required for
dynamic positioning and maneuvering, regeneration of power from
the jacking system and variable frequency drives. Cadeler intends to
move towards alternative fuels, in addition to biofuels, when suitable
technologies become commercially available. Readiness for
conversion to alternative fuels has been incorporated into the
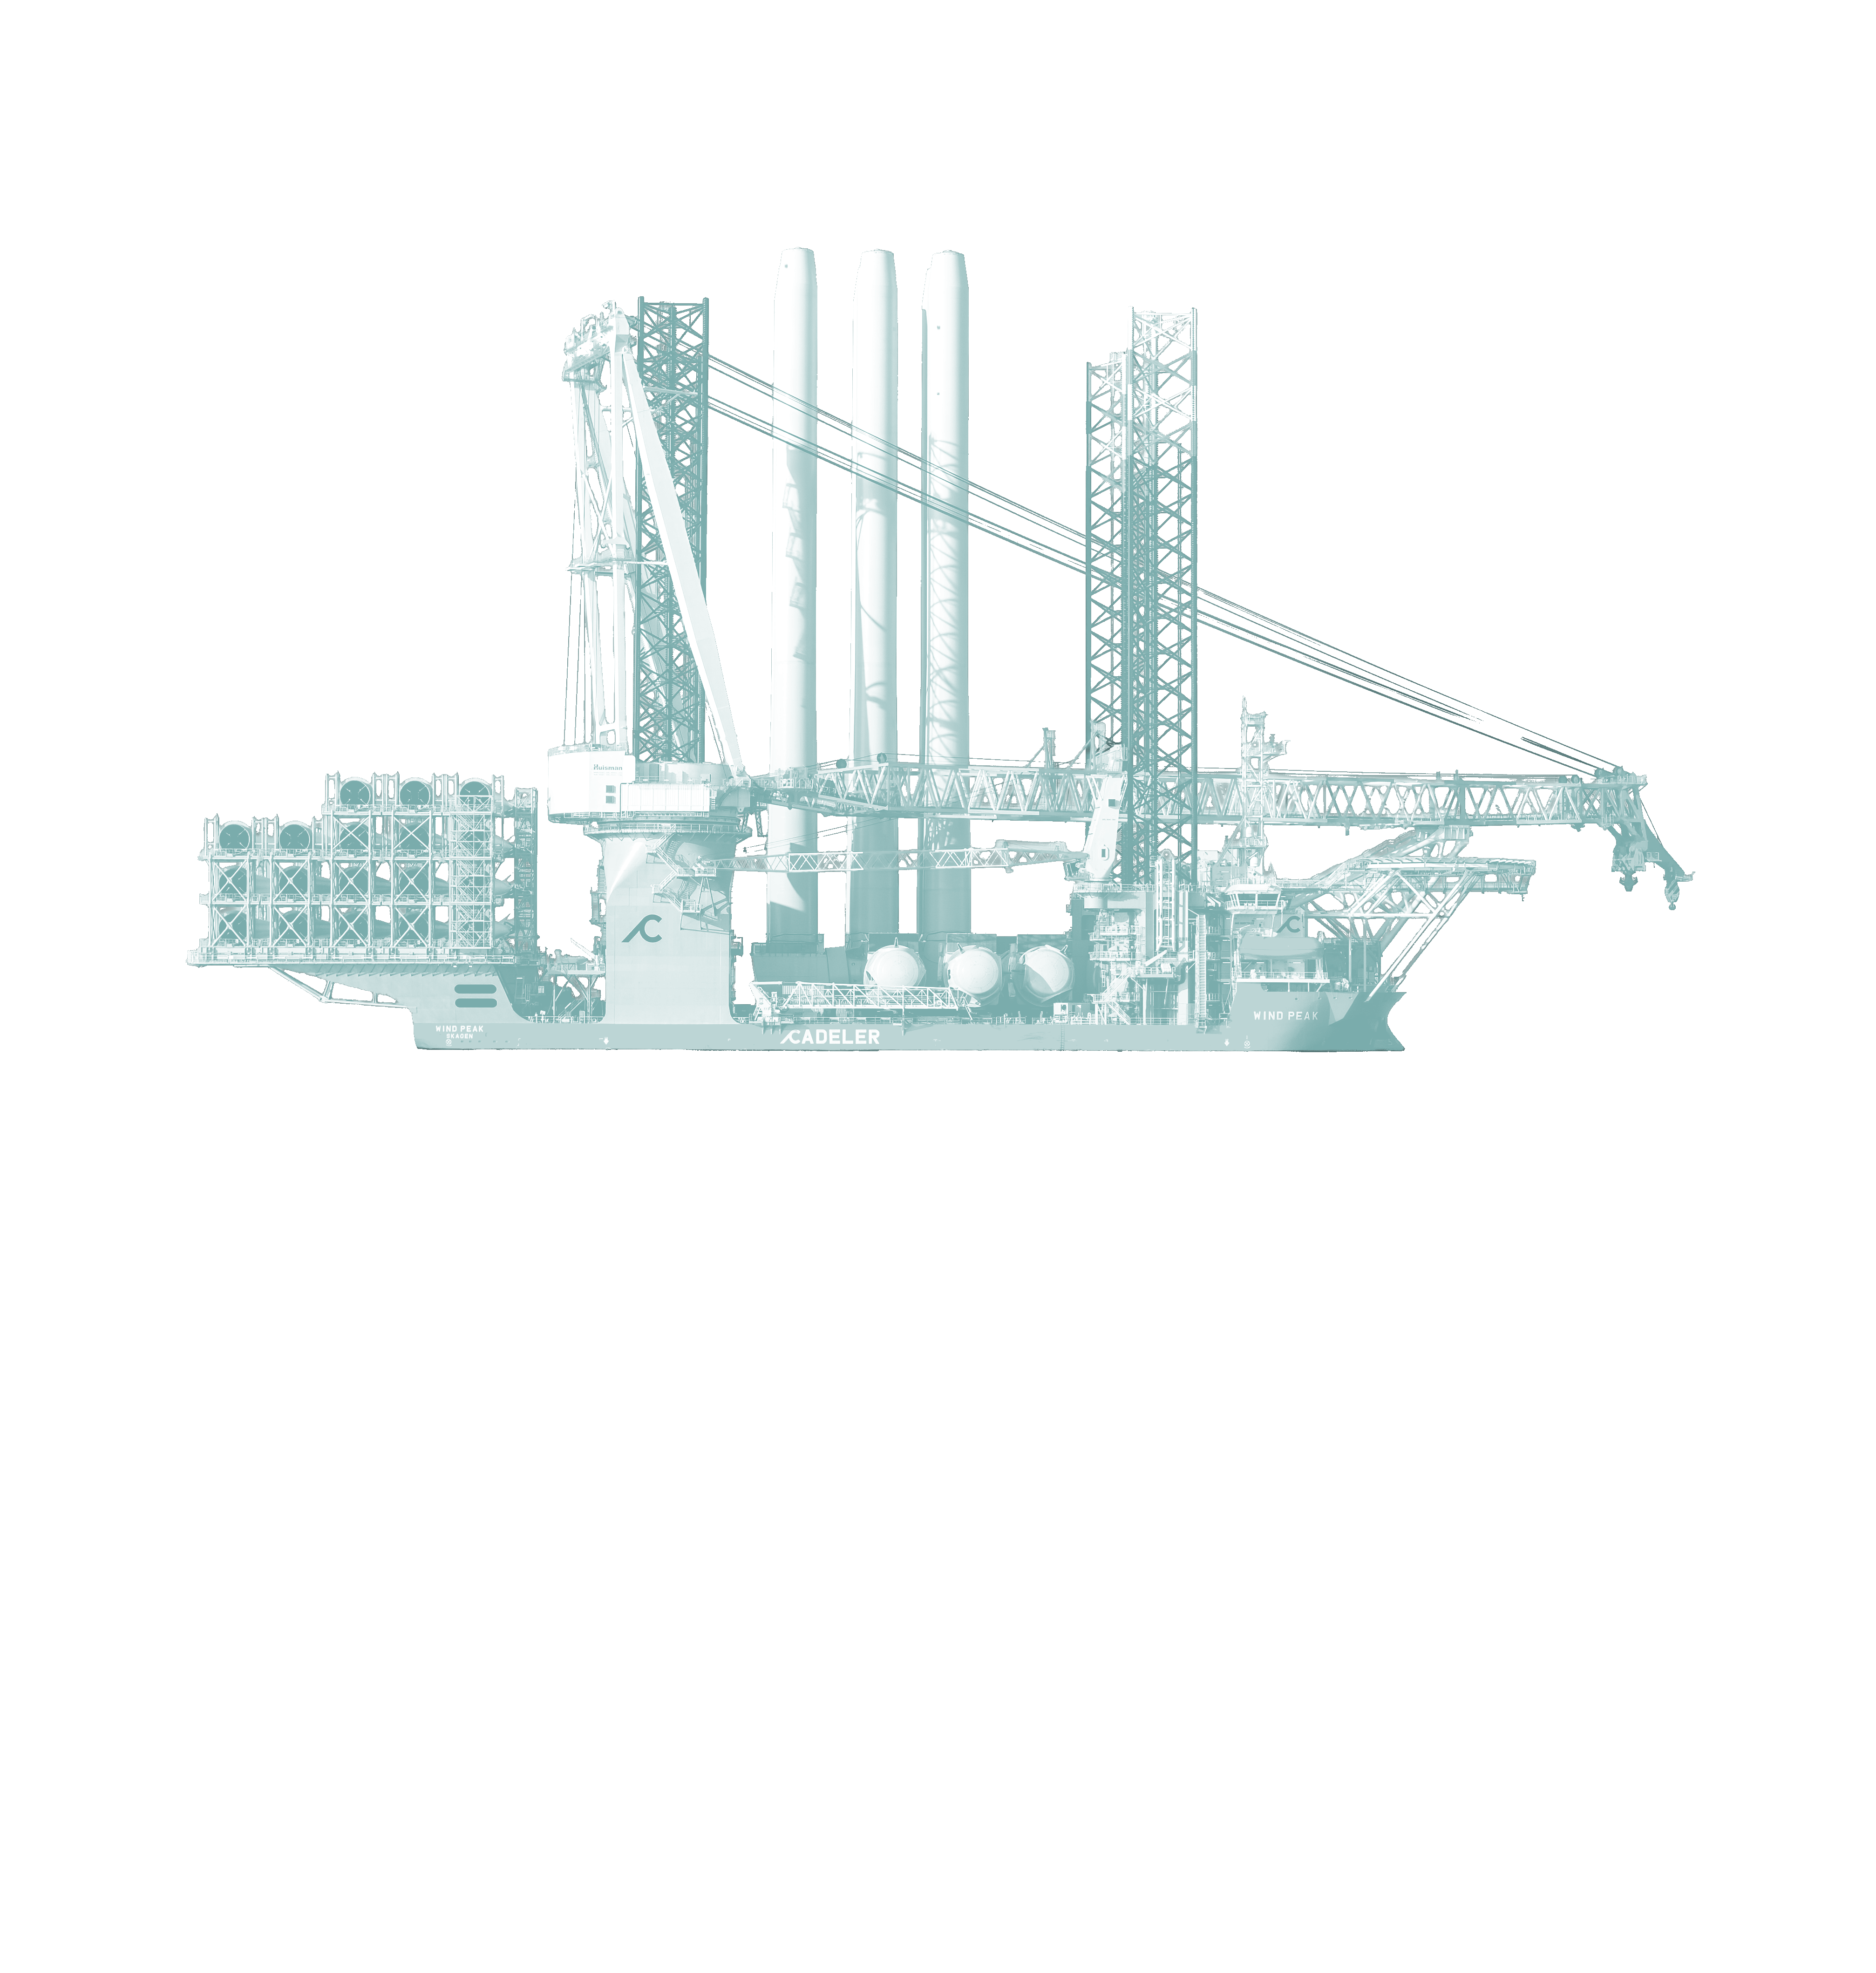
design of the newbuild vessels, including P-class vessels. To support
this readiness, Cadeler has started preparing for future fuel
availability by signing a green methanol uptake Letter of Intent with
HyLion.


75
Tackling Climate Change
Continued from previous page
A-class vessels, Wind Ace, Wind Ally and Wind Apex
In 2025, Cadeler received the first of its jack-up foundation
installation vessels. The A-class are designed with a hybrid purpose,
allowing the vessels to convert from being foundation installation
units to wind turbine installation units within a short period of time.
All A-class vessels will be equipped with the same green design
elements as the P-class upon delivery.
M-Class newbuilds, Wind Maker and Wind Mover
Cadeler took over management of the newbuild processes for the
M-class vessels at the end of 2023, and has taken delivery of both
vessels during 2025. The vessels are equipped with shore power
connections, a closed ring/bus system for improved power
management and improved efficiency, staggered-sized diesel
generators (allowing engines to operate at more optimal load levels
for improved fuel-to-energy efficiency), a battery energy storage
system with regeneration from the jacking system, and the
implementation of LED lighting. Cadeler will continue to evaluate
performance and expects to be able to provide further details on the
estimated improvement in CO2e emission performance of these
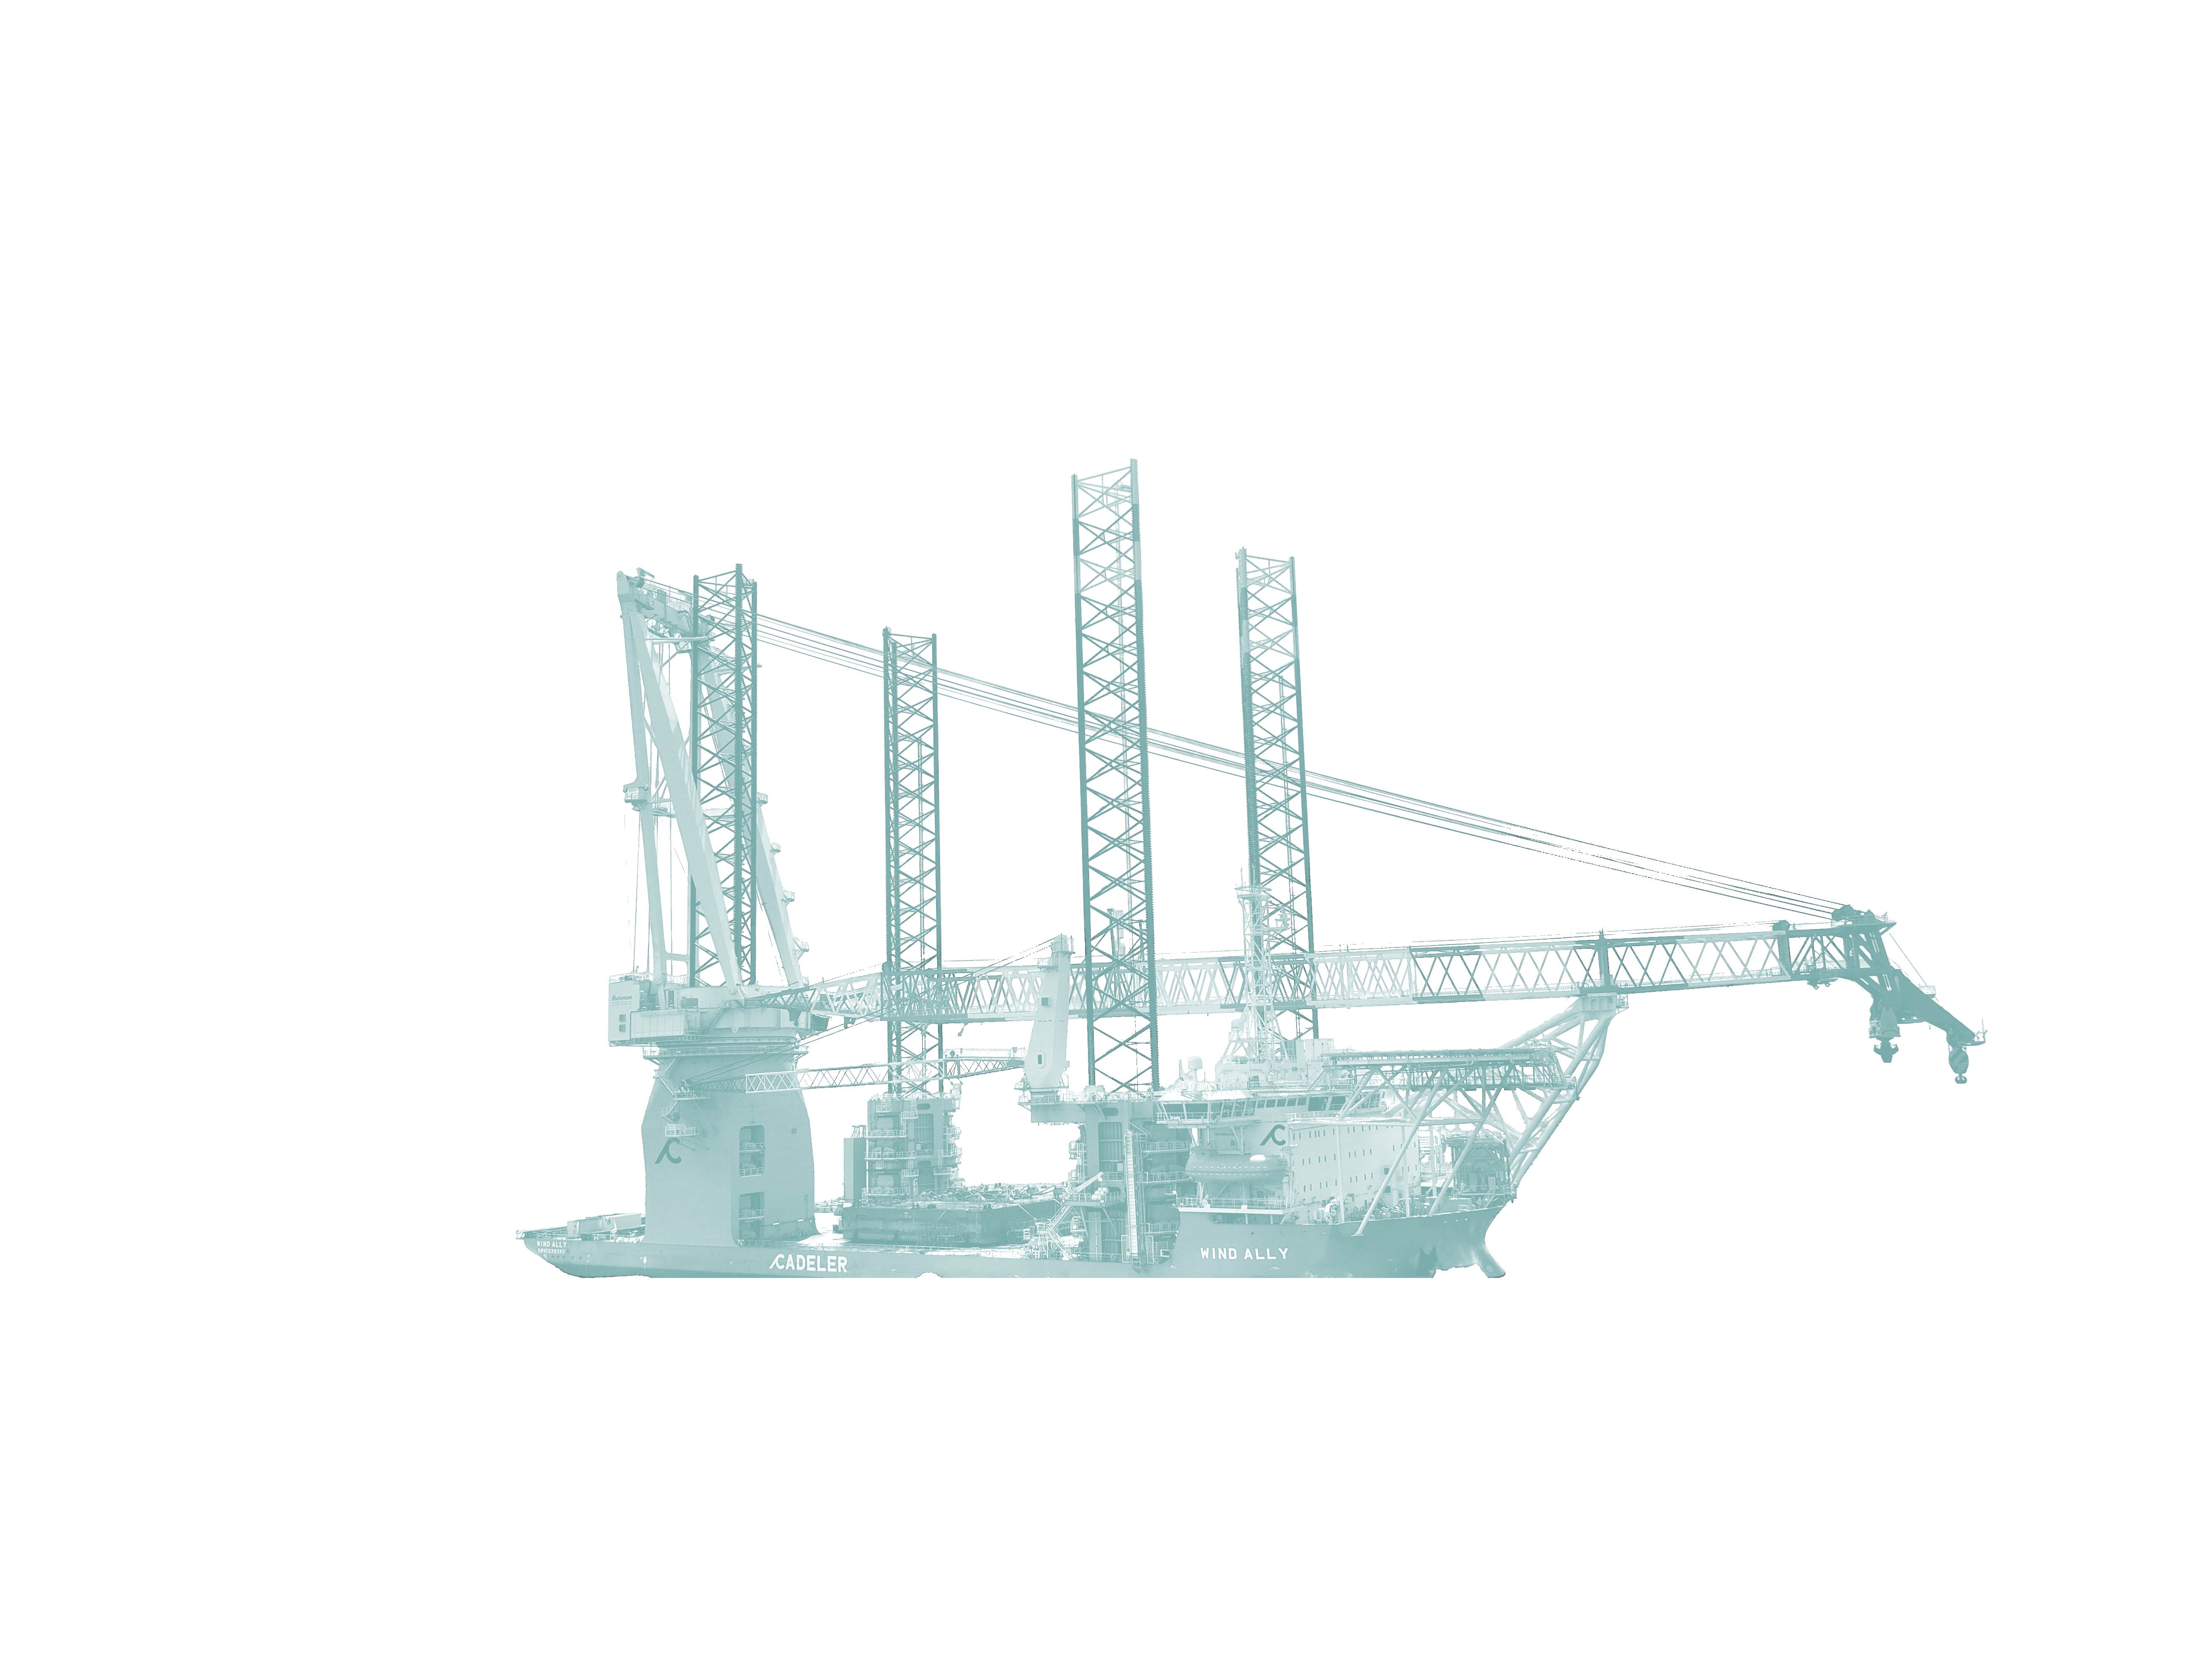
vessels in future reporting.
Wind Scylla and Wind Zaratan
Cadeler took on management of these vessels at the end of 2023,
and in future reporting, will also include disclosures on initiatives
undertaken to reduce CO2e emissions and other environmental
impacts from these vessels. As of 2025, efforts have been focused
on the other vessel classes.
Wind Keeper
After the purchase of Wind Keeper, Cadeler has carried out initial
onboard energy audit to provide recommendations for retrofits that
would offer improvements to the vessel's energy efficiency. Cadeler
has received the first draft of the report and is assessing the various
options that could be built into an actionable improvement plan for
the vessel in the medium term.


76
Tackling Climate Change
Continued from previous page
Emissions reduction Metrics and Targets
___________________________________________________
E1-4 – Targets related to climate change mitigation
In 2021, guided by a commitment to environmental protection,
Cadeler set ambitious climate targets for the shipping industry.
Cadeler manages its climate-related targets via its Sustainability and
Performance Department. Sponsored by Executive Senior Leadership
and with representation on the Senior Leadership Team since
December 2024, this function has responsibility for the strategy and
roadmaps for decarbonisation. Building on this work, Cadeler has set
four key targets related to reducing its carbon footprint.
•Renewable electricity commitment: Cadeler commits to
sourcing 100% of its electricity consumption from
renewable sources by 2030. This target currently covers the
electricity consumption from the offices but is also
intended to cover electricity used to power vessels when
shore power will be utilised in the future (Scope 2
emissions).
•Emissions reduction targets: Cadeler is working to reduce
the carbon intensity of its operations by 50% by 2030,
ensuring that its contribution is in line with the IMO goals.
•Net-zero greenhouse gas emissions target: Cadeler aims to
achieve net-zero emissions from its own operations by
2035. Achieving this goal requires emission reductions
across the fleet, operational innovations, and research into
reliable solutions for sequestering the GHGs that the
Company cannot avoid emitting.
•Scope 3 emissions reduction target: by 2035, reduce Scope
3 emissions by 35%.
As an extension of these key targets, Cadeler has identified
improvements and already started implemented some of them in 2025
to ensure that its targets support the objectives of its transition plan:
•Third-party verification of Scope 1, Scope 2, and Scope 3
emissions reporting. This was performed for the 2024 and
2025 figures in accordance with the ISO 14064 standard.
This process will be repeated annually,
•Verification of the emission targets with the SBTi, and a
clearer quantification of the emission reductions achievable
through specific decarbonisation levers (future reporting),
•Ensuring that Company actions and financial planning to
achieve targets and are time-bound,
•Third-party verification of the KPIs used to track the
progress in 2024 and 2025 throughout CSRD verification,
•Cadeler views every MW of wind power installed or
repaired as a societal contribution.To achieve this, Cadeler
strives to maximise vessels utilisation for projects
supporting the energy transition, reduce emissions from
operations by enhancing the technical systems of existing
and future vessels, improve operational practices, and
ensure that its vessels remain capable of meeting the
evolving requirements of the offshore wind market.
77
Tackling Climate Change
Continued from previous page
According to the ESRS, Cadeler will be required to update the base
year for its GHG emission reduction targets every five years from
2030 onwards.
In line with the Company-wide net-zero goal, Cadeler aims to
reduce Scope 1 CO2e emissions intensity from a 2021 baseline.
Cadeler’s emissions intensity target is to reduce emissions from its
own operations (Scope 1) by 50% before 2030, and to reach net-
zero by 2035, which requires direct emissions to be reduced as
much as possible . Cadeler has not yet implemented the use of
carbon credits, GHG removals, or GHG storage in its decarbonisation
strategy. The Company has also not yet set an internal price on
carbon. Lastly, Cadeler has not evaluated the financial effects from
material physical and transition risks and potential climate-related
opportunities. These topics are therefore not reported this year.
Cadeler has not yet fully assessed the value of these options, but
intends to evaluate whether they may act as effective supporting
mechanisms in reaching its net zero target in the coming years.
Cadeler introduced two metrics to track the emissions intensity of its
operations: emissions per MW installed or serviced, and emissions
per revenue. These metrics, reported annually, include all Scope 1
emissions (direct emissions).
•KPI 1: GHG Emissions per MW installed or serviced (tCO2₂e/
MW): please see “Carbon Footprint” note below.
•KPI 2: GHG emissions per EUR revenue (tCO2₂e/Million
EUR): please see “Carbon Footprint” note below.
78
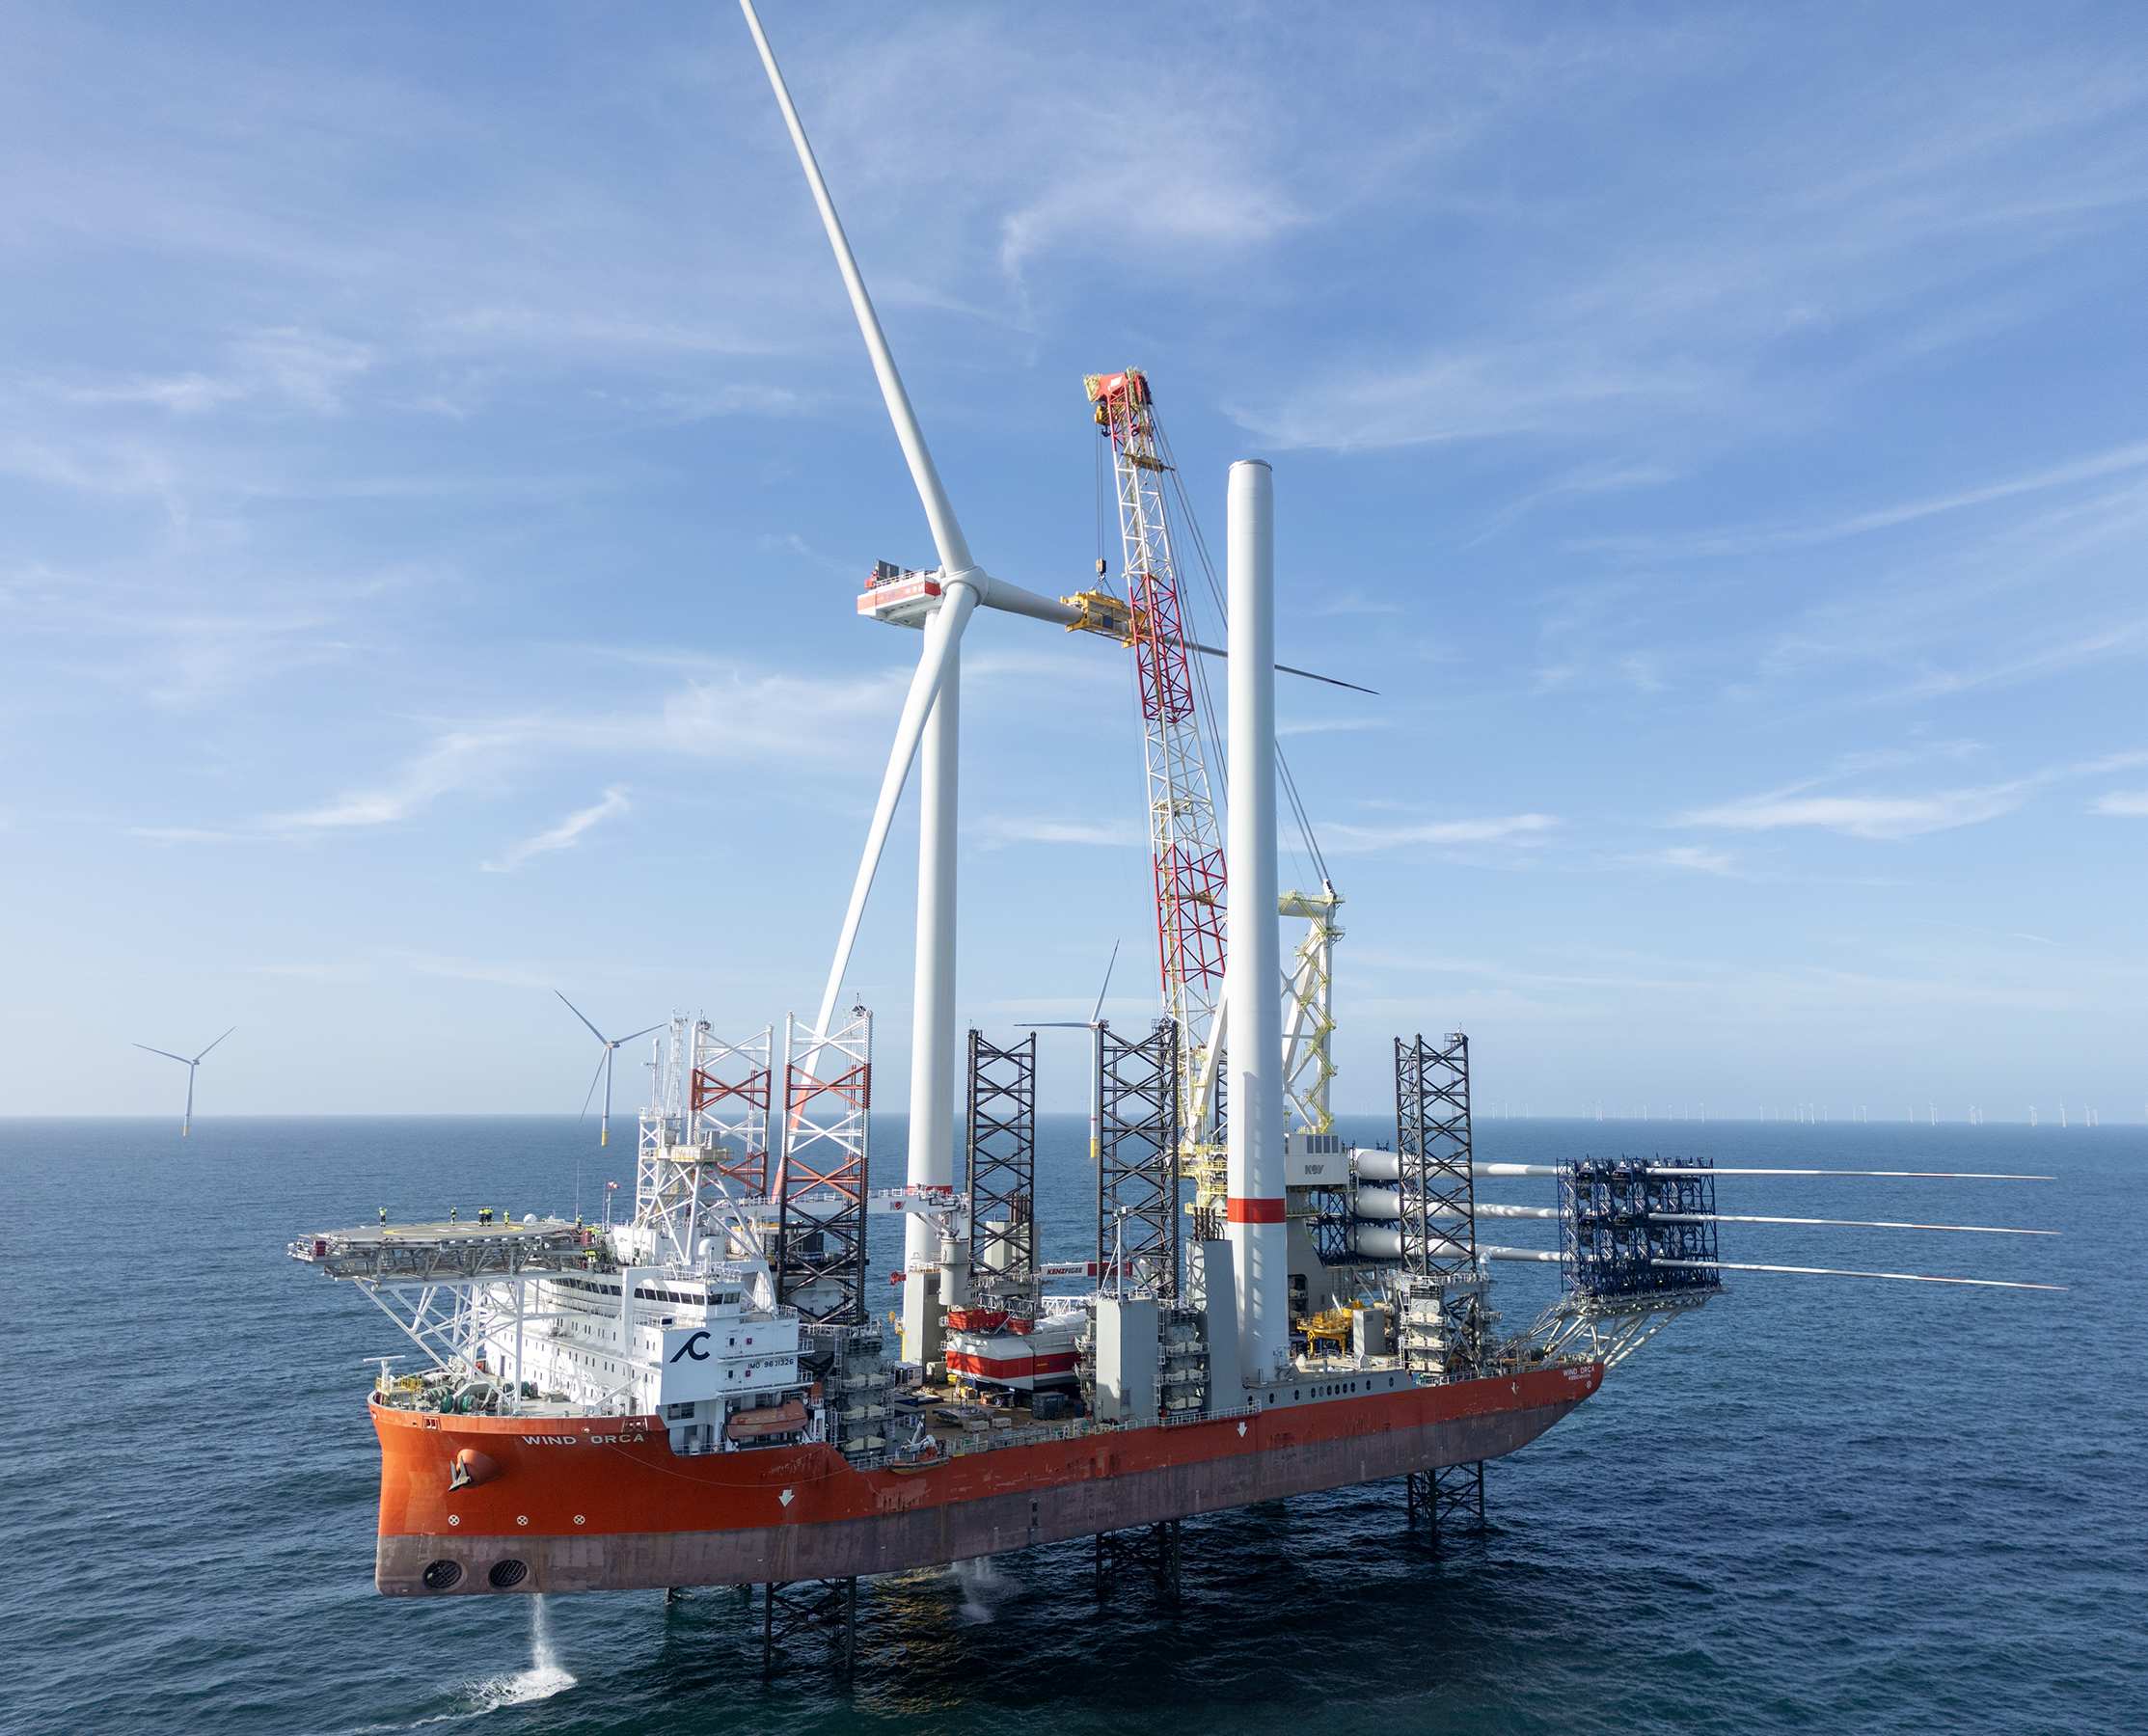
Tackling Climate Change
Continued from previous page
E1-5 – Energy consumption and mix
Cadeler used to track the energy consumption from the operation of its vessels, offices and other
equipment that contribute to its Scope 1 and Scope 2 emissions. In 2025, Cadeler also considered
emissions from the value chain (Scope 3) and all the scopes have been verified by an external specialist.
Please refer to Cadeler’s footprint below.
In 2024, Cadeler signed an agreement with Vindstød to deliver electricity from wind power to the head
office in Copenhagen. This guarantee of origin for the electricity delivered to the head office in
Copenhagen was the first step towards achieving the target of sourcing 100% of electricity from renewable
sources. Cadeler strives to connect more of its offices with renewable power agreements.
Energy intensity per net revenue* | 2025 | 2024 | % change |
Total energy consumption from activities in high climate impact sectors per net revenue from activities in high climate impact sectors (MWh/mEUR) | 270 | 353 | -23.6% |
*See Key Financial Figures for net revenue used to calculate the energy intensity ratio

Energy consumption
Cadeler uses Marine Gas Oil (MGO) to power operation of its vessels and, in much smaller amounts, petrol/
diesel for operation of company cars and other equipment.
Some vessels in the fleet are equipped with a system for monitoring energy consumption. Where
unavailable, all vessels are equipped with a system for monitoring fuel consumption and required to report
fuel consumption towards the office. The fuel record is used to calculate energy consumption based on the
average specific fuel oil consumption (SFOC). Accounting for energy consumption of onshore sites has
been based on invoices received. When the Company did not obtain such documentation, an average of
energy consumption per person across the other offices is applied to fill in the data gap.
Consumption mix has been calculated in Cadeler’s different locations: DK, UK, Japan, Taiwan and the US.
100% of the Company’s energy consumption is attributable to activities in high climate-impact sectors.
This is due to the fact that all revenue-generating operations are directly or indirectly linked to the
shipping industry, which is classified as a high climate impact sector.
79
Tackling Climate Change
Continued from previous page
Energy consumption and mix | 2025 | 2024 |
1. Fuel consumption from coal and coal products (MWh) | - | - |
2. Fuel consumption from crude oil and petroleum products (MWh) | 166,577 | 87,011 |
3. Fuel consumption from natural gas (MWh) | - | - |
4. Fuel consumption from other fossil sources (MWh) | - | - |
5.Consumption of purchased or acquired electricity, heat, steam, and cooling from fossil sources (MWh) | 1,073 | 567 |
6. Total fossil energy consumption (MWh) (calculated as the sum of lines 1 to 5) | 167,650 | 87,578 |
Share of fossil sources in total energy consumption (%) | 99.4% | 99.7% |
7. Consumption from nuclear sources (MWh) | 149 | 60 |
Share of consumption from nuclear sources in total energy consumption (%) | 0.1% | 0.1% |
8.Fuel consumption for renewable sources, including biomass (also comprising industrial and municipal waste of biologic origin, biogas, renewable hydrogen, etc.) (MWh) | 387 | - |
9. Consumption of purchased or acquired electricity, heat, steam, and cooling from renewable sources (MWh) | 445 | 183 |
10. The consumption of self-generated non-fuel renewable energy (MWh) | - | - |
11. Total renewable energy consumption (MWh) (calculated as the sum of lines 8 to 10) | 833 | 183 |
Share of renewable sources in total energy consumption (%) | 0.5% | 0.2% |
Total energy consumption (MWh) (calculated as the sum of lines 6, 7 and 11) | 168,631 | 87,821 |
80
Tackling Climate Change
Continued from previous page
Electricity consumption | 2025 | 2024 | % change |
Total consumption of purchased or acquired electricity (MWh) | 1,155 | 411 | 181% |
Total consumption of purchased or acquired electricity using contractual mechanisms to ensure renewable sources (MWh) | 233 | 160 | 46% |
Electricity from renewable sources (%) | 20% | 39% | -48% |
Please note that this table, electricity consumption, is not a specific requirement of CSRD, but is included to show Cadeler’s
progress against its target to procure 100% of its electricity from renewable sources by 2030
The percentage of purchased electricity from renewable energy sources decreased by 48% as compared
to 2024. The Copenhagen office remains the only location that Cadeler has made a power purchase
agreement for renewable electricity. In 2025, the proportion of electricity consumed by the Copenhagen
office decreased as Cadeler moved its UK office, Vejle office and Taipei office to new, larger premises,
enabling growth of workforces in these regions. In combination, these offices accounted for a larger
portion of Cadeler’s electricity footprint in 2025. Additionally, Wind Keeper was connected to shore
power during a drydock, which accounted for a significant portion of Cadeler’s 2025 electricity
consumption. Going forward, Cadeler maintains its ambition to get more renewable electricity purchase
agreements in place.
Cadeler’s carbon footprint
_________________________________
E1-6 – Gross Scope 1. 2. 3 and Total GHG emissions
Cadeler tracks its Scope 1, Scope 2, and Scope 3 emissions for the entire Company, Cadeler A/S. No part
of the business has been excluded in accounting of the Company’s footprint. Scope 1 emissions, being
direct emissions, are largely from the operation of Cadeler’s vessels, with the combustion of marine gas
oil in vessel engines acting as the primary emission source. Scope 2, being indirect emissions, covers the
purchase of electricity, steam, heating, and cooling. Scope 3 emissions, being indirect emissions, cover
Cadeler’s upstream and downstream value chain. As Cadeler main focus is the provision of windfarm
installation and maintenance services, the value chain emissions are predominantly upstream of the
organisation. For this reason, Cadeler has identified emissions stemming from the GHG Protocol’s Scope
3 categories one to seven.
Due to the growth of the Cadeler fleet from 5 vessels at the end of 2024 to 9 operating vessels at the
end of 2025, Cadeler’s GHG footprint has increased significantly compared to 2024. For further
information regarding Cadeler’s vessels, please refer to Our Fleet in the Management Report. Cadeler is
working to reduce emissions from its operations and improve the performance of its assets. The baseline
year against which improvements can be measured has been defined as 2021, representing the first full
year in which Cadeler operated as an independent entity for Scope 1 and Scope 2 emissions. For Scope 3,
2024 serves as the baseline as this is the first year with full Scope 3 emissions accounting.
In line with the Company-wide net-zero goal, Cadeler aims to close the gap to approach zero tonnes of
CO2e emitted from its vessel engines by 2035.
81
Tackling Climate Change
Continued from previous page
Cadeler is looking for ensuring ESG information, and especially the Company’s carbon emission, is
accurately assessed. To support this objective, Cadeler’s carbon emissions have been verified by an
independent auditor in 2024 and 2025. The Company’s Greenhouse Gas verification has been performed
based on ISO 14064. In 2025, the verification covers the following Scopes and results:

GHG emissions and intensity in 2025
______________________________________________
Scope 1 GHG intensity per net revenue decreased by 28%, indicating that Cadeler is generating greater
value while producing fewer carbon emissions relative to its revenue. However, absolute GHG emissions
increased following the delivery of five newbuilds. Scope 1 GHG emissions rose by 81%, reflecting the
addition of these new vessels to the fleet, despite ongoing efforts to decarbonise operations and a
relatively positive trend in emissions intensity metrics. This rise is also partly explained by transit voyages
from shipyards to the Company’s operational locations. As a result, the Company does not consider 2025
to be a fully reliable baseline year for comparison.
GHG intensity per net revenue per Scope | 2025 | 2024 |
Total GHG emissions Scope 1 per net revenue (tCO2e/mEUR) | 185 | 257 |
Total GHG emissions Scope 2 (location-based) per net revenue (tCO2e/mEUR) | 0 | 0 |
Total GHG emissions Scope 2 (market-based) per net revenue (tCO2e/mEUR) | 1 | 0 |
Total GHG emissions Scope 3 per net revenue (tCO2e/mEUR) | 2,040 | 1,212 |
82
Retrospective | Milestones and target years | |||||||
E1-6 - Gross Scopes 1, 2, 3 and Total GHG emissions | Base year | Base year value | 2024 | 2025 | % change | 2030 | 2035 | Annual % target/Base |
Scope 1 GHG emissions | ||||||||
Gross Scope 1 GHG emissions (tCO2eq) | 2021 | 36,846 | 64,000 | 115,939 | +81% | net zero | -7% | |
Percentage of Scope 1 GHG emissions from regulated emission trading schemes (%) | 2021 | 0 | 0 | 0 | 0% | |||
Scope 2 GHG emissions | 0% | |||||||
Gross location-based Scope 2 GHG emissions (tCO2eq) | 2021 | 16 | 82 | 156 | +89% | |||
Gross market-based Scope 2 GHG emissions (tCO2eq) | 2021 | 28 | 92 | 335 | +266% | |||
Significant scope 3 GHG emissions | ||||||||
Total Gross indirect (Scope 3) GHG emissions (tCO2eq) | 2024 | 301,392 | 301,392 | 1,275,370 | +323% | -9% | ||
1 Purchased goods and services | 2024 | 97,409 | 97,409 | 385,568 | +296% | |||
2 Capital goods | 2024 | 184,895 | 184,895 | 853,145 | +361% | |||
3 Fuel and energy-related Activities (not included in Scope1 or Scope 2) | 2024 | 14,492 | 14,492 | 27,672 | +91% | |||
4 Upstream transportation and distribution | 2024 | 248 | 248 | 1,486 | +499% | |||
5 Waste generated in operations | 2024 | 167 | 167 | 273 | +64% | |||
6 Business travel | 2024 | 4,049 | 4,049 | 6,969 | +72% | |||
7 Employee commuting | 2024 | 132 | 132 | 257 | +94% | |||
8 Upstream leased assets | 2024 | - | - | - | -% | |||
9 Downstream transportation | 2024 | - | - | - | -% | |||
10 Processing of sold products | 2024 | - | - | - | -% | |||
11 Use of sold products | 2024 | - | - | - | -% | |||
12 End-of-life treatment of sold products | 2024 | - | - | - | -% | |||
13 Downstream leased assets | 2024 | - | - | - | -% | |||
14 Franchises | 2024 | - | - | - | -% | |||
15 Investments | 2024 | - | - | - | -% | |||
Total GHG emissions | ||||||||
Total GHG emissions (location-based) (tCO2eq) | 365,474 | 1,391,466 | +281% | 281% | ||||
Total GHG emissions (market-based) (tCO2eq) | 365,484 | 1,391,645 | +281% | 2.8077 | ||||
83
Tackling Climate Change
Continued from previous page
Gross Scope 3 GHG emissions
Much of Cadeler’s scope 3 reporting is not based on direct sources
from its value chain. Many categories are calculated using spend-
based data rather than physical data.
Cat. 3.1 data is based on a 12-month assessment of company
spending.
3.2 newbuild vessel data is based on a Life-Cycle Assessment (LCA)
with emissions related to the manufacturing phase attributed to the
year of vessel delivery and spending data for other capital goods
3.3 data is based on the fuel records used for Scope 1 emissions
calculation. Cadeler used the well to tank emission factors published by
the UK government GHG conversion factors for company reporting.
3.4 data have been calculated based on a record of shipment from its
procurement system including information on transport type, start and
end locations, and weight of goods shipped and fuel reports from
third parties providing monopile delivery services.
3.5 data was derived from Cadeler’s waste management records for
2025. Sometimes, garbage management records on disposal methods
are missing, and in these cases, Cadeler assumes landfill as the
disposal method as a conservative approach
3.6 data is calculated based on an annual emissions report from each
of the travel agencies used for booking flights and other business-
travel related expenses as well as its expense reporting system
3.7 data is based on averages of own workforce commuting practices
that were determined via a survey sent out to employees.
GHG intensity per net revenue | 2025 | 2024 |
Total GHG emissions (location-based) per net revenue (tCO2e/mEUR) | 2,226 | 1,470 |
Total GHG emissions (market-based) per net revenue (tCO2e/mEUR) | 2,227 | 1,470 |
See Key Financial Figures in the Management Report for net revenue used to calculate the GHG intensity ratio
Gross Scope 1 GHG emissions
Items identified as contributing to Cadeler’s Scope 1 GHG emissions
consist primarily of vessel engine emissions due to combustion of
MGO, tank to wake emissions and, to a lesser extent, use of other
consumables such as lube oils and ozone depleting gases. Cadeler
accounts for all vessels in own operations, as Cadeler owns the fleet
and maintain operational control.
For Danish flagged vessels that are required to report into IMO Data
Collection System (DCS), Cadeler uses the fuel record that it also submits
for verification by a third party. Vessel fuel consumption is determined
using a combination tank sounding measurements and flowmeter
readings.
Gross Scope 2 GHG emissions
To convert energy consumption data to location-based GHG
emissions, Cadeler applies the emission factors based on national or
regional averages, giving priority to regional averages if available.
Market-based emissions are determined based on specific energy
sources chosen or procured by the organisation. This may include
emission factors associated with renewable energy certificates,
contractual agreements, or supplier-specific energy mixes. In the
absence of such procurement, the emissions are calculated using the
residual mix, which represents the unclaimed energy in the regional
grid, where available.
84
Tackling Climate Change
Continued from previous page
KPI 1: GHG Emissions per MW installed or serviced (tCO2e/MW)
Scope 1 CO2e emissions are assessed against the annual installation of wind turbine generators and
foundations as well as the maintenance of offshore wind power capacity. The core purpose of Cadeler is to
support the transition to a renewables-based energy system. Accordingly, Cadeler considers it important to
assess vessel performance based on the efficiency of supporting turbine installation and maintenance
measured as the amount of carbon emitted (negative impact) per MW of offshore wind power installed or
serviced (positive impact). The delivery and subsequent transit from Asia of the vessels delivered in 2025 is a
key emission source contributing to the increase in tCO2e/MW installed or serviced, as the vessel was not
performing installation or maintenance activities during the transit period.
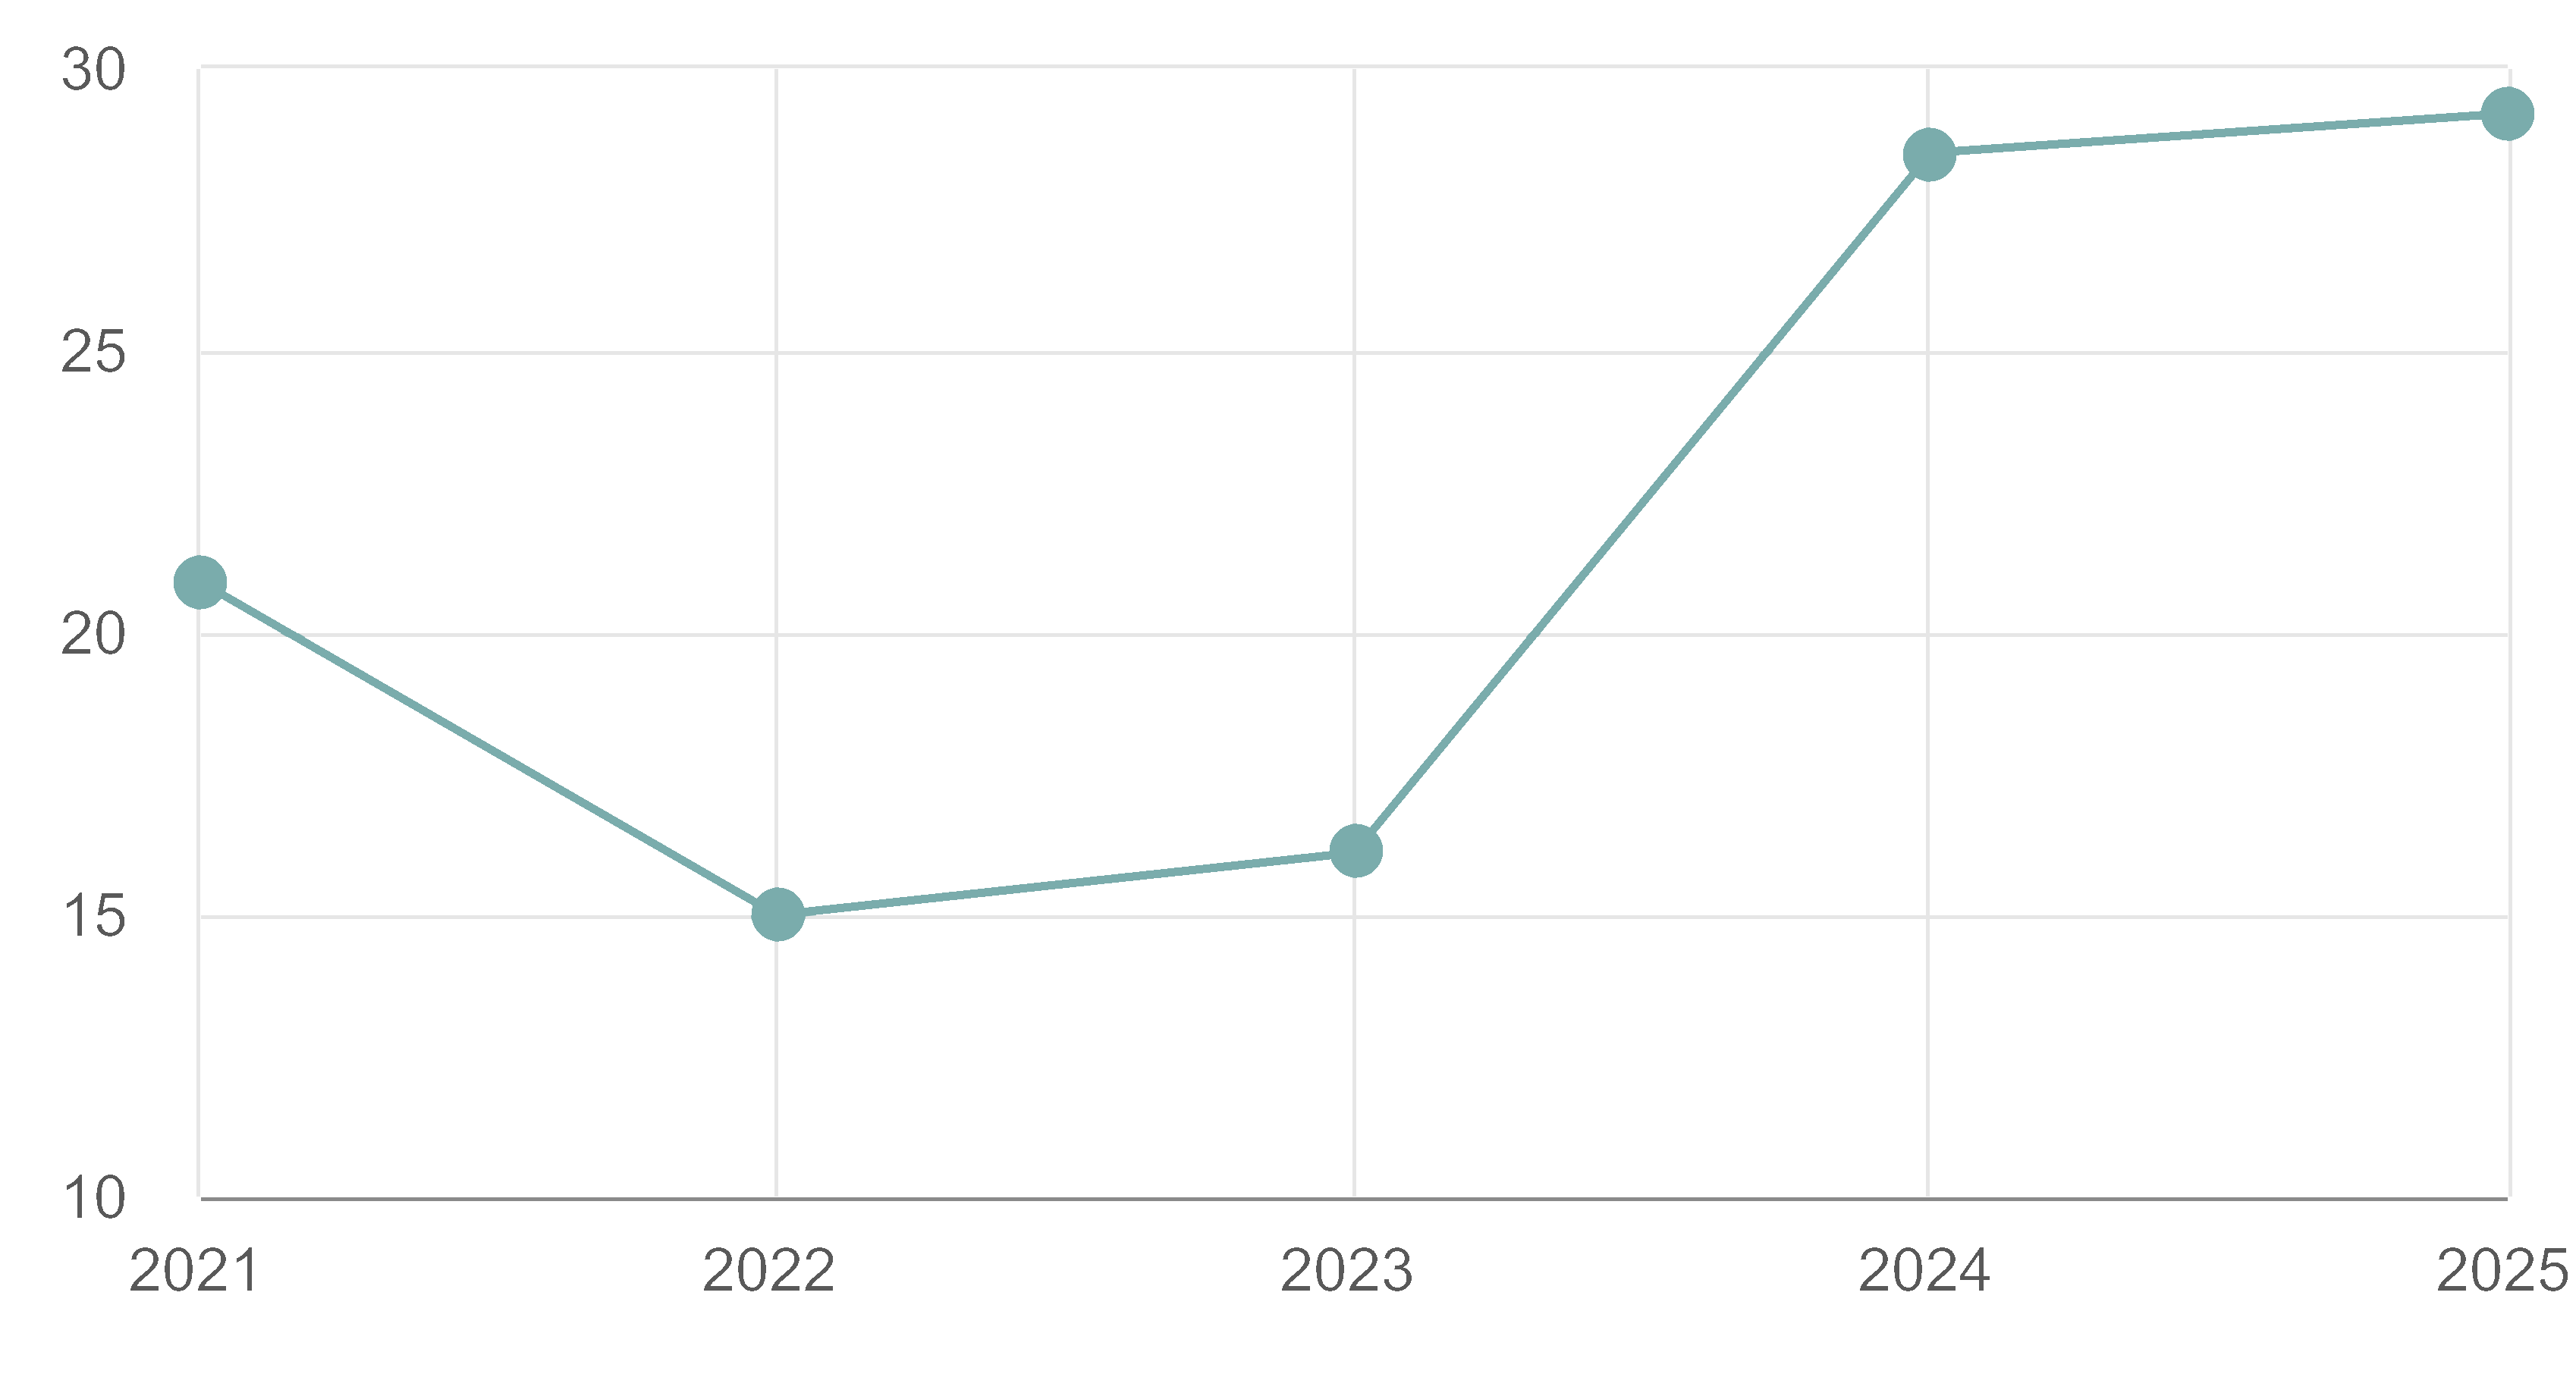
KPI 2: GHG emissions per EUR revenue (tCO2e/Million EUR)
Scope 1 CO2e emissions relative to annual revenue was incorporated in 2023. This KPI reflects the
Company’s commitment to driving decarbonisation strategies that align with its growth objectives, while
supporting innovation and efficiency across its operations. Measuring and managing Cadeler’s
environmental footprint in a transparent manner, integrating sustainability into business performance is
intended to demonstrate accountability. For both emissions intensity KPIs, Cadeler has selected 2021 as the
baseline year as this represents the first full year in which Cadeler operated as an independent Company
and the first year where Cadeler had full control of its environmental data.
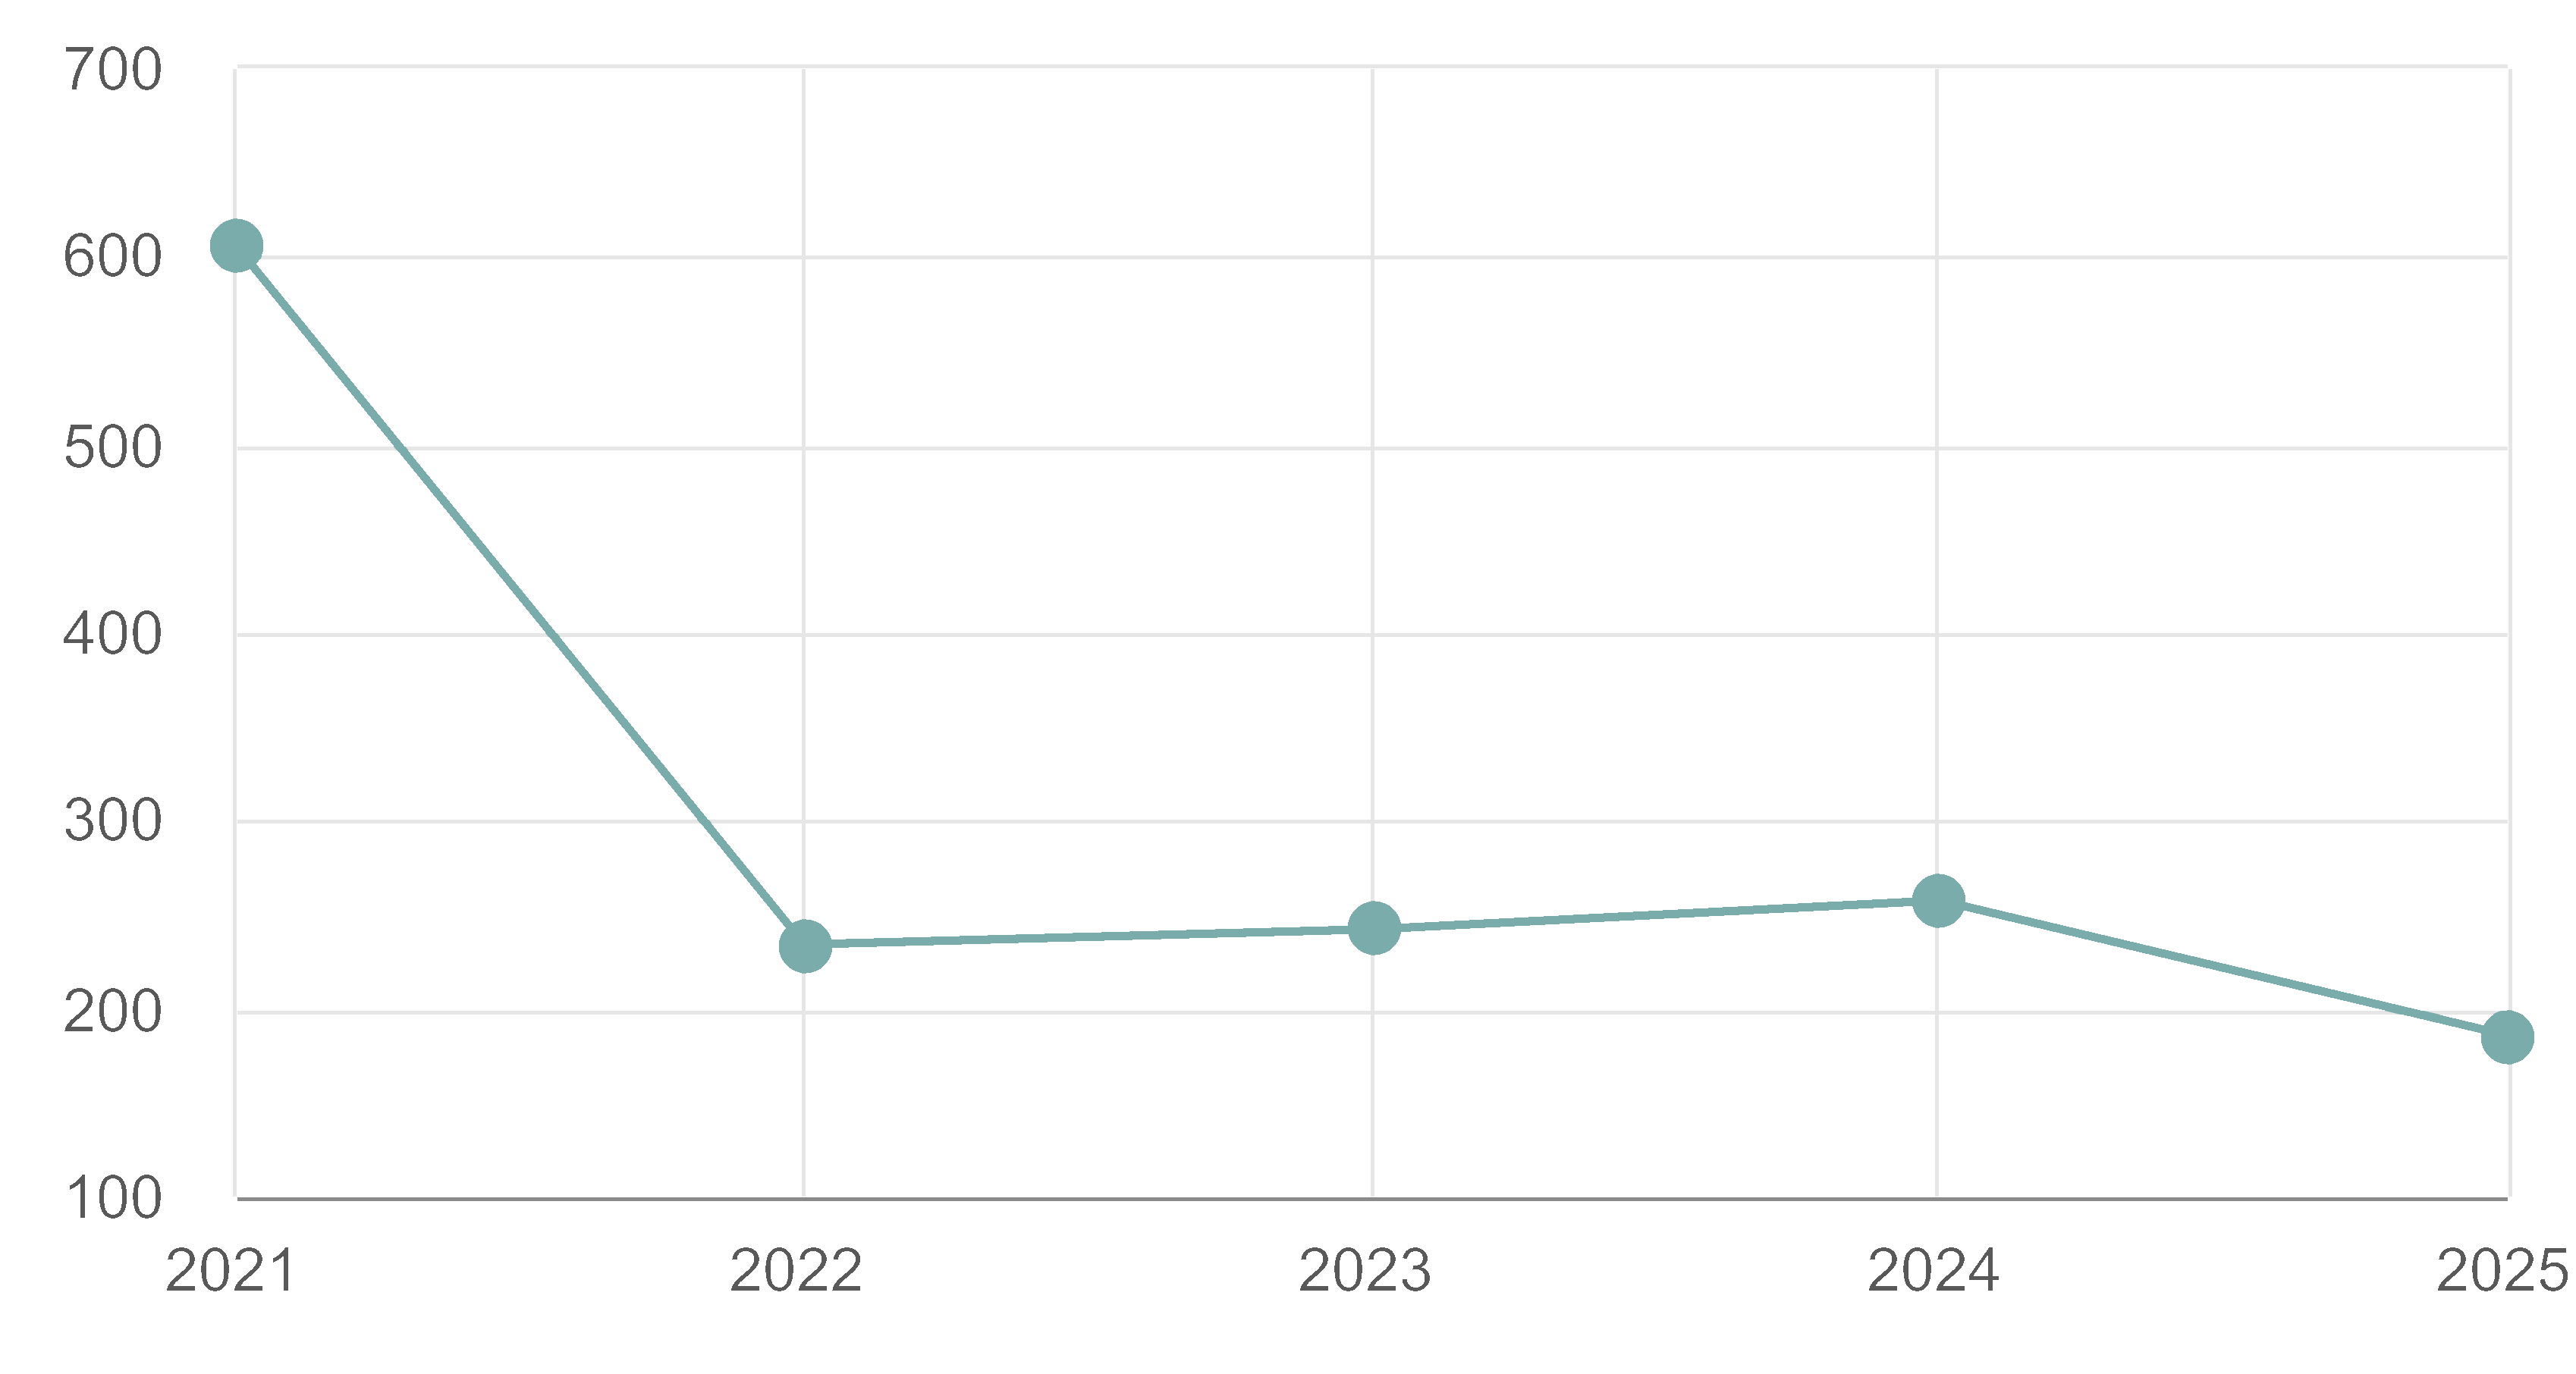
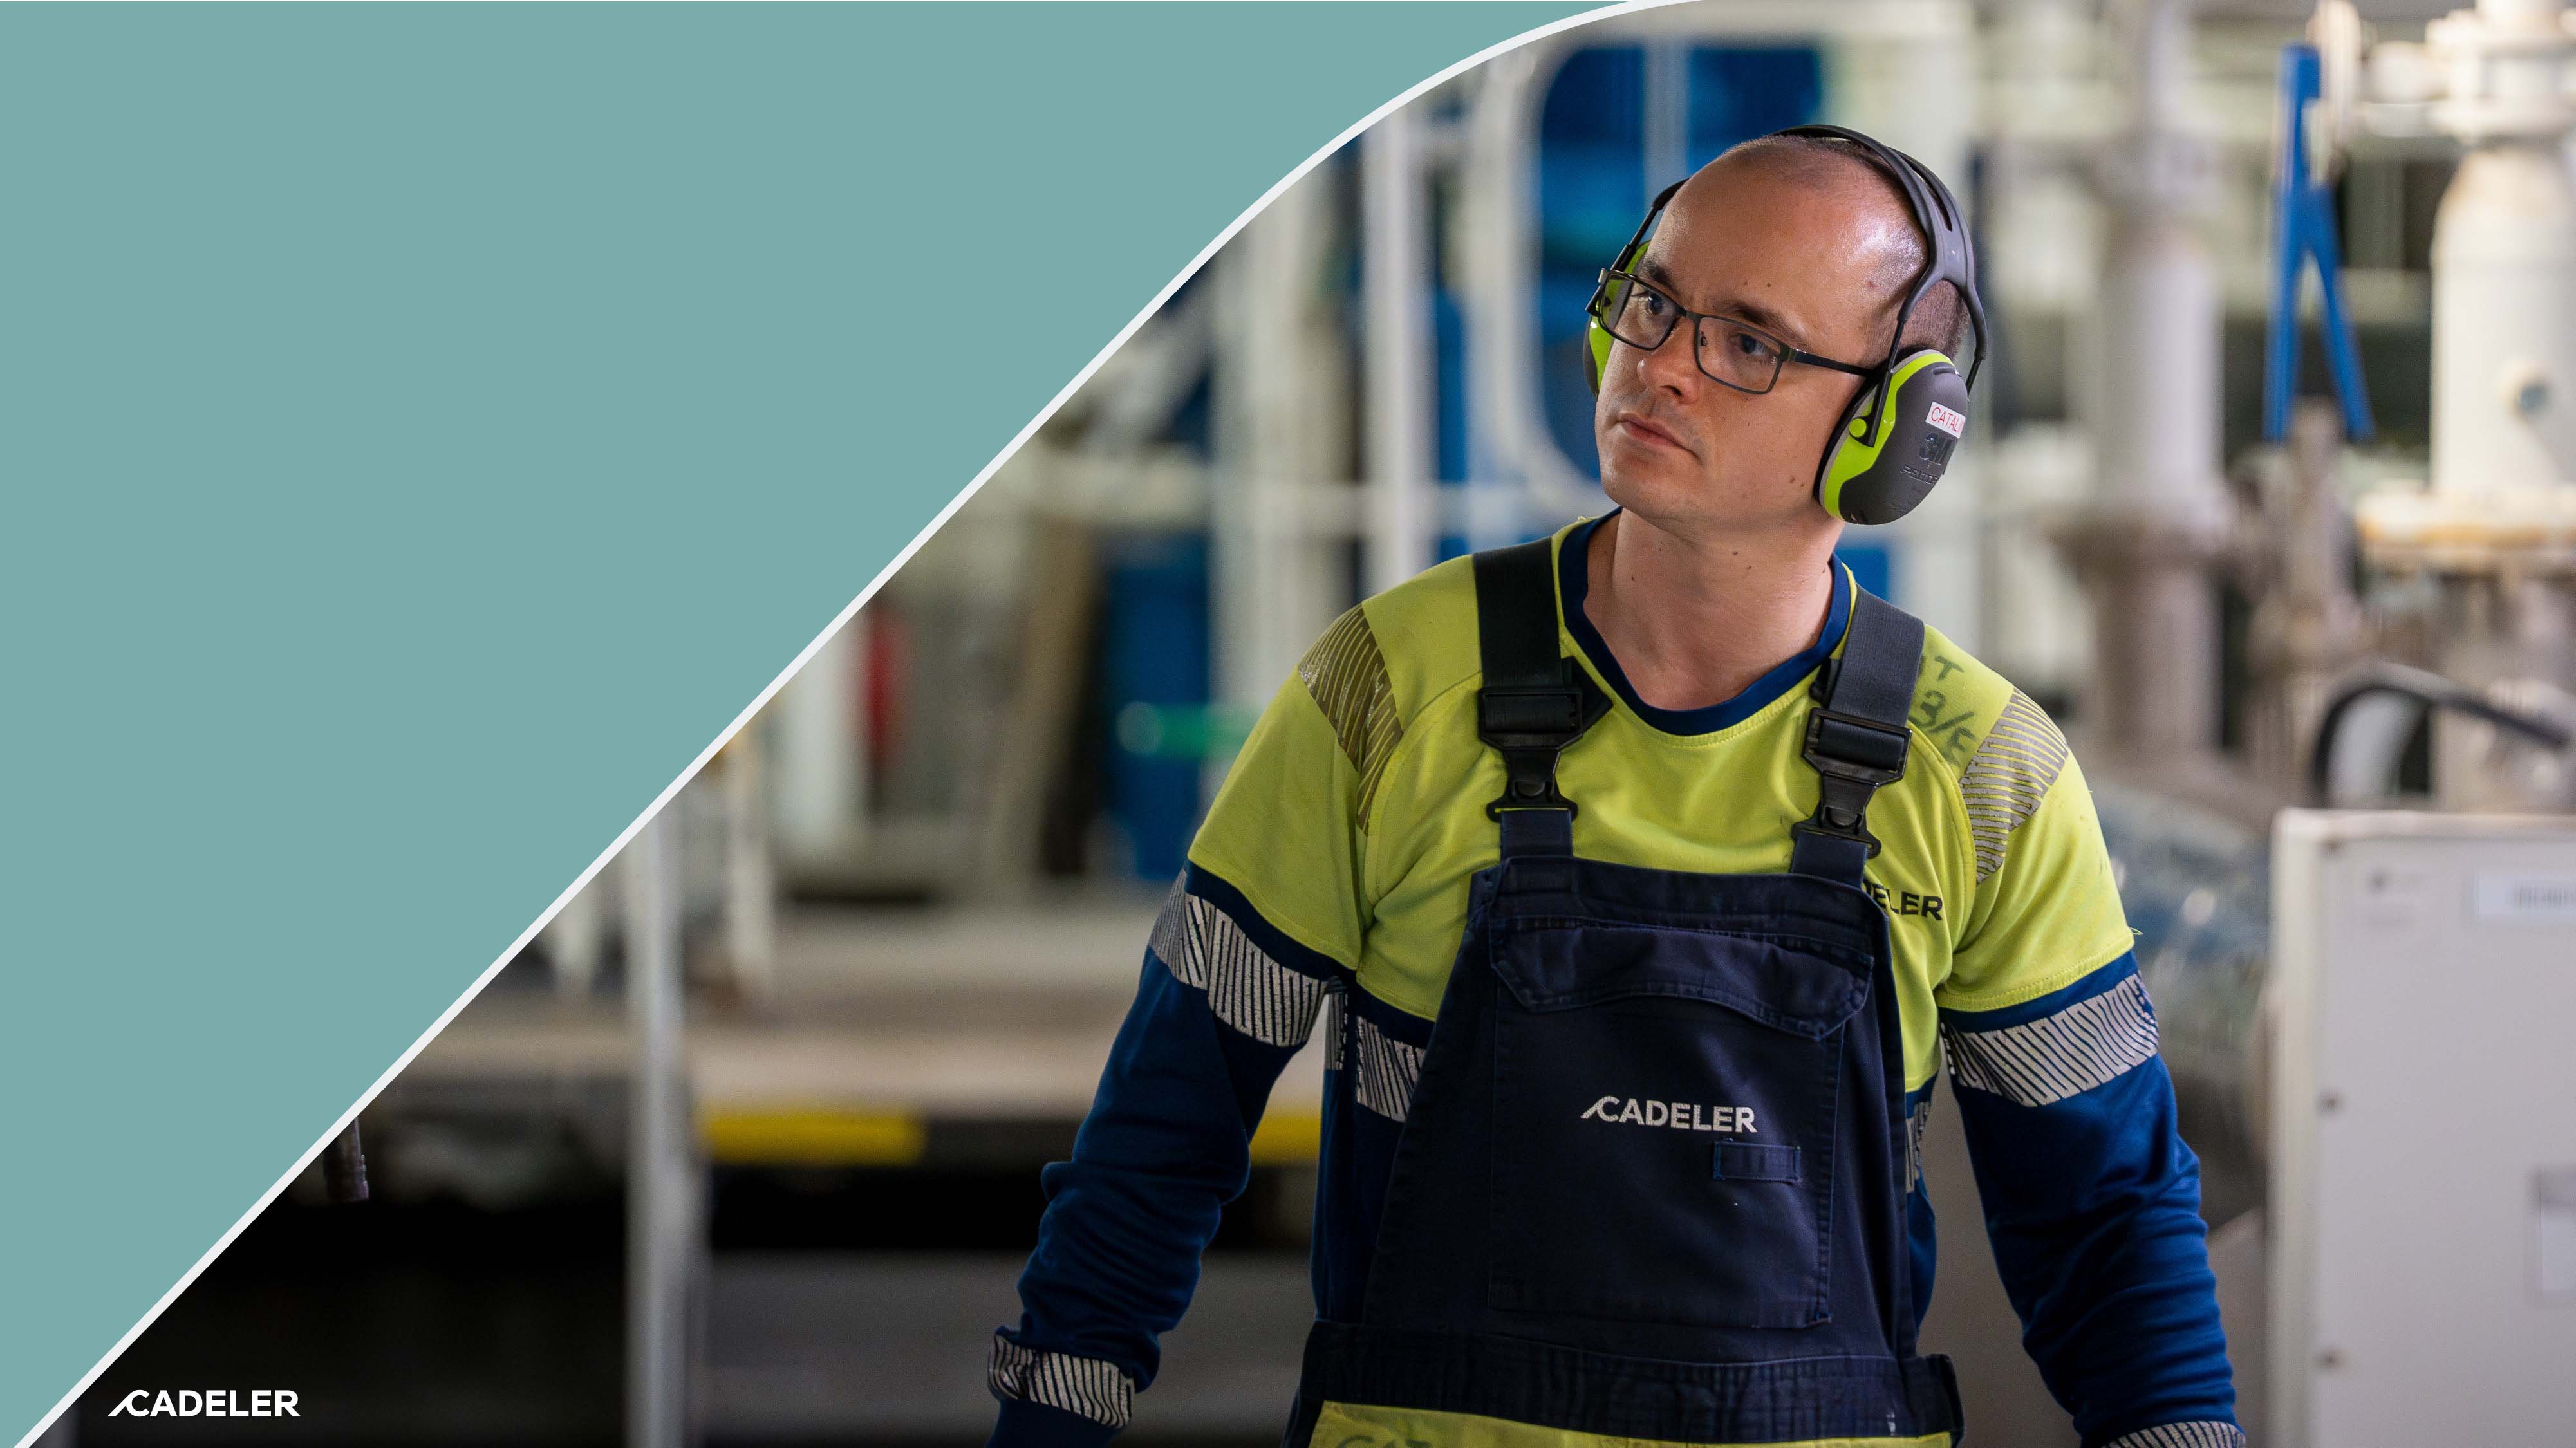
85
EU Taxonomy
86
EU Taxonomy
Cadeler publishes its 2025 EU Taxonomy reporting in accordance
with the Delegated Act published on 4 July 2025, amending
Delegated Regulation (EU) 2021/2178 as regards the simplification of
the content and presentation of information to be disclosed
concerning environmentally sustainable activities and Regulation (EU)
2023/2486 as regards simplification of certain technical screening
criteria for determining whether economic activities cause no
significant harm to environmental objectives.The Climate Delegated
Act and the Environmental Delegated Act specify technical screening
criteria for determining the conditions under which an economic
activity qualifies as contributing substantially to any of the
environmental objectives of the Taxonomy Regulation. Cadeler’s core
operational purpose is to support the installation of offshore
renewable energy sources. This activity contributes to climate change
mitigation and can be aligned with the EU Taxonomy’s objective
when performed in a manner that does no significant harm to the
other five environmental objectives of the Taxonomy and complies
with the minimum social safeguards. The majority of the Company’s
eligible economic activities relating to the installation of offshore
wind energy can be categorised as activity 4.3 – electricity generation
from wind power. This category was selected in line with FAQ 139 of
Commission Notice C/2023/267 on the interpretation and
implementation of certain provisions of the EU Taxonomy, published
by the EU Commission on 29 November 2024, which links
commercial-scale installation and maintenance activities to category
4.3 rather than to other categories potentially associated with the
installation and maintenance of renewable energy.
Do no significant harm (DNSH)
Cadeler has performed the following activities to support compliance
with the DNSH requirements for climate change mitigation activity
4.3.
Climate Change Adaptation
In late 2023, Cadeler performed its first risk assessment for
addressing the impact of climate change on its assets and key parts
of its supply chain. This was followed up by a second assessment that
was finalized in early 2026. The assessment considered the
representative concentration pathway scenario 8.5 (RCP 8.5), which
represents the worst-case scenario as identified by the IPCC, and
considered two time horizons, 2030 and 2050, with the timespan
based on Cadeler’s visibility of its scope of operations.
Cadeler sees some potential for varying levels of operational weather
downtime with respect to its own operations as a slight risk due to
changing wind patterns with increased frequency of storms, extreme
wind events, at the locations assessed. The Company also recognises
some elevated risks across its supply chains where fixed assets and
providers, such as ports and shipyards, are exposed to climate-
related risks, including variable precipitation events, flooding,
droughts, storms, changing wind patterns and heat waves which may
periodically interrupt operations or in some cases damage
infrastructure that Cadeler may rely on to perform its vessel
operations or for the delivery of core operational equipment and
provisions.
Cadeler has considered physical climate hazards as defined by the EU
Taxonomy requirements for a climate risk assessment. For the
assessment, Cadeler considered its own vessel operations, including
all known future wind farm locations at the time of the assessment, all
known ports that would be used to complete these projects, the main
offices, and potential impacts on its core suppliers such as shipyards
and critical equipment providers.
Post assessment, Cadeler sees a rather low vulnerability in its own
operations due to climate-related impacts. The main risk is likely to
be changing weather conditions that affect the weather downtime of
the vessels. Cadeler did recognise medium and high levels of
vulnerability in some parts of its supply chain; for example, at ports
due to potential flooding and high wind incidents that could cause
longer periods of inaccessibility due to the potential for damaged
infrastructure.
Additionally, some elevated risk was identified in relation to the on-
time delivery of vessels and larger items of equipment, as many of
the facilities that produce these products are located in riverine and
coastal areas in typhoon-impacted regions. As a result, an elevated
potential for damage to supplier facilities due to high winds, changes
in precipitations, and flooding was identified in the climate risk
model. Cadeler’s means of mitigating this vulnerability may include
ensuring sufficient contingency time when ordering any key
equipment from areas with an elevated climate risk.
87
EU Taxonomy
Continued from previous page
This approach allowed Cadeler to determine whether climate
impacts could pose potential risks to its business. In future iterations,
Cadeler plans to adopt a more nuanced approach by incorporating
multiple RCP scenarios to further assess the likelihood and severity
of the identified risks. The Company has already done so in its most
recent assessment; however, the internal reporting includes only
impacts under the RCP 8.5 scenario, as it was considered clearer for
internal decision-makers to understand the potential risks.
Cadeler has a few measures in place in response to the identified
climate risks. These include development of adverse weather plans
for its vessels for operations in regions with elevated risk of severe
weather and ensuring that spare parts are available via ordering
with contingency in supplier schedules and keeping critical items on
stock, if possible. As a result of the most recent assessment, a few
new adaptation measures have been recommended towards
Cadeler’s Executive Senior Leadership. The full description of this
climate assessment is present in section ESRS 2 SBM-3.
Sustainable use and protection of water and marine
resources
With regard to the construction of offshore wind farms, the activity
must not hamper the achievement of good environmental status as
set out in Directive 2008/56/EC of the European Parliament and of
the Council, requiring that appropriate measures are taken to
prevent or mitigate impacts in relation to the Directive’s Descriptor
11 (Noise/Energy). Prior to commencement of construction activities,
windfarms are subject to attainment of an environmental permit,
which typically sets operational requirements during construction.
Additionally, Cadeler performs an environmental impact and risk
assessment prior to commencement of new scopes of work to
identify any potentially negative impacts and develop associated
mitigation techniques.
Transition to a circular economy
The activity assesses the availability of and, where feasible, utilises
equipment and components with high durability and recyclability
which are easy to dismantle and refurbish. In 2024, Cadeler also
procured a third party expert for performance of a lifecycle
assessment (LCA) of its vessels to map the environmental footprint
of the manufacturing and decommissioning phases. This was
followed up in late 2025 with another LCA covering the new classes
of vessels in the Cadeler fleet. This assessment represented a first
step toward gaining a clearer understanding of the value of specific
changes to the Company’s shipbuilding and operational choices.
Additionally, low-carbon steel has been procured for the
construction of major components of the jacking system on
Cadeler’s newbuild vessel, Wind Apex. Low-carbon is defined as a
type of steel that contains a small amount of carbon, typically about
0.05% to 0.25% carbon by weight Finally, the Company’s project
engineering department has been working on optimising the design
of project seafastening used on Cadeler projects for less overall steel
use and adaptability for project to project reuse. In 2025, 578 tons of
steel were reused. Cadeler has started installing the first 15MW
turbines and contributed to integrating reused steel into tower
grillages, as well as blade rack root-end and tip-end grillages for this
turbine type. As a result, the amount of reused material is expected
to increase in the coming years, starting in 2026. The Company is
continuously assessing whether additional initiatives can be
established to support the transition to a circular economy.
Pollution prevention and control
This category is not applicable for alignment with EU Taxonomy activity
4.3. However, Cadeler operates its vessels in accordance with MARPOL,
the International Maritime Organisation’s international convention
covering prevention of pollution of the marine environment by ships.
Protection and restoration of biodiversity and ecosystems
With regard to the construction of offshore wind farms, the activity
cannot hamper the achievement of good environmental status as
set out in Directive 2008/56/EC of the European Parliament and of
the Council, requiring that appropriate measures are taken to
prevent or mitigate impacts in relation to the Directive’s Descriptors
1 (biodiversity) and 6 (seabed integrity). All offshore wind farms in
regions where Cadeler operates are legally required to have an
environmental impact assessment performed before the approval
for construction is granted. These permits often lead to specific
operational requirements that Cadeler must comply with as a
contractor. Cadeler does not control the permitting process at the
wind farm level, but it does collaborate with its clients on
operational measures that may address, reduce or mitigate any
potentially adverse impacts on biodiversity and ecosystems.
Nuclear and fossil gas related activities
Cadeler does not conduct activities related to nuclear and fossil gas.
88
EU Taxonomy
Continued from previous page
Minimum Social Safeguards
Cadeler has a corporate set of policies in place that outline its
commitment to protect human rights, prevent corruption, and
promote fair competition and taxation. The Company has also
designated functions responsible for embedding its policies into the
Company’s systems and work culture. On top of that, Cadeler commits
to respect human rights and under its Human Rights Policy seeks to
identify, prevent, mitigate and remedy any adverse impacts resulting
from or caused by its business activities. Cadeler acknowledges that
human rights risks are inherently high for Cadeler and its industry,
given the nature of offshore work and its supply chain.
Human Rights
Cadeler has publicly available policies that include its approach to
human rights such as a Human Rights policy, a Company Code of
Conduct, and a Supply Chain Code of Conduct. The Company has
introduced a due diligence process as part of supplier onboarding
and has implemented compliance requirements with its Supply Chain
Code of Conduct into the standard terms and conditions for supplier
contracts. The Company has a dedicated Ethics and Compliance
function responsible for overseeing human rights. It maintains a
policy on human rights and a policy for the remediation and
mitigation of any potential human rights impacts. In 2025, Cadeler
completed its first formal Human Rights Impact Assessment with the
support of a third-party expert. The assessment’s findings will guide
the Company’s roadmap for addressing potential human rights
impacts, with future assessments conducted every three years.
Cadeler reports annually on its human rights program in the Annual
Report and has published a UK Modern Slavery Statement. Both
documents are approved by the Board of Directors and are publicly
available on the Company’s website.
Grievance Mechanisms
Cadeler has a confidential reporting hotline, Speak Up!, which is
available to all employees, business partners and the general public
and allows for anonymous reporting. Employees are informed of this
mechanism during onboarding, and it is accessible via the Company’s
SharePoint site and public website. Cadeler commits to a non-
retaliation policy for any reports submitted in good faith.
Consumer Interests
Cadeler operates in accordance with EU requirements.
Anti-Corruption
Cadeler has a Code of Conduct and an Anti-Bribery & Corruption
policy that define expected behaviours related to this topic. The
Company also maintains documentation of reported incidents,
conducts internal trainings, performs suppliers due diligence,
maintains internal organisational control procedures, and shares
necessary information publicly through its Annual Reporting.
Competition
The Company provides employees with guidance on competition-
related matters through the Code of Conduct and targeted training is
provided to at-risk functions and senior leadership.
Taxation
Cadeler has a publicly available tax policy that outlines the
Company’s practices and its commitment to compliance with tax
regulations in all jurisdictions in which it operates.
89
EU Taxonomy
Continued from previous page
Taxonomy KPIs
Taxonomy eligibility and alignment are expressed using three KPIs,
calculated as the proportion of turnover, CapEx, and OpEx that is
Taxonomy-eligible and Taxonomy-aligned (numerator) divided by
total turnover, CapEx, and OpEx. The calculations are prepared in
accordance with IFRS. Under the EU Taxonomy, an activity must not
significantly harm any other environmental objective to be
considered aligned. Cadeler’s core operations support the installation
of renewable energy sources, which meet the definition of climate
change mitigation. This activity is aligned with the EU Taxonomy
when carried out in a manner that does no significant harm to the
other five environmental objectives. Alignment with an EU Taxonomy
objective also requires that the economic activity is conducted with
appropriate social safeguards. As noted, Cadeler operates without
compromising Minimum Social Safeguards. Furthermore, there is no
risk of double counting in the calculation of KPIs, as only one activity
is relevant for the three KPIs.
KPI for Taxonomy-aligned turnover
The proportion of Taxonomy-aligned activities is calculated as net
turnover from products and services associated with Taxonomy-
aligned activities, including turnover from operation of a fleet of
purpose-built vessels used for the installation and maintenance of
offshore wind energy, divided by total net turnover.
KPI for Taxonomy-aligned CapEx
CapEx is defined as Taxonomy-aligned CapEx, capital expenditures
related to the operation of a fleet of purpose-built vessels for the
installation and maintenance of offshore wind energy, divided by
total CapEx. Total CapEx consists of additions to tangible and
intangible fixed assets before depreciation, amortisation and re-
measurements, including acquisitions of property, plant and
equipment, intangible assets, leases with usage rights and investment
properties.
KPI for Taxonomy-aligned OpEx
The EU Taxonomy defines OpEx differently than IFRS: this KPI aims to
capture non-capitalised costs which relate to investments in assets
and processes. The OpEx is therefore a category of costs which
complements CapEx in relation to investments. Taxonomy-defined
OpEx includes only direct costs related to:
(iv) Research and development, excluding overheads
(v) Building renovation
(vi) Short-term lease agreements
(vii) Maintenance, upkeep and repairs
Cadeler assesses its alignment on an annual basis.
90
EU Taxonomy
ANNEX II Template I: Proportion of turnover, CapEx, OpEx from products or services associated with Taxonomy-eligible or Taxonomy-aligned economic activities – disclosure covering year
2025 | |||||||||||||||
KPI (1) | Total (2) | Proportion of Taxonomy eligible activities (3) | Taxonomy aligned activities (4) | Proportion of Taxonomy aligned activities (5) | Breakdown by environmental objectives of Taxonomy aligned activities | Proportion of enabling activities (12) | Proportion of transitional activities (13) | Not assessed activities considered non-material (14) | Taxonomy aligned activities in previous financial year (15) | Proportion of Taxonomy aligned activities in previous financial year (16) | |||||
Climate Change Mitigation (6) | Climate Change Adaptation (7) | Water (8) | Circular Economy (9) | Pollution (10) | Biodiversity (11) | ||||||||||
Turnover | 620.4 mEUR | 100% | 620.4 mEUR | 100% | 100% | 0% | 0% | 0% | 0% | 0% | 0% | 0% | 0% | 248.7 mEUR | 100% |
CapEx | 1,323.7 mEUR | 100% | 1,323.7 mEUR | 100% | 100% | 0% | 0% | 0% | 0% | 0% | 0% | 0% | 0% | 650.0 mEUR | 100% |
OpEx | 23.1 mEUR | 100% | 23.1 mEUR | 100% | 100% | 0% | 0% | 0% | 0% | 0% | 0% | 0% | 0% | 10.8 mEUR | 100% |
91
EU Taxonomy – Turnover
ANNEX II Template II: Proportion of turnover from products or services associated with Taxonomy-eligible or Taxonomy-aligned economic activities – disclosure covering year (N) (activity breakdown)
Reported KPI (Turnover) | |||||||||||||
2025 | |||||||||||||
Economic Activities (1) | Code (2) | Taxonomy eligible KPI (Proportion of Taxonomy eligible Turnover) (3) | Taxonomy aligned KPI (monetary value of Turnover) (4) | Taxonomy aligned KPI (Proportion of Taxonomy aligned Turnover (5) | Environmental objective of Taxonomy aligned activities | Enabling activity (12) | Transitional activity (13) | Proportion of Taxonomy aligned in Taxonomy eligible (14) | |||||
Climate Change Mitigation (6) | Climate Change Adaptation (7) | Water (8) | Circular Economy (9) | Pollution (10) | Biodiversity (11) | ||||||||
Electricity generation from wind power | 4.3 CCM | 100% | 620.4 mEUR | 100% | 100% | 0% | 0% | 0% | 0% | 0% | E | T | 100% |
Sum of alignment per objective | 100% | 0% | 0% | 0% | 0% | 0% | |||||||
Total KPI (Turnover) | 620.4 mEUR | ||||||||||||
Y-Yes (taxonomy-eligible and taxonomy-aligned activity with the relevant environmental objective); N-No (taxonomy-eligible but not taxonomy-aligned activity with the relevant environmental objective); N/EL- Not eligible; EL-eligible; CCM-climate change mitigation
92
EU Taxonomy – CapEx
ANNEX II Template II: Proportion of CapEx from products or services associated with Taxonomy-eligible or Taxonomy-aligned economic activities – disclosure covering year (N) (activity breakdown)
Reported KPI (CapEx) | |||||||||||||
2025 | |||||||||||||
Economic Activities (1) | Code (2) | Taxonomy eligible KPI (Proportion of Taxonomy eligible CapEx) (3) | Taxonomy aligned KPI (monetary value of CapEx) (4) | Taxonomy aligned KPI (Proportion of Taxonomy aligned CapEx (5) | Environmental objective of Taxonomy aligned activities | Enabling activity (12) | Transitional activity (13) | Proportion of Taxonomy aligned in Taxonomy eligible (14) | |||||
Climate Change Mitigation (6) | Climate Change Adaptation (7) | Water (8) | Circular Economy (9) | Pollution (10) | Biodiversity (11) | ||||||||
Electricity generation from wind power | 4.3 CCM | 100% | 1,323.7 mEUR | 100% | 100% | 0% | 0% | 0% | 0% | 0% | E | T | 100% |
Sum of alignment per objective | 100% | 0% | 0% | 0% | 0% | 0% | |||||||
Total KPI (CapEx) | 1,323.7 mEUR | ||||||||||||
Y-Yes (taxonomy-eligible and taxonomy-aligned activity with the relevant environmental objective); N-No (taxonomy-eligible but not taxonomy-aligned activity with the relevant environmental objective); N/EL- Not eligible; EL-eligible; CCM-climate change mitigation
93
EU Taxonomy – OpEx
ANNEX II Template II: Proportion of OpEx from products or services associated with Taxonomy-eligible or Taxonomy-aligned economic activities – disclosure covering year (N) (activity breakdown)
Reported KPI (OpEx) | |||||||||||||
2025 | |||||||||||||
Economic Activities (1) | Code (2) | Taxonomy eligible KPI (Proportion of Taxonomy eligible OpEx) (3) | Taxonomy aligned KPI (monetary value of OpEx) (4) | Taxonomy aligned KPI (Proportion of Taxonomy aligned OpEx (5) | Environmental objective of Taxonomy aligned activities | Enabling activity (12) | Transitional activity (13) | Proportion of Taxonomy aligned in Taxonomy eligible (14) | |||||
Climate Change Mitigation (6) | Climate Change Adaptation (7) | Water (8) | Circular Economy (9) | Pollution (10) | Biodiversity (11) | ||||||||
Electricity generation from wind power | 4.3 CCM | 100% | 23.1 mEUR | 100% | 100% | 0% | 0% | 0% | 0% | 0% | E | T | 100% |
Sum of alignment per objective | 100% | 0% | 0% | 0% | 0% | 0% | |||||||
Total KPI (OpEx) | 23.1 mEUR | ||||||||||||
Y-Yes (taxonomy-eligible and taxonomy-aligned activity with the relevant environmental objective); N-No (taxonomy-eligible but not taxonomy-aligned activity with the relevant environmental objective); N/EL- Not eligible; EL-eligible; CCM-climate change mitigation
94
Control and reduce air and water pollution
Impacts, Risks and Opportunities management
___________________________________________________________
ESRS 2 IRO-1 – Description of the processes to identify and assess
material pollution-related impacts, risks and opportunities
Cadeler conducted Environmental risk and impact assessments with
the intention to cover all environmental aspects, including those
related to the ESRS topics of pollution. The results from the annual
environmental risk and impact assessments are used as a starting
point for identification of IROs to be assessed in Cadeler’s DMA.
Consultations have not been conducted with potentially affected
communities, though Cadeler does take the advice of industry bodies
with recommendations on best practice for pollution control from
shipping, i.e. IMO and Danish Shipping.
The pollution topics identified as material were considered material
from an impact perspective. These topics included pollution of air,
pollution of water, and microplastic pollution. External stakeholders
also expressed concerns in understanding Cadeler’s methods for
prevention of water pollution due to the potential for spills, as its
operations take place in the offshore environment.
IROs related to these topics that were considered material include:
emissions of NOx, SOx, particulates and VOCs from the vessel
engines to the air; potential for spills of hydrocarbons or chemicals
from Cadeler’s operations into the oceans; production of hazardous
wastes from the Company’s operations, including waste lubrication
oils, bilge water (oily water), electrical wastes, and other solid wastes
contaminated with hydrocarbons or chemicals; microplastic pollution
from Cadeler’s wastewater, vessel paints, and use of plastics during
operations that eventually break down into microplastics.
E2-1 – Policies related to pollution
Cadeler works to meet the environmental legal requirements of the
countries in which it operates and Decarbonisation and Performance
department ensures that risks associated with operations are
appropriately identified and managed.
To sufficiently manage environmental impact, it is paramount to
consider all environmental aspects relevant to the operations, such as
air pollution, water pollution, sewage management, waste
management, soil contamination, climate change mitigation and
adaptation, and resource use and efficiency.
Each policy includes a scope section stating what is included and
excluded. The policies, signed by the CEO and CFO, ensure
accountability for implementation. They commit Cadeler to protect
people, the environment and assets, with reference to relevant
legislation and recognised standards for compliance. Publicly
available on the Company’s website, the policies are also included in
client tenders and contractor agreements. They assign HSEQ
responsibility to all personnel working for or with Cadeler,
emphasising active participation in continuous improvement.
To control and improve environmental performance, Cadeler has a
management manual, an HSEQ policy and a sustainable development
policy in place. These documents outline corporate practices for
working towards more sustainable business practices. Cadeler’s ISO
14001:2015 certified environmental management system establishes
the set of formal policies, processes and requirements implemented
to minimise environmental impacts from its operations.
The management system applies not only to all vessels operated by
Cadeler, but also to its operational sites, offices, and a wide range of
activities. The approach to pollution control is largely informed by
IMO’s International Convention for the Prevention of Pollution from
Ships (MARPOL). Pollution monitoring practices have not been
checked against EU BREF standards as Cadeler has not seen an
industry specific BREF targeting shipping or marine construction.
Moreover, Cadeler does not currently conduct direct measurements
of pollutants. However, where it relies on automatic consumption
readings of consumables contributing to pollutant emissions, such as
marine gas oil, the Decarbonisation and Performance Department
ensures that these systems are properly calibrated through the
vessels’ planned maintenance systems.
95
Control and reduce air and water pollution
Continued from previous page
Aiming for zero spills
___________________________
The Company aims to ensure zero spills of hydrocarbons and other
toxic substances into the marine environment. Checks are carried out
to ensure proper storage of chemicals and hydrocarbons on board
and that sufficient secondary containment is available. Each vessel
carries a shipboard marine pollution emergency plan (SMPEP) and
regularly performs ship oil pollution emergency plan drills (SOPEP).
Ballast water protocols
_____________________________
To prevent the spread of invasive aquatic species, Cadeler complies
with the Ballast Water Management Convention. The vessels have a
ballast water management plan, maintain a ballast water record book
and hold an international ballast water management certificate. All
newbuilds are delivered with ballast water treatment system. Cadeler
has 100% of its fleet operating with ballast water treatment systems
onboard, ensuring compliance with the International Maritime
Organisation’s D-2 Ballast Water Performance Standard.
E2-2 – Actions and resources related to pollution
Cadeler has implemented several measures to mitigate potential
water pollution. Additional actions will be developed and
implemented as new technical solutions become available in own
operations and along the value chain. Current actions focus on
Cadeler’s own operations footprint. Cadeler aims to operate its
vessels in compliance with the MARPOL regulation. All vessels have a
shipboard marine pollution emergency plan, which outlines the
practices intended to prevent spills into the ocean. It ensures the
crews are trained to respond appropriately in the event of an
environmental incident and that have the clean-up equipment is
available on board. Cadeler also has a water management plan in
place, under which consumption of fresh water is tracked and any
discharges of ballast water or grey water from the vessels are
recorded.
In 2024, Cadeler has started to use more environmentally friendly
jacking grease on its vessels Wind Scylla and Wind Zaratan acquired
from the merge with Eneti. The vessels operated by Cadeler at that
time were already maintained using this type of jacking grease. This
change reduces the environmental impact of routine maintenance
operations by minimising the release of harmful substances into the
marine ecosystem. The 2025 new built vessels use environmental
friendly jacking grease as well. In addition, Cadeler has performed
patch testing on Wind Peak of hull coatings that are less toxic to
marine organisms, with the objective of identifying solutions that
effectively prevents excessive marine growth, such as algae and
barnacles, which can impair vessel efficiency during sailing.
These initiatives reflect Cadeler’s broader commitment to
sustainability by reducing the discharge of harmful chemicals,
microplastics and grease into the ocean. In the event of marine
pollution caused by oil or NLS, the following actions are already
implemented:
•Shipboard Marine Pollution Emergency Plan (SMPEP) is in
place for each vessel within the Company and contains
information and operational instructions required by IMO,
•Scope is defined in the Pre-amble of the plan. The plan is
designed to be legally compliant and to ensure that the
vessel is prepared in the event of pollution to sea. Section
6.5 of the Plan demonstrates the response to procedures for
spills,
•Onboard there is SOPEP - Shipboard Oil Pollution
Emergency Plan – and SOPEP kit in case of a spill to deck.
The vessel does not carry equipment to contain a spill to
sea
•Regular drills are conducted at to train awareness and
preparedness onboard.
96
Control and reduce air and water pollution
Continued from previous page
Air and Water Pollution Metrics & Targets
_____________________________________________________
E2-3 – Targets related to pollution
Cadeler complies with air emission caps in the locations where it
operates and aims to identify improvements, wherever feasible.
However, improvement beyond compliance levels can be challenging
due to the limits of the technical systems and consumables in use.
Often, in the maritime industry, these components are designed and
manufactured to comply with emission caps, with focus on NOx and
SOx emissions. As such, Cadeler has not established a specific target
related to air pollution in excess of maintaining compliance with
emission caps.
Cadeler is committed to a target of zero spills to the environment, in
accordance with the Company’s policy to minimise its environmental
impact. This target is closely monitored through the Company’s reporting
system, with spill data collected and internally reviewed on a monthly
basis. This target is not time-bound, as Cadeler aims to achieve zero spills
every year. This objective therefore represents an ongoing annual target.
The target is set annually and formally approved by Senior
Leadership as part of the Management Review. Efforts to achieve this
target are supported by initiatives such as improved ToolBox Talks
(TBT), enhanced risk assessments, and the integration of
advancements into the Company’s Management System.
These measures support a proactive approach to spills prevention
and environment protection. Furthermore, Cadeler strives to avoid
objects lost to the sea, recognising the importance of protecting
marine ecosystems and preventing marine debris pollution. In the
event of an object being lost, strict reporting procedures are in place.
If an incident occurs within a wind farm, it is reported to the Marine
Coordination Centre. If it occurs in a port or in national waters, it is
reported to the relevant coastal authorities.
In 2025, Cadeler had emissions to both water and air, which are
presented below.
E2-4 – Pollution of air and water
Cadeler refers to the pollutants listed in Annex II of Regulation (EC)
No 166/2006 of the European Parliament and of the Council. The
main sources of air pollutants are vessel engines and gradual leakage
of refrigerants used as coolants for various machinery on the vessels.
The main sources of water pollutants include gradual degradation of
vessel paint coatings, greywater discharges and potential
uncontained spills of hydrocarbons or other chemicals offshore.
Cadeler does not consider soil pollution to be a material topic as its
operations are primarily focused offshore.
In general, all categories of air pollution increased in 2025, compared
to 2024, for the simple reason that the figures for 2024 only covered
five vessels whereas Cadeler had 9 vessels in operation by the end of
2025. Emissions of particulates and VOCs are expected to increase
proportionally with fuel consumed.
With regard to sulphur oxides, Wind Zaratan and Wind Maker
operated outside emission control areas throughout 2025 and
therefore used fuel with a sulphur content of 0.5%, in line with the
global cap. This contrasts with the remainder of the fleet, which
operated within emission control areas in Northern European waters
and along the east coast of North America and therefore used 0.1%
sulphur fuel.
Additionally, NOx increased by a smaller margin than other pollutant
categories as all new builds need to be delivered in compliance with
the stricter Tier III NOx requirements to newer vessels.
Cadeler recorded 2 spills of hydraulic oils from its vessels in 2025 (vs
4 in 2024). This is a decrease in frequency compared to last year, but
the volume spilled increased due to one more significant spill of
around 1000 litres during a bunkering procedure on Wind Ally in
December 2025. Cadeler has investigated the causes of this incident,
has identified lessons learned, and has updated its vessel bunkering
procedure checklist to try to prevent similar events from occurring in
the future. Cadeler is continuously working on preventing spills to
achieve the target of zero spills.
97
Pollution of air
Air pollutants result from the combustion of fossil fuels during
the operation of vessel engines and project equipment not
relying on vessel engines. It covers Sox, Nox, VOC, particulate
matter and emissions from vessels and equipment. Cadeler
monitors air emissions by recording fuel consumption in the
vessel’s logbooks, and applying emissions factors based on the
fuel and engine characteristics. For VOCs and particulate matter,
Cadeler applies the most recent emission factors published by
the European Environment Agency (EEA). For SOx and NOx,
emissions are calculated using results from engine testing and
fuel sample analyses, ensuring vessel‑specific accuracy.
2025 | 2024 | |||||
Pollutant | Unit | Emissions to air | Emissions to water | Emissions to air | Emissions to water | % change |
SOx | tonnes | 137.2 | 57.1 | 140.1% | ||
NOx | tonnes | 768.8 | 615.1 | 25.0% | ||
Particulates - PM10 | tonnes | 37.7 | 20.8 | 80.9% | ||
Particulates - PM2.5 | tonnes | 32.1 | 17.7 | 80.9% | ||
NMVOCs | tonnes | 65.5 | 36.2 | 80.8% | ||
HFC - 404a | kg | 49.9 | 27.6 | 80.6% | ||
HFC - 410a | kg | 34.6 | 9.5 | 266.1% | ||
HFC - 134A | kg | 235.1 | 1.8 | 12815.4% | ||
HFC- 407C | kg | 490.2 | 197.3 | 148.4% | ||
HFC-407F | kg | 3.4 | 4.4 | -23.6% | ||
HFC-448a | kg | 38.0 | 0.0 | |||
HFC-452a | kg | 15.0 | 0.0 | |||
Uncontained spills | occurrences | 2.0 | 3.0 | -33.3% | ||
Oil spills | kg | 904.5 | 0.6 | 143471.4% | ||
microplastics | kg | 101.4 | 63.6 | 59.4% | ||
Copper compounds | kg | 850.2 | 536.4 | 58.5% | ||
Xylene | kg | 350.1 | 220.9 | 58.5% | ||
Pollution of water
Water pollution from Cadeler’s operations may result from the
slow disintegration of vessel paints, discharges of greywater, and
the potential for direct spills of hydrocarbons or chemicals.
According to IMO’s regulation, Cadeler has a record of all spills
per vessel. All the spills are also reported in HSEQ systems,
specifying their occurrences, quantity and types of pollutants.
Cadeler has no measurements related to pollution from copper,
other metals and microplastics from vessel hull paint and
greywater discharges, so estimations of pollutants levels are
wholly based on available scientific research and paint
specifications.
Microplastics
Microplastics from greywater discharges are estimated using the
volume of greywater generated and applying an emission factor
per cubic meter. Greywater records are not available for every
vessel, so the averages from vessels with available records are
used to fill in for vessels not providing a record. (also based solely
on available scientific research).
98
Enhance circular economy
Impacts, risks and opportunities management
__________________________________________________________
ESRS 2 IRO-1 – Description of the processes to identify and assess
material pollution-related impacts, risks and opportunities
The environmental risk and impact assessment conducted prior to
the commencement of operations primarily focuses on Cadeler’s
installation and maintenance activities, while also taking into account
significant impacts across the value chain. The annual impact and risk
assessment does not cover the construction or decommissioning
phases of Cadeler’s vessels, for which no consultation have been
conducted in 2025. However, in late 2024 and throughout 2025,
Cadeler conducted a lifecycle assessment (LCA) across all vessel
classes to gain a better understanding of the environmental impacts
and risks associated with the construction and decommissioning
phases.
Cadeler conducted environmental risk and impact assessments for its
wind turbine installation and foundation installation operations in
March 2025. The intention is to perform such an assessment at least
annually, and the starting point is the result from past years. The
assessment is intended to cover all environmental aspects, including
resources and circular economy.
Continuing with business as usual may entail certain risks and impacts
that Cadeler still needs to assess. Some of these risks are evaluated
through the climate-risk impact assessment. Cadeler will provide
further details on ESG risks and impacts in upcoming reports.
Cadeler has not yet assessed whether the use of recycled steel or the
standardization of seafastening could represent a material
opportunity, nor whether the transition to a circular economy could
give rise to material risks and impacts.
Waste production and management
_____________________________________________
E5-1 – Policies related to resource use and circular economy
A core element of environmental management on board the vessels
is the waste management plan. Each vessel has its own plan which is
based in the Company’s general plan and in alignment with the
International Maritime Organisation’s MARPOL Annex V. Cadeler
records its total waste production and requires proper segregation of
waste onboard so that it can be appropriately managed when
offloaded on the quayside. Cadeler will continue its efforts to avoid
single-use plastics wherever suitable alternatives can be identified
and will also expand its to all waste categories. Cadeler intends to
place a greater emphasis on reducing waste generation from its
operations and supply chain and to increase efforts to ensure the
recycling and reuse of waste wherever possible. In 2025, Cadeler
drafted its first circularity strategy, which is supported by a three-year
implementation roadmap, including specific actions and
commitments. The strategy focuses on key actions towards improving
waste management methods, developing vessel end of life plans, and
taking a higher control of garbage management contracts.
Consider end of life for assets and project equipment
___________________________________________________________________
E5-1 – Policies related to resource use and circular economy
It is important that Cadeler identifies solutions for the eventual
recycling and reuse of components from its vessels and major
components used for operations, such as sea fastenings. Cadeler
considers whether a second life can be identified for key components
and will investigate how to ensure that any recycling activities are
carried out in a responsible manner. Moreover, as it enters the
foundation installation segment under certain contracts, Cadeler
expects to gain responsibility for the design and delivery of
secondary steel structures that serve as the connection point
between offshore wind turbines and the monopiles on which they are
installed. Cadeler commits to investigating, alongside its clients, how
these structures can be designed and delivered with a reduced
environmental footprint. Cadeler’s Sustainability and Performance
Department is responsible for implementing the sustainable
development policy across the business, including its commitment to
minimising the use of resources and working towards a circular
economy.
99
Enhance circular economy
Continued from previous page
Resource use metrics & targets
_______________________________________
E5-2 – Actions and resources related to resource use and circular economy
Cadeler’s past actions related to resources uses and the circular
economy had been focused on the Company’s own operations but
Cadeler’s updated circularity strategy includes actions across its
supply chain as a key factor for success. Cadeler’s standard vessel
waste management plan was updated in 2024 to emphasise the
Company’s preference for reducing consumption wherever possible,
followed by prioritising reuse and recycling of materials over disposal.
The updates are included in the vessel specific plans for all newbuilds
and will be applied to existing vessels following the next revision of
the waste management plan. 2024 represented the first year in which
waste transfer notes from all vessels have been collected to measure
the total waste footprint, and waste data from all offices have been
procured from waste management provider. This enabled Cadeler to
finally establish its baseline which will allow the Company to start
reporting on progress towards its 2030 reduction target. Cadeler
used the same collection process in 2025.
In 2023, safe drinking water systems were installed on Wind Orca and
Wind Osprey, enabling the elimination of single-use water bottles for
offshore operations. All of Cadeler’s custom designed newbuild
vessels have been delivered with similar systems, and the Company is
currently investigating the implementation of this type of system on
Wind Scylla, Wind Zaratan, and Wind Keeper without a final decision
taken. These systems are considered a core element in reducing
waste from the vessels and cover a large fraction of the potential
single-use plastics footprint. At present, 7 out of 10 operating vessels
are equipped with safe drinking water systems onboard.
Cadeler has developed its first strategy on resource use and
circularity in 2025. The ambition is to make more impactful changes
to the Company performance going forward, now that a more robust
performance baseline has been established.
E5 – 3 - Targets related to resource use and circular economy
By 2030, Cadeler aims to reduce its waste generated from its own
operations by 50%. It intends to achieve this target by avoiding waste
generation where possible and improving recycling and reusing rates.
This target is not driven by legislative requirements. 2024 represents
the first year in which Cadeler has tracked its full Company waste
footprint, including waste treatment methods, and will therefore be
used as the baseline for improvement.
As Cadeler continues to experience a high rate of growth, it is
necessary to normalize its targets to account for this growth. In 2024,
Cadeler had five vessels in operation by the end of the year. In 2025,
this number rose to 9. For this reason, Cadeler has decided to also
start looking at environmental footprint in terms of impact per vessel
in the fleet.The new targets for waste directed to disposal should be
approved during 2026.
Cadeler has yet to define formal targets for resources inflow, but the
Company acknowledges the importance of setting targets on the
matter, as its business activities involve a material resource inflows, as
described under ESRS 2 SBM-3. Cadeler will therefore work towards
establishing formal targets in accordance with its strategy.
100
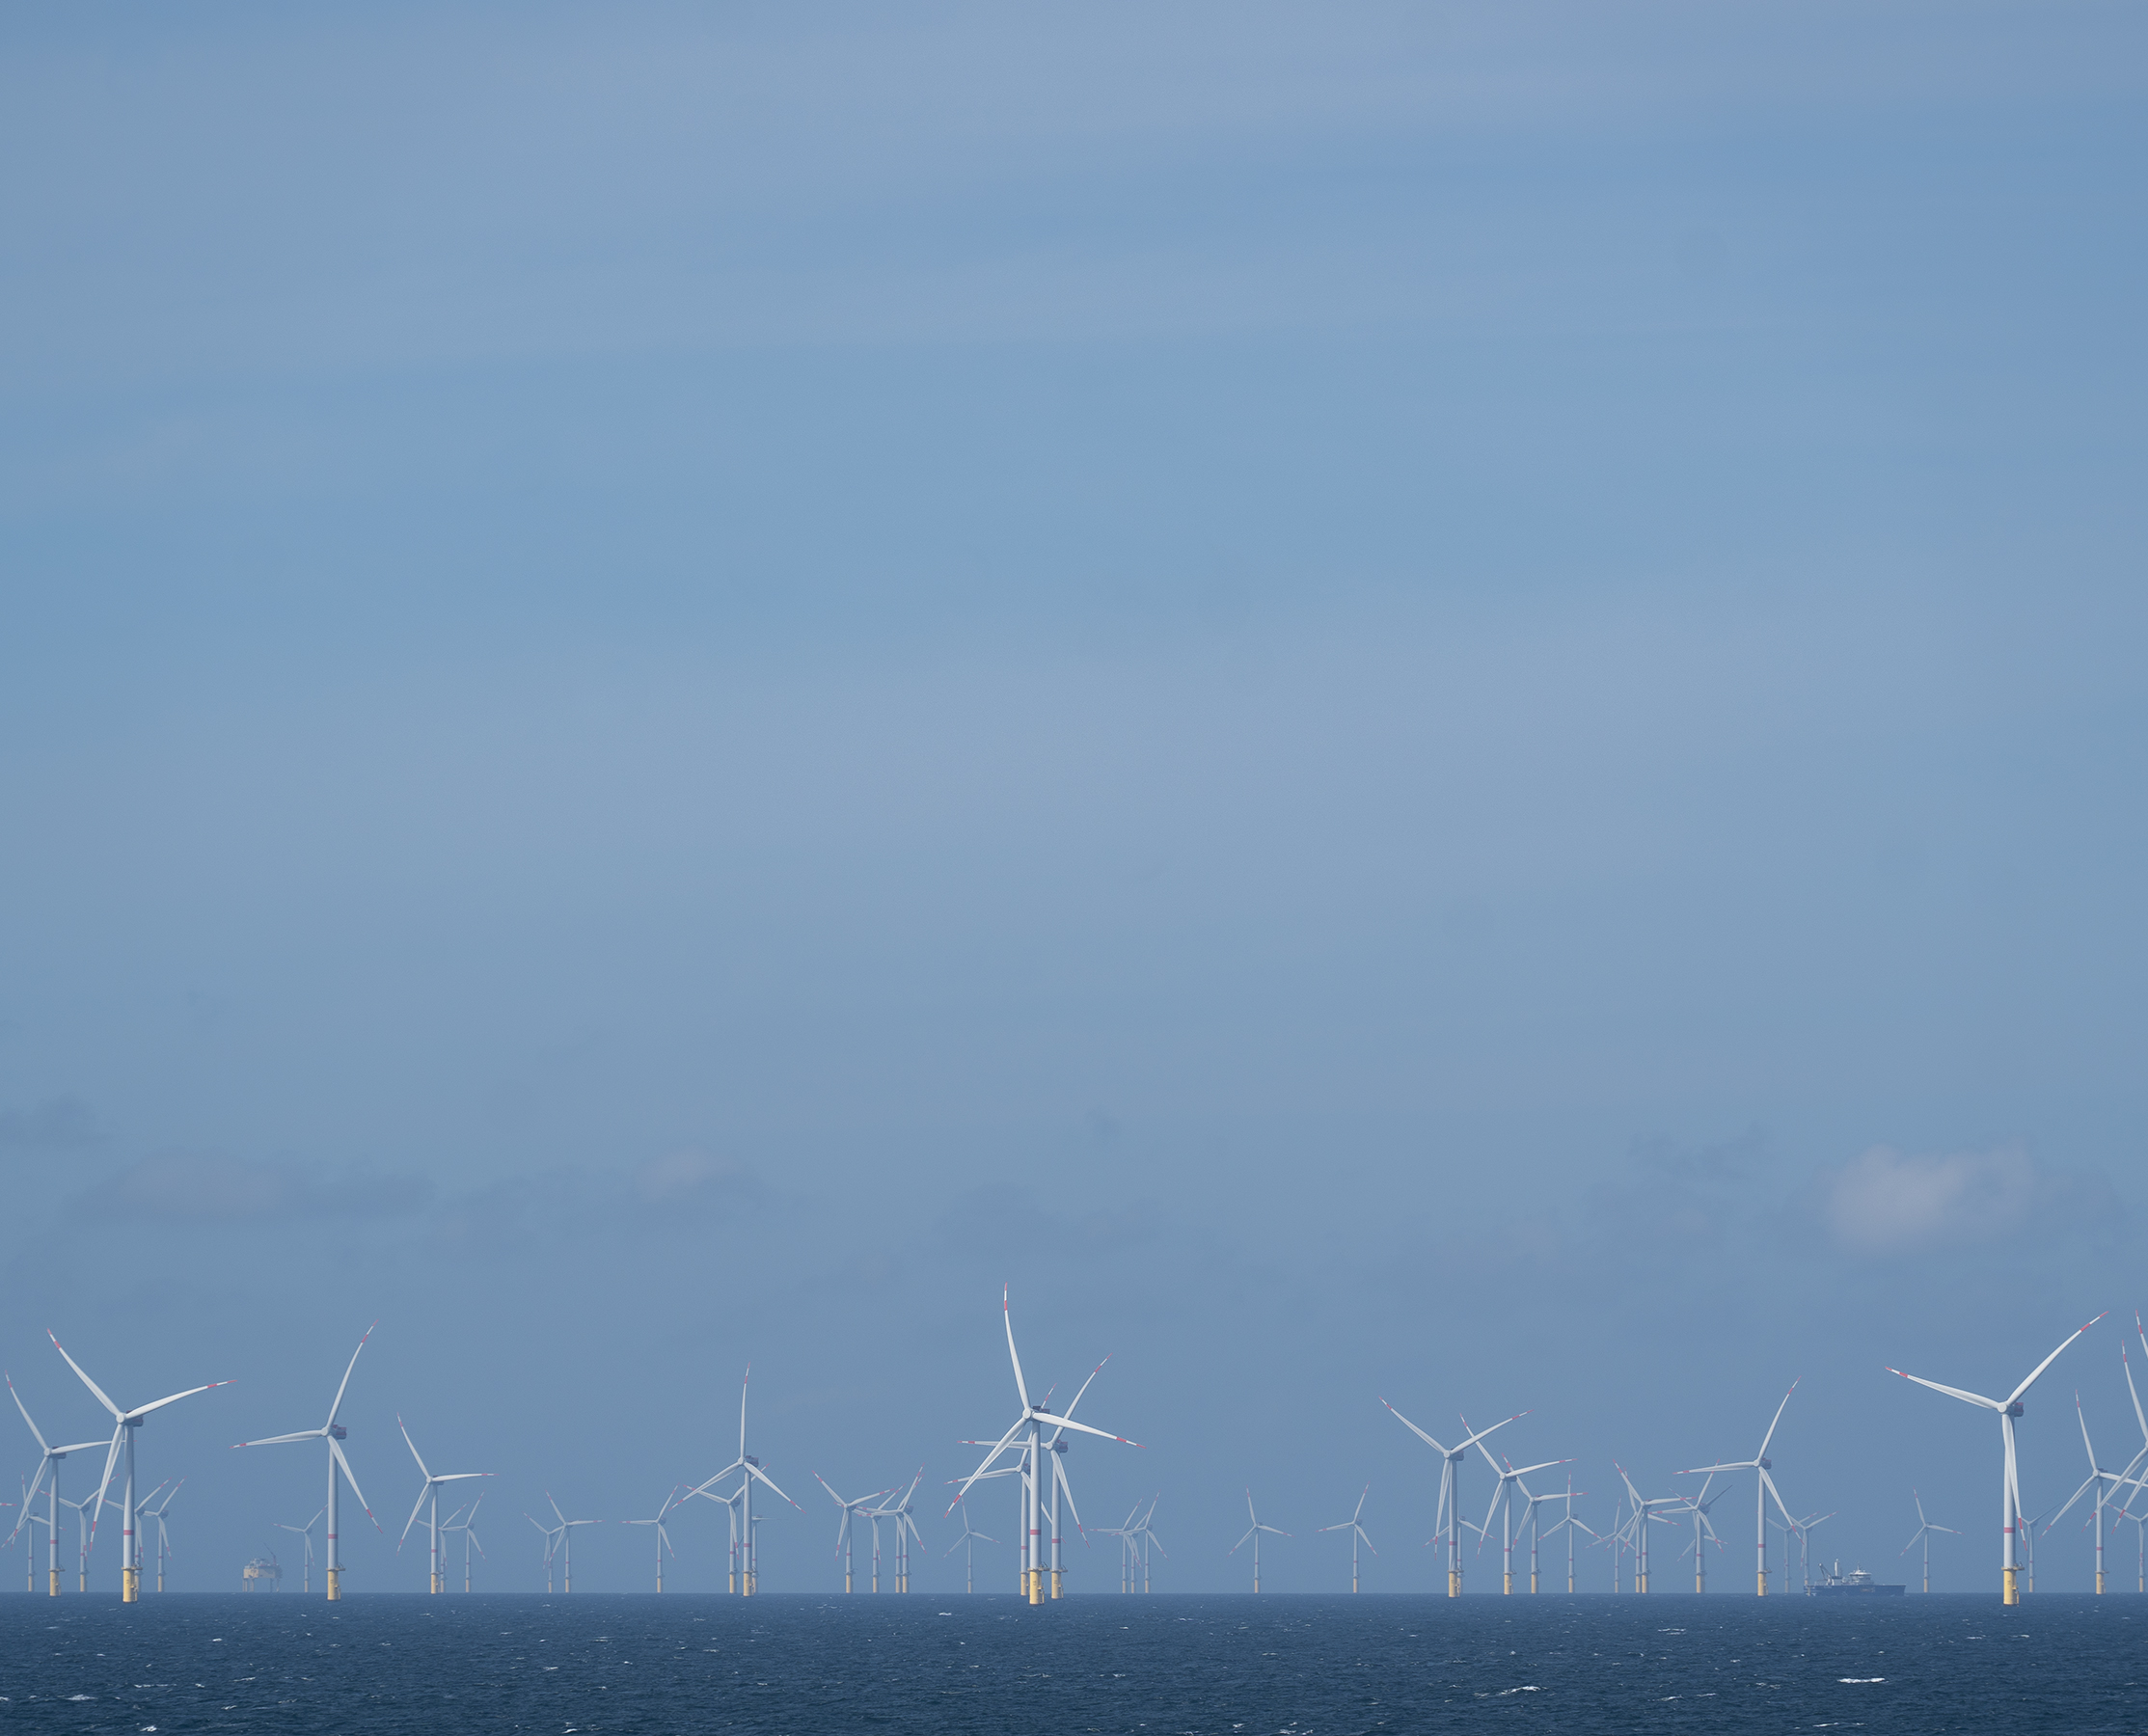
Enhance circular economy
Continued from previous page
E5 –4 - Resource inflows
Cadeler’s IRO focuses on the accessibility to materials used for the production of vessels and equipment
required for delivering the services for the customers. Hence, the material impact/resource inflow is placed
in the value chain, as all vessels and required equipment is produced by vendors in the value chain.
Consequently, Cadeler will not report on the inflow-section of E5.
E5 –5 - Resource outflows
Cadeler tracks waste outputs from both its vessels and offices. There are some limitations in Cadeler’s
datasets which will be addressed on in the coming years. First, the Company’s vessels segregate waste
onboard into more categories than the standard waste transfer notes provide a record for and record
outputs in cubic metres. This is in accordance with IMO MARPOL requirements, so it may be difficult to
improve data precision as the vessels must continue to operate in accordance with MARPOL.
One example is that Cadeler’s vessels generate various categories of hazardous waste which are handled
properly and delivered onshore in hazardous waste containers. However the waste transfer notes Cadeler
receives from onshore waste management providers tend to categorize this data under ‘operational waste’
along with other waste streams that may not be hazardous. For the reporting year, Cadeler has taken a
conservative approach and classified all operational waste as hazardous as this category includes potentially
hazardous waste.
In assessing waste treated methods, Cadeler has not been able to obtain documentation from every port
and waste management service provider regarding the waste treatment methods implemented. Waste has
only been claimed to be ‘diverted from disposal’ where supporting documentation has been available. It is
likely that a higher volume of waste than reported has been diverted from disposal, but Cadeler will not
report this until sufficient documentation can be obtained.
As part of its Circularity Strategy, Cadeler plans to improve its contact with the waste management providers
in the Company’s value chain. This requires a stepwise improvement in the dialogue with garbage
management providers.
101
Enhance circular economy
Continued from previous page
Unit | 2025 | 2024 | |
Hazardous waste | tonnes | 114.0 | 96.5 |
Preparation for reuse | tonnes | - | - |
Recycling | tonnes | 1.1 | 1.8 |
Other recovery operations | tonnes | - | |
Diverted from disposal | tonnes | 35.6 | 1.8 |
Incineration | tonnes | 10.1 | |
Landfill | tonnes | 78.5 | - |
Other disposal operations | tonnes | 84.6 | |
Directed to disposal | tonnes | 78.5 | 94.7 |
Non-hazardous waste | tonnes | 559.3 | 286.5 |
Preparation for reuse | tonnes | - | - |
Recycling | tonnes | 84.6 | 24.5 |
Other recovery operations | tonnes | 100.1 | 32.1 |
Diverted from disposal | tonnes | 184.7 | 56.6 |
Incineration | tonnes | 49.9 | 38.8 |
Landfill | tonnes | 324.7 | 6.5 |
Other disposal operations | tonnes | 184.6 | |
Directed to disposal | tonnes | 374.6 | 229.9 |
Total waste | tonnes | 673.3 | 383.0 |
Diverted from disposal | % | 32.7% | 15.3% |
Directed to disposal | % | 67.3% | 84.8% |
Diverted from disposal | tonnes | 220.2 | 58.4 |
Directed to disposal | tonnes | 453.1 | 324.6 |
Resources outflows
Data is collected through external information from waste
handlers and waste transfer notes from vessels and offices. When
the information was not available, only relevant to offices, the
Company performed an average calculation proportional to
headcounts. Uncertainty arises in the data due to conversion of
some data inputs from liters and m3 to tons. Cadeler used
conversion factors published by the US Environmental Protection
Agency.
Conservative approach: operational wastes are categorised as
hazardous as the category can include hazardous waste, but
there is not a consistent record of what percentage of
operational wastes are hazardous. Additionally, not all waste
management providers share a record of disposal methods.
Where missing, Cadeler assumes waste ends in a landfill.
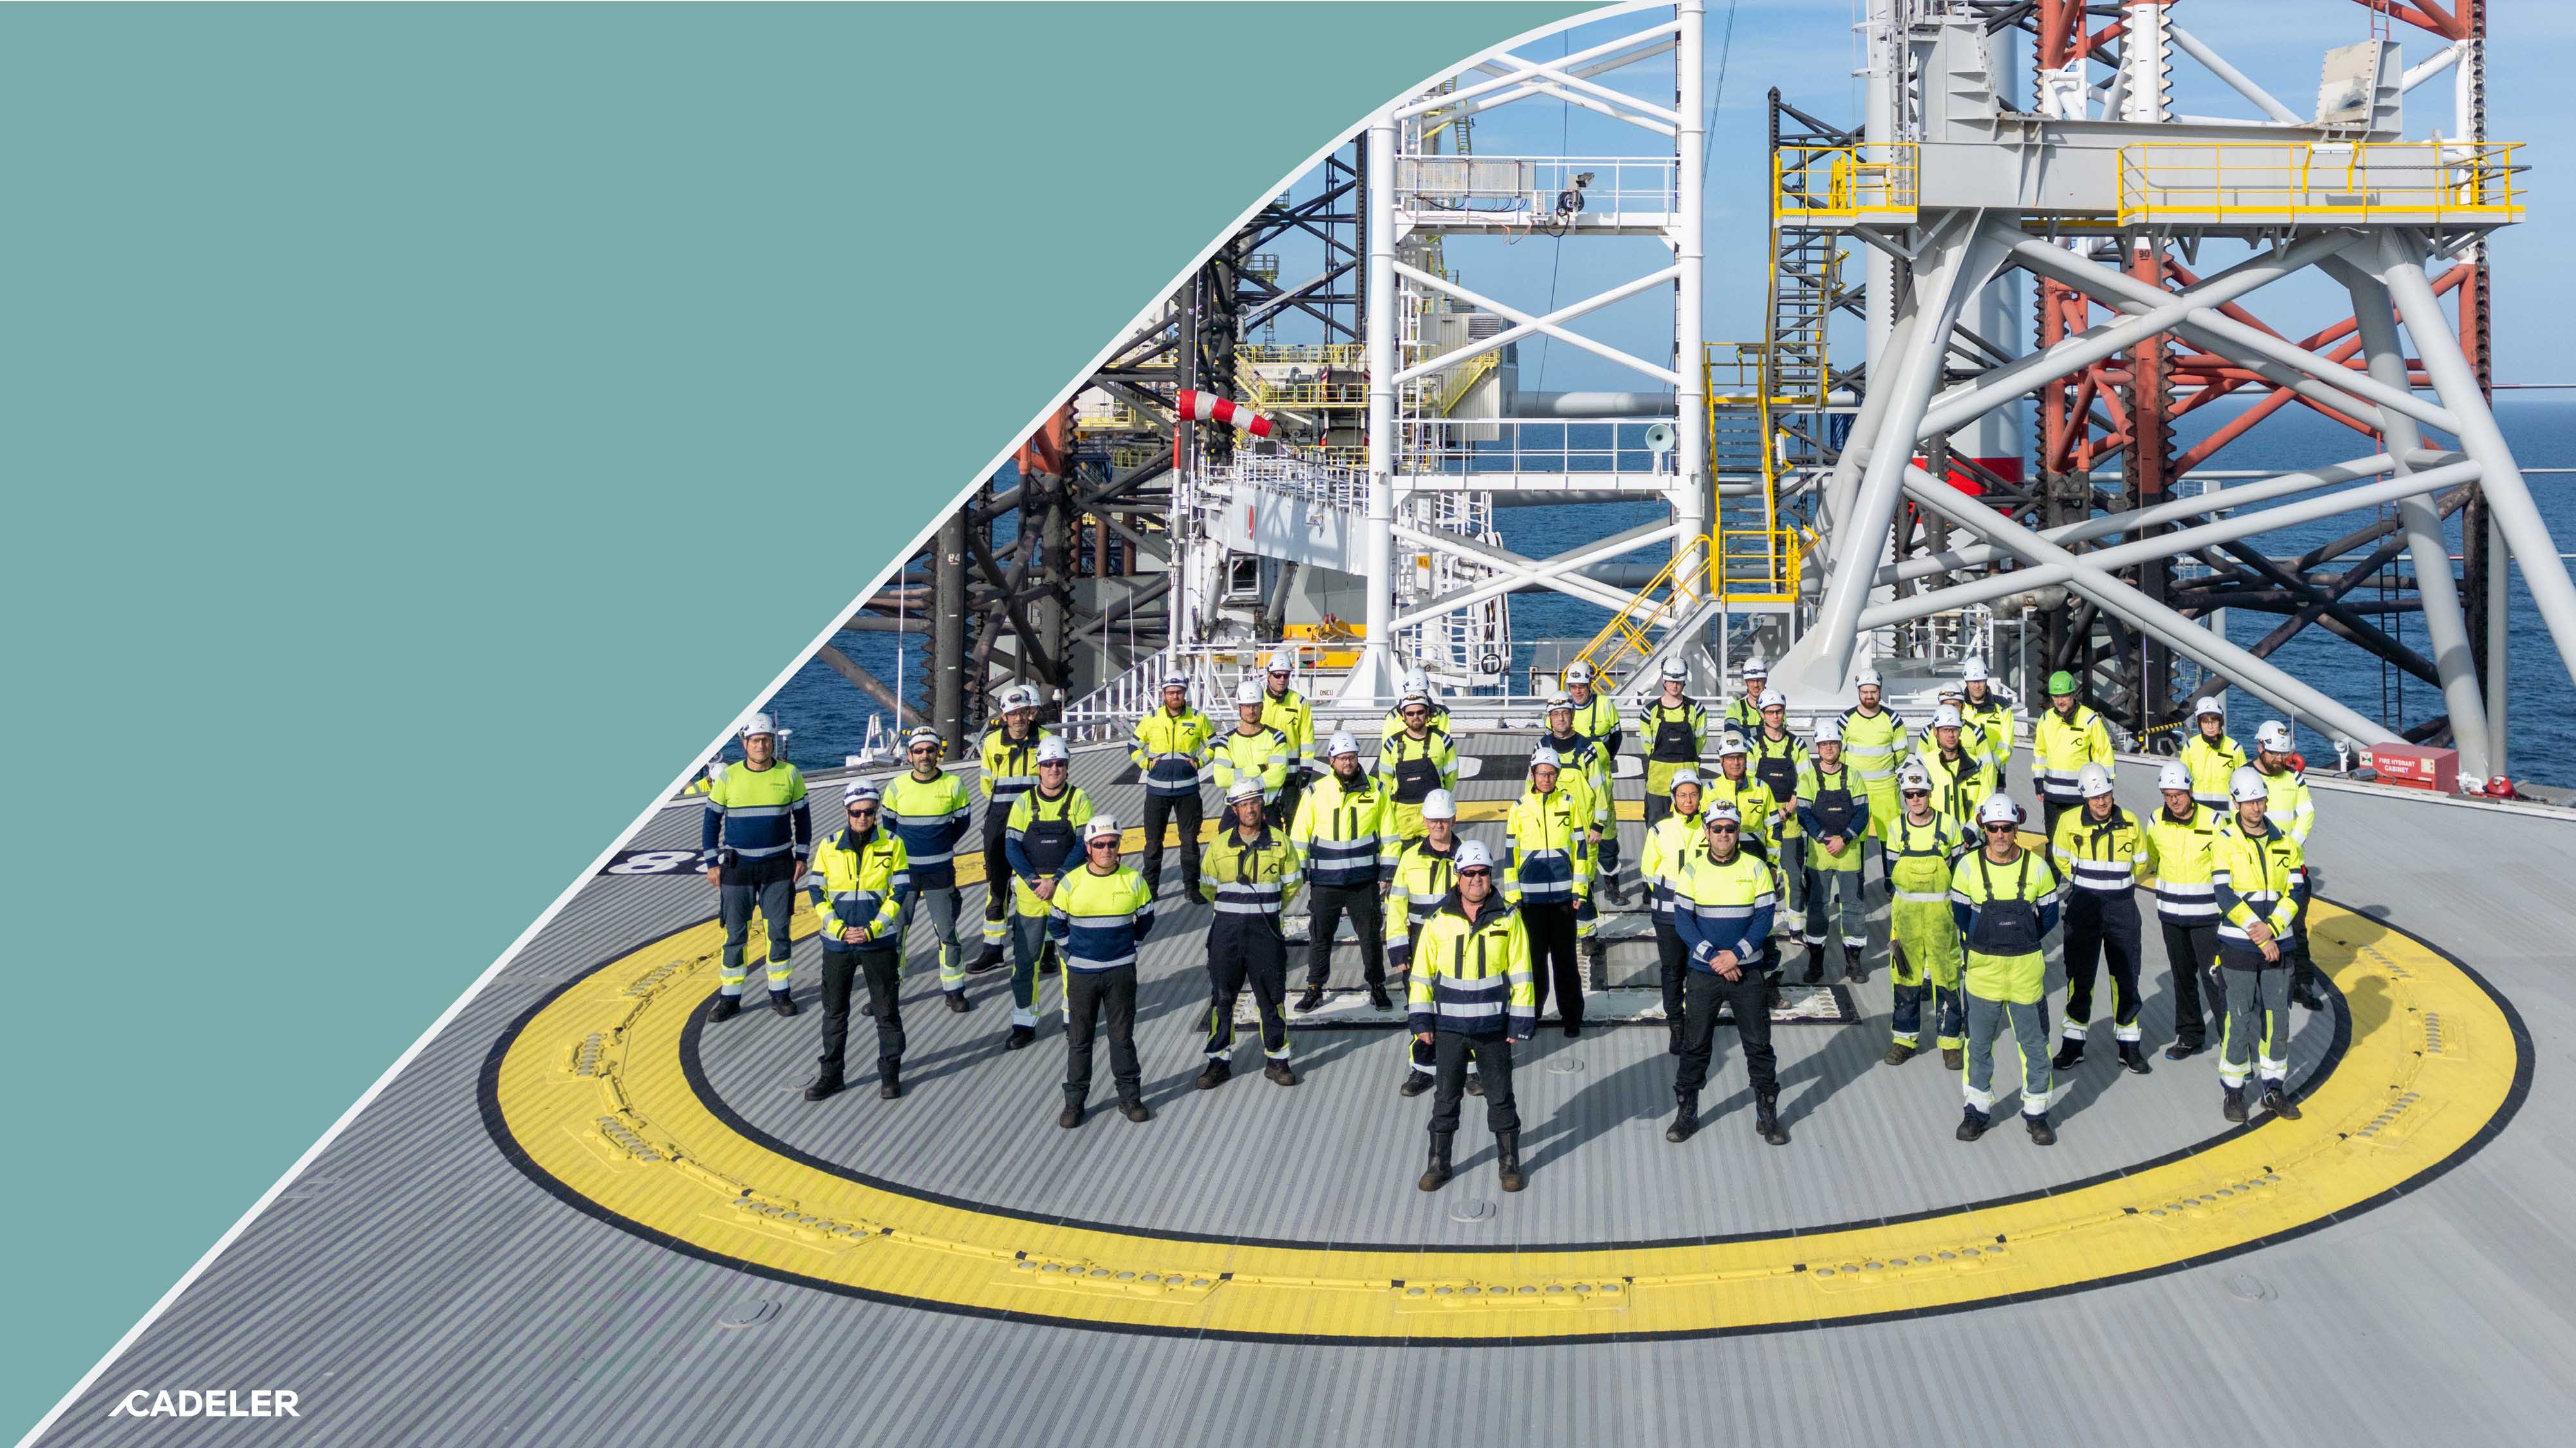
102
Social
103
Management of the own workforce
Strategy around Cadeler workforce
____________________________________________
ESRS 2 SBM-3 – Material impacts, risks and opportunities and their
interaction with strategy and business model
People are at the heart of Cadeler’s priorities, driving the Company’s
success. Cadeler believes in operating in a way that fosters a safe,
diverse, inclusive and equitable workplace environment for its
employees, while driving a positive impact beyond Cadeler. Health
and Safety, Privacy, Diversity, Gender Equality and Equal Pay for work
of equal value, Work-life balance, Social Dialogue, Freedom of
association, and Collective Bargaining are topics that may affect
onshore teams, offshore teams or both. If any of these topics is
considered material for either group, Cadeler includes all employees
within the scope of disclosure:
•Onshore locations include offices in Denmark, the United
Kingdom, Taïwan, Japan, the US and Monaco
•Offshore locations include all vessels.
All individuals who may be materially impacted by Cadeler’s
operations are included in the scope of disclosure. Material negative
impacts related to Health and Safety may occur on an individual basis
whereas material negative impacts related to Privacy, Diversity and
Gender Equality tend to be more widespread. Cadeler invests
significantly in making the Company a high-quality workplace. The
corporate culture has a positive impact on all employees, both
offshore and onshore, particularly in terms of Work-life balance, Social
Dialogue, Freedom of association, Collective bargaining and Diversity.
Cadeler identified a limited number of material risks and opportunities
arising from impacts and dependencies on its own workforce:
•Risk: the occurrence of any significant HSEQ incidents could
negatively impact Cadeler’s brand and the confidence
among potential clients and investors in Cadeler’s ability to
deliver its scope of work while protecting its workforce
•Risk: the occurrence of any incidents of harassment and
discrimination within the workforce could to negatively affect
Cadeler’s brand, affect employee retention rates and its
ability to recruit new colleagues.
To close the gap towards net-zero operations by 2035, Cadeler is
focusing on optimising fuel consumption, adopting alternative fuels
and enabling electrification. The potential impact on workers of these
three key decarbonisation levers has not been assessed yet, but are
currently assumed to be non-material.
Cadeler with the assistance of a third party, has performed a Human
Right Impact Assessment which reviewed and informed the Company
on specific risks faced by people in the workforce with particular
characteristics, or working in particular activities and contexts. This
assessment focused on potential impacts and risks to workers across
Cadeler’s business as well as across Cadeler’s value chain. Cadeler will
conduct this assessment every three years.
While health and safety are relevant to all employees, offshore
employees are the most exposed to such risks due to their work on
industrial sites, including ports and vessels. Regarding potential
incidents of harassment, they are not limited to any specific group.
Working in Cadeler: onshore and offshore positions
_________________________________________________________________
S1-1 – Policies related to own workforce
Working conditions
Cadeler operates with the objectives of ensuring safety at sea,
preventing human injury and loss of life, and avoiding adverse
impacts on the environment. The safety management objectives of
Cadeler remain focused on defining safe practices for vessel
operations by controlling all identified risks to the Company’s ships,
personnel and the environment, and establishing appropriate
safeguards. Cadeler’s commitment to ensuring employee health and
safety are articulated in the i) Code of Conduct, ii) Health, Safety,
Environment and Quality Policy, and iii) Human Rights Policy. These
policies build upon and align with internationally recognised
frameworks (ILO, International Bill of Human Rights,UN Global
Compact, UN Guiding Principles on Business and Human Rights).
Cadeler believes that all employees contribute to maintaining a safe
working environment and therefore operates an intervention policy.
Every individual at a Cadeler worksite has the authority and the
responsibility to intervene in any job, activity or scenario where there
is a safety concern. Concerns can be raised through the channels
described in G1-1 by all individuals, and third parties present at its
workplaces worldwide. They are all required to observe all applicable
legal requirements relating to occupational health and safety
standards.
104
Management of the own workforce
Continued from previous page
Another cornerstone for improving employee working conditions is
guaranteeing the right to freedom of association. This includes the
right of employees to join or form groups, such as unions, and to
collectively advocate for shared interests. At Cadeler, this freedom
allows employees to join labour unions or professional associations to
represent their rights, negotiate better working conditions and fair
wages, and to promote workplace safety. Cadeler’s policies on
working conditions apply to all employees and contractors, both
onshore and offshore.
While Cadeler does not yet have a Supplier Code of Conduct that fully
align with the ILO, it recognises the importance of these issues and is
working to expand its framework. In the meantime, the Company
continues to apply other measures, such as supplier assessments and
contractual requirements, to promote responsible practices and
safeguard workers across the value chain.
Equal treatment and opportunities for all
Cadeler is committed to fostering a diverse and inclusive workplace,
and has a policy underscoring this commitment, emphasising equal
opportunities for all employees to succeed and acknowledging that
people start from different places. By actively promoting equality, the
Company fosters an environment enriched by diverse perspectives,
including race, gender, sexual orientation, religion, age, national origin
and more. Recognising that these unique qualities drive innovation
and growth, Cadeler emphasises diversity, equity and inclusion as
essential for thriving in a global market and advancing social
sustainability. This policy extends to all employees and contractors,
with encouragement for business partners to uphold similar values. To
understand progress and continually improve working conditions for
employees, Cadeler tracks work-force data including management
levels, workplace locations, contract types and diversity metrics like
gender.
Cadeler cultivates a diverse and inclusive working environment
fostering a sense of belonging. To do so, Cadeler recognises that all
employees are unique and valuable, and Cadeler respects everyone
for their individual abilities and qualities. Cadeler sees Diversity, Equity
& Inclusion (DEI) as an integral part of its culture and identity, and
Cadeler celebrates being a multi-national, multi-cultural and LGBTQ+
inclusive organisation. In developing its approach to its employees,
Cadeler has considered the following potential identities that may
distinguish the specific needs of individuals within its workforce. The
characteristics considered includes but are not limited to race,
ethnicity, nationality, gender/gender identity, sexual orientation, age,
political and religious beliefs, physical abilities, and socioeconomic,
marital or pregnancy (including maternity or paternity) status.
Cadeler is unwavering in its commitment to treating all individuals
with dignity and respect, fostering a workplace that champions
diversity and inclusion while opposing any form of discrimination or
harassment. This also means that employees are expected to treat
each other with respect and contribute to a positive work
environment. Cadeler believes that everyone has the right to work in
an environment that contributes positively to employees’ health,
psychological safety and well-being. This ambition includes fostering a
safe, inclusive workplace where all individuals can work without facing
discrimination, harassment or bullying. Cadeler aims to maintain an
inclusive workplace with zero tolerance for discrimination, harassment
or bullying and has a policy underscoring this focus. The policy
underlines that it is the responsibility of employees to foster a
supportive work culture. Those who witness or experience
discrimination or harassment are urged to report incidents through
Cadeler’s confidential channels or other appropriate means.
Any unacceptable conduct should be reported to line managers or
business unit heads. In cases of unwanted behaviour, Cadeler is
committed to addressing all reports seriously and ensuring
confidentiality. Records of reports and outcomes are stored securely
and confidentially. Consistent enforcement of the policy is essential,
with timely and thorough investigations for both reporters and
respondents. Support and appropriate workplace accommodations
will be provided for those affected by incidents of discrimination,
harassment or bullying.
If Cadeler identifies that it has caused or contributed to a significant
adverse impact on people — including impacts on human rights —
the Company acts promptly and responsibly to provide or support
appropriate remediation, in line with the UNGPs and relevant OECD
due diligence guidance. The approach to addressing concerns and
grievances across our value chain is founded on transparency, trust,
and effective remediation that is proportionate to the issue at hand.
Cadeler engages affected stakeholders in identifying suitable remedy
options and keep them informed throughout the process, including
on progress and outcomes. For workers in the value chain, the
Company collaborates closely with suppliers to implement necessary
corrective actions, providing guidance and resources to help address
and resolve identified issues.
Other work-related rights
Cadeler respects the privacy and personal data of all individuals,
including its employees and those the Company does business with,
and is committed to complying with global data protection and
privacy laws and regulations, including the EU General Data Protection
Regulation (GDPR). The policies are made available to all employees
and are mandatory reading upon commencement of employment.
The policies are reviewed periodically, approved by Senior Leadership
Team and have a designated department responsible for enforcing
and monitoring their implementation of the policies.
105
Management of the own workforce
Continued from previous page
Cadeler’s engagement towards its workforce
_________________________________________________________
S1-2 – Processes for engaging with own workforce and workers’
representatives about impacts
Engaging with Cadeler’s own workforce is a key element in identifying
and developing initiatives and tools to improve working conditions at
Cadeler. Engagement takes place at an organisational level through
various channels, including virtual platforms, workplace assessments,
committees and ongoing feedback between employees and
managers. Depending on the channels or in the event of a significant
change, engagements may be conducted every three years, annually,
or on a rolling basis.
Cadeler has employee handbooks and designated sharepoint sites for
both onshore and offshore colleagues. The handbook outlines
expectations of employees as well as the formal rules that apply in a
number of essential areas. The purpose of the handbook is to provide
information, rules and guidelines related to a wide range of topics and
areas (including information about the organisation, safety-related
information, Cadeler care programme, development and policies, and
Speak Up! channels) that Cadeler’s employees may encounter in their
day-to-day work. For information on Cadeler’s confidential reporting
channels (Speak Up!), see section G1-1.
There are a number of HSEQ-focused initiatives in place to improve
worker representation and visibility to management as well as to
enhance the Company’s focus on safety culture. These initiatives are
designed to have a positive impact on safety performance and include
safety representatives elected from among the O-class, P-class and A-
class workforce, safety coaches appointed by the Company onboard
S-class and Z-class vessels, quarterly meetings with the COO and
Head of HSEQ, OHS meetings, and the Speak Up! and well-being
hotlines. Cadeler has also established an Occupational Health & Safety
Committee for all office employees globally. Onboard the vessels,
safety representatives and safety coaches are available to support the
employees with any questions related to safety and the work
environment.
Cadeler has a reporting system for observations enabling employees
and external personnel to share perspectives and allows onshore
team to be informed and make decisions and improvements taking
these perspective into account. These observations and actions are
tracked in the system and discussed daily between onshore and
offshore teams. Cadeler also has a Masters review process through
which the vessel Master comments formally on a wide range of topics
related to Company operations particularly regarding the safety
management system. Onshore management reviews and responds to
this input. In addition to this regular and open communication system
between offshore and onshore teams, the organisation has
established processes to gather feedback from new employees within
three moths after their onboarding to identify areas for
improvements. The Company also implemented exit interviews with
employees who voluntarily leave the Company. Cadeler also promotes
a Wellbeing Hotline, offers annual health checks, and communicates
about the whistleblower platform to ensure that all employees—
including those who may be vulnerable to impacts and/or
marginalized—have the opportunity to share their perspectives. Last
but not least, in 2025, the Company invited employees for questions
to the CEO which have been addressed to in a series of
communications to all employees. Cadeler uses employee
engagement surveys to assess how the employees experience their
work environment and organisational culture. Engagement levels are
evaluated based on response rates and overall scoring, and results are
compared with previous years and relevant benchmarks. Insights from
survey responses and comments enable Cadeler’s management to
understand engagement trends and identify areas where initiatives
are effective or where further action is needed.
106
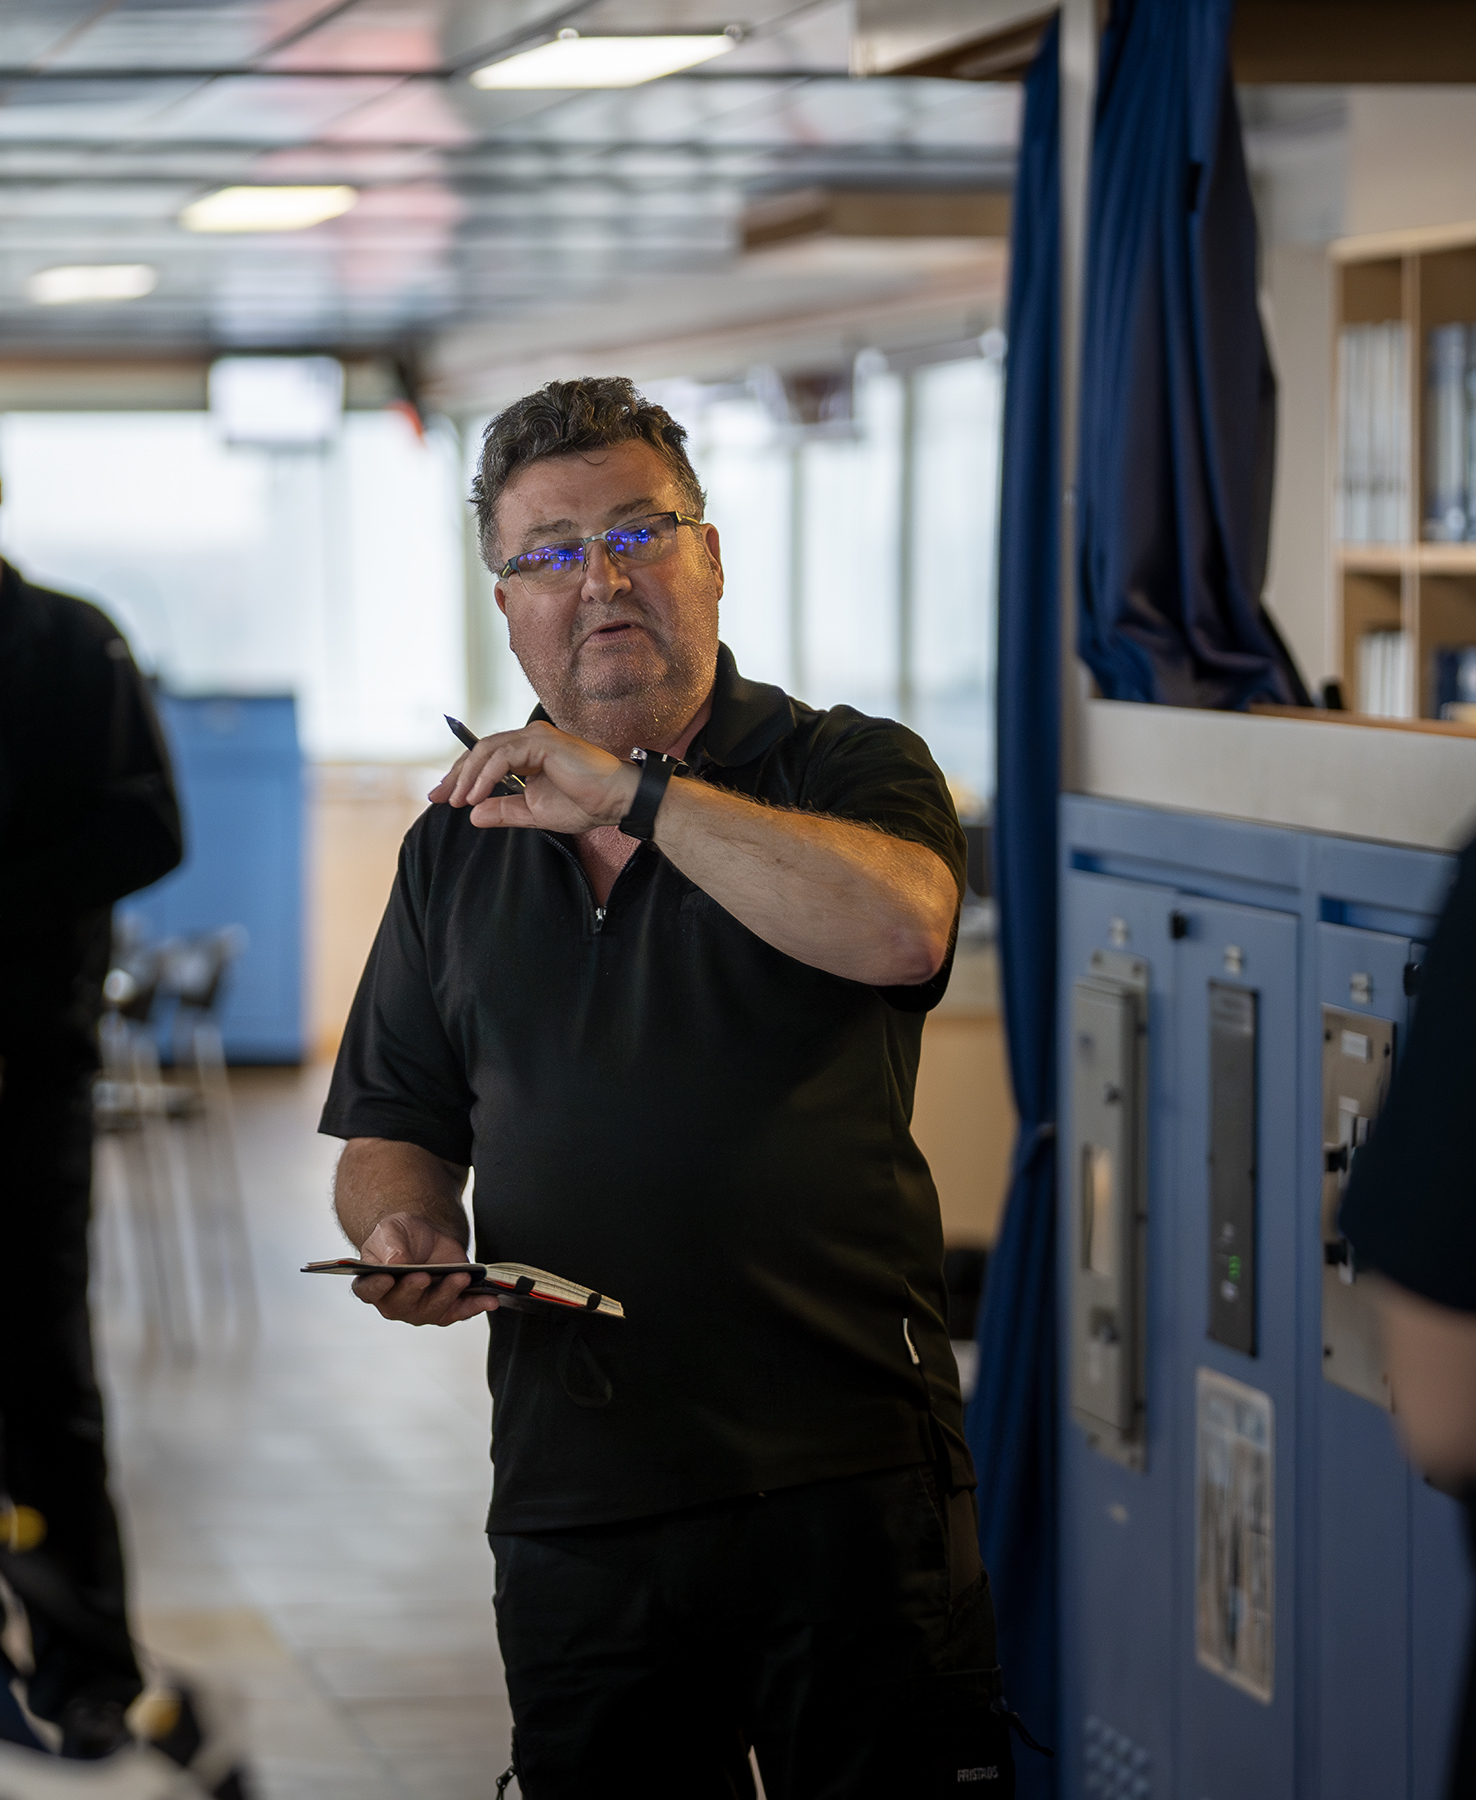
Management of the own workforce
Continued from previous page
Responsiveness at the core of the system
____________________________________________________
S1-3 – Processes to remediate negative impacts and channels for own
workforce to raise concerns and processes for engaging with own
workforce and workers’ representatives about impacts
Acknowledging the risk of negative impacts, Cadeler has established
channels for its workforce to raise concerns and partnerships with
unions to stay informed about such issues. Cadeler’s confidential
reporting channel, including related awareness and communication
activities, is further described in section G1-1, Business Conduct.
As referenced in S1-2, Cadeler performs a recurring Workplace
Assessment. These not only seek to gain feedback on the physical
parameters of a safe work environment, but also gather feedback on
parameters influencing the mental and psychological safety of
Cadeler’s employees across locations. The assessment is conducted
every three years, as required by law or when significant changes
occur, and supports the remediation of any negative impacts by
creating awareness of them and allowing for the development of
targeted initiatives. To ensure coverage of perspectives from the
entire workforce, the assessment is distributed to all employees both
onshore and offshore, on a recurring basis. As required by UK law
following office relocation, Cadeler is conducting new visual display
unit assessments and taking action as required.
Annual appraisals are held for all offshore employees alongside
continuous dialogue between line managers and employees
regarding employee development and well-being. On the onshore
side, the leaders are encouraged to regularly check in with their team
to share insights, concerns and identify any potential negative
impacts. At the onshore team level, the leader is encouraged to
continuously track the progress of team initiatives set annually within
the OKR framework. This is the responsibility of the leaders to provide
ongoing feedback to team members to support collaboration and
well-being across the team, and are also encouraged to regularly
check in with their team members on an individual basis. This is also
an opportunity to check in on well-being and discuss development
opportunities for the individual.
Support and appropriate workplace accommodation will be provided
for those involved in incidents of discrimination, harassment or
bullying. Consistent enforcement of the policy is essential, with timely
and thorough investigations for both reporters and respondents.
Finally, Cadeler has a strong focus on collaboration with unions, as
they also constitute a central stakeholder with which employees can
raise any concerns. Offshore employees under DK flag are employed
under collective bargaining agreements which, together with local
laws and internal rules, secure the rights and working conditions of
Cadeler’s employees. The Company has an ongoing dialogue with
union representatives onboard its vessels to find common and
sustainable solutions to topics like cooperation, development, work
environment and health and safety.
Regardless of the channel used for providing feedback to Cadeler,
employees are informed about the process and made aware of their
rights when raising concerns.
Cadeler’s does not have a universal response for providing remedy
should incidents occur, instead, it currently handles incidents on a case by
case basis. To support this approach, the organisation ensures that
adequate resources are available to investigate and act upon any
incidents raised. An E&C Manager is in charge of addressing concerns
and preventing future incidents. Cadeler’s onshore and maritime HR
departments, comprising 30 full-time employees, are responsible for
ensuring employee safety and well-being whenever such incidents occur.
107
Management of the own workforce
Continued from previous page
Engaging with the workforce
____________________________________
S1-4 – Taking action on material impacts on own workforce, and
approaches to managing material risks and pursuing material
opportunities related to own workforce, and effectiveness of those
actions
Working conditions
Cadeler’s highest priority remains the health and safety of the
individuals on board its vessels and in its offices. The Company
believes that all incidents are preventable and that everyone should
leave Cadeler worksites in the same condition
than when they arrived. Consequently, the Company continuously
works to improve its health and safety processes. However, even the
strongest procedures and compliance with all requirements are not
always sufficient to create a healthy and safe environment.
Consequently, Cadeler seeks to go beyond compliance with industry
safety standards and embed a culture of safety that drives the
behaviour and attitude of every individual to continuously improve
health and safety performance.
Cadeler considers that all employees contribute to the maintenance of
a safe working environment and operates an intervention policy. Every
individual at a Cadeler worksite has the authority and the
responsibility to intervene in any job, activity or scenario where there
is a safety concern. A culture of safety is cultivated through Cadeler’s
four Safety Drivers, which emphasise that everyone at Cadeler are
safety ambassadors and which promote:
•Influence: “I take ownership of my own safety; I look out for
colleagues, clients and contractors and help them to stay
safe; I promote a good feedback culture; I share experience,
knowledge and best practice”,
•Intervention: “I stop the work if the task deviates from the
plan; I intervene if I see any unsafe conditions or acts; I
appreciate it if someone intervenes in the way I perform my
work; I promote an open culture where a mistake is a
learning opportunity”,
•Improvement: “I take ownership of the implementation of
improvements; I look and think ahead; I use learnings from
similar tasks; I report improvement proposals”,
•Insight: “ I understand the risks associated with the job and
act accordingly; I ensure that risk assessment is part of any
work process; I ask when in doubt; I continuously search for
safety improvements.”
Cadeler’s safety management system promotes safe operations by
ensuring compliance with mandatory rules and regulations across
relevant international jurisdictions and flag state legislation. DNV and
Lloyds Register have audited and certified that Cadeler’s systems,
processes and operations comply with the requirements of ISO
9001/14001/45001.
The relevant flag states, or entities authorised by them, have issued a
‘Document of Compliance’ verifying that Cadeler operates vessels in
compliance with ISM code requirements. Cadeler continues to
improve and customise its management system to better reflect the
unique needs of its business, as a transportation and installation
contractor. Since the combination with Eneti in Dec 2023, Cadeler has
operated on separate systems, but has been progressing throughout
2025 to integrate management systems.
Cadeler uses insights gathered from engagement processes (as
described in S1-2) and from the Written Risk Assessment (APV in
Danish) to identify emerging risks and develop targeted action plans
to address them. As risks may differ depending on geography, work
environment (onshore or offshore), and over time, Cadeler promotes
local solutions tailored to specific operational challenges. The
Company is committed to developing, implementing, and
continuously improving its HSEQ processes through a risk-based
approach. It fosters a culture of learning from experience, incidents,
and observations, while empowering employees to speak up and
challenge unsafe practices. This helps ensure that safety and quality
remain top priorities. In addition, Cadeler works closely with
contractors and suppliers who share its HSEQ values and ambitions.
In 2025 Cadeler further strengthened safety culture support processes
through the introduction of new cabin books, implementation of
safety rules taken from IMCA, and by year-end rolling out a new fleet
safety induction video and animation representing the safety
leadership principles.
108
Management of the own workforce
Continued from previous page
Cadeler prioritises the day-to-day health and well-being of its
employees. These efforts reflect Cadeler’s commitment to fostering a
healthy, balanced and supportive work environment:
•Health and Fitness: on-site employee gyms (where possible)
allow workouts during work hours, provided this does not
interfere with tasks or meetings. Cadeler also provides
vitamins to all colleagues,
•Health Check-ups: offshore employees undergo mandatory
health checks, while onshore employees are offered well-
being assessments and extensive medical examinations with
specialists,
•Private Healthcare Insurance: onshore and off shore
employees are covered by private heathcare insurance,
•Life in Balance Programme: a continuous initiative offering
seminars on topics like sleep, nutrition and meditation,
promoting physical and mental health. In 2025 Cadeler also
held specific sessions regarding the phases of life,
•Well-being hotline: all employees have access to a well-
being hotline where they can raise health- and wellbeing
concerns with a third-party professional.
Cadeler strongly believes in flexibility between work and personal life.
For offshore employees, the organisation does all it can to
accommodate personal wishes so its employees can take part in
important life events. For onshore employees, Cadeler has a work
from home policy, allowing people to better balance work and
personal life. Cadeler also supports families through an
accommodating parental care policy. Onshore, the parental care
policy goes above and beyond the statutory laws and regulations to
support employees in a balanced life with their family.
Equal treatment and opportunities for all
Cadeler strives to prevent, mitigate or remediate adverse human
rights impacts that its business operations may cause or contribute to,
while also being committed to fostering a diverse and inclusive
workplace, emphasising equal opportunities for all employees.
As an equal opportunity employer, Cadeler is dedicated to fostering a
supportive, inclusive and growth-oriented workplace. To support fair
career development opportunities, the Company has established
systems that facilitate internal mobility and clearly defined offshore
career paths. A key initiative supporting this commitment onshore is
"The Cadeler Position Turbine," a transparent title structure that
outlines professional levels and their associated qualifications.
Cadeler conducts annual employee reviews during which leaders
gather feedback on employee from colleagues to gain a broader
perspective and mitigate potential biases. This feedback is used to
provide constructive input and to identify candidates for change of
roles.
In 2025, Cadeler achieved significant internal mobility with numerous
onshore employees transitioning into new roles within the Company,
while offshore roles saw significant internal rotation. Cadeler supports
employees in developing their professional competencies and skillsets
by supporting employees in taking on new roles within the
organisation. Cadeler believes that employees develop through
challenging tasks and sufficient training (e.g. vessel-specific courses
and competency-based learning). Additional support includes external
education and professional memberships. Related to this point, in
2025 all onshore leaders participated in workshops on change
management, feedback and self-reflection.
When recruiting new employees, Cadeler ensures a transparent
process where all candidates follow the same recruitment procedure.
Expectations for the role are clearly outlined in the job description,
and all candidates are selected based on their professional and
personal competencies for the position. Cadeler is committed to
creating a diverse, inclusive and supportive workplace where all
individuals are treated with respect and dignity. Cadeler maintains a
zero-tolerance approach to discrimination, harassment and bullying,
emphasising the psychological safety, health, and well-being of all
employees. These principles apply to employees, contractors and
business partners, who are encouraged to uphold similar standard.
109
Management of the own workforce
Continued from previous page
An organisation-wide Human Rights Impact Assessment was
conducted in 2024 and delivered in 2025 and work is ongoing to
implement recommendations and actions based on a three-year
roadmap to review, understand and mitigate salient risks and impacts
to workers and other individuals across Cadeler’s business and value
chain. The results of this assessment will feed into Cadeler’s future
improvement plans relating to its own workforce
Other work-related rights
As a listed Company and as per section 99d of the Danish Financial
Statements Act, Cadeler is required to disclose its policy on data
ethics. Cadeler complies with all relevant laws and regulations
concerning data privacy, confidentiality and cyber security. Cadeler is
committed to ensuring the security, privacy and proper handling of
information by adhering to all relevant laws and regulations
governing the creation, storage, dissemination and destruction of
information.
Regular training is provided to employees handling sensitive
information, enhancing their awareness of information and cyber
security. Information is classified based on its importance, the risk of
wrongful disclosure and the potential business impact of such
disclosure. Highly sensitive information is encrypted prior to
transmission to ensure its security.
To ensure secure disposal, sensitive information is destroyed in a
manner that prevents reconstitution, whether in paper, digital devices
or storage media. Mobile devices containing sensitive information or
accessing corporate networks are secured to prevent unauthorised
data leakage. Similarly, all computers and IT equipment are protected
against unauthorised access.
The following principles form the basis for Cadeler’s responsible
handling of data:
•Transparency: Cadeler aims for transparency in all aspects of
data handling, including ensuring that individuals are
informed about their data is used and for what purpose,
•Respect: the Company respects the rights of all employees
and individuals it does business with to make informed data
choices and is committed to complying with all applicable
legal and privacy requirements,
•Security: Cadeler seeks to protect the confidentiality,
integrity and availability of Cadeler’s s digital assets and data
in compliance with relevant laws and industry-specific
standards.
This policy is subject to annual review and approval by Cadeler’s
Senior Leadership Team.
Zero incident culture
__________________________
S1-5 – Targets related to managing material negative impacts,
advancing positive impacts, and managing material risks and
opportunities
Working conditions
The ultimate target for employees’ health and safety is zero harm,
meaning that no incidents or accidents take place while working for
Cadeler covering both onshore and offshore employees.
The safety management objectives of Cadeler remain focused on
defining safe practices for vessel operations by controlling all
identified risks to the Company’s ships, personnel and the
environment, and establishing appropriate safeguards.
Achieving the zero-harm goal is a milestone rather than an endpoint,
as continuous improvement is required to achieve zero-harm year
after year. Health and safety remain top priorities, evolving alongside
the Company’s growth and adapting to the dynamic risk landscape
shaped by societal and technological developments.
Even though Cadeler has a zero-harm goal in place and action plans
aimed at preventing human injury and loss of life, Cadeler recognises
a remaining risk for accidents and incidents. For this reason, Cadeler’s
approach is to continuously develop, implement and improve its
HSEQ processes; use a risk-based approach when conducting
Cadeler’s activities; nurture a culture of continuous improvement
where all employees learn from activities, successes, failures, incidents
and observations; empower all individuals to challenge and stop
unsafe acts, conditions, and behaviours; prioritise working with
contractors and suppliers that have similar HSEQ ambitions and goals
to Cadeler.
110
Management of the own workforce
Continued from previous page
Cadeler’s own workforce has not been directly involved in setting the
zero harm target, as this remains a management-level responsibility.
However, employees are indirectly engaged in tracking performance
through observation cards and participation in safety meetings,
allowing them to identify potential improvements. Additionally, a
workplace assessment has been conducted on the O-class vessels,
with the aim of extending this assessment to Cadeler’s remaining
fleets.
Equal treatment and opportunities for all
While Cadeler is an equal opportunity employer and fosters a diverse
and inclusive environment, the Company has not set specific targets
or KPIs for workforce diversity, either onshore or offshore, but always
aims to recruit the best candidate for the role, based solely on
personal and professional competencies. Cadeler encourages
interested applicants regardless of race, gender, sexual orientation,
religion, age or any other characteristics to apply for vacancies.
Cadeler acknowledges that the maritime industry is characterised by
an uneven gender balance. The candidate pool recruited from,
especially for offshore positions, has a higher male representation.
The approach to this imbalance is to recognize that gender
distribution begins in early education, and therefore Cadeler has
implemented initiatives to enhance recruitment efforts. For example,
the Company maintains a strong presence at universities in the UK
and DK with the aim of inspiring students from all backgrounds,
regardless of race, gender, sexual orientation, religion, age, national
origin, or other characteristics,to consider career opportunities in the
maritime sector, specifically at Cadeler.
Cadeler achieved its target of 30% women in leadership positions in
2025. To further strengthen gender diversity, the Company has set a
new target of 40% women in leadership positions by 2030.
Other work-related rights
Cadeler is committed to handling data responsibly. Whilst the
Company seeks to harness the benefits that new technologies and
data usage bring, it will always respect and uphold the fundamental
rights of all employees and stakeholders. As a starting point, Cadeler
has developed training sessions with the ambition that new
employees will complete the training. The purpose is to ensure that
employees are informed about the data privacy responsibilities when
working at Cadeler as well as the policies and responsibilities that
apply to Cadeler as an organisation working under Danish law.
Besides providing employees with information on policies, the training
is also be used to identify relevant target areas for data privacy in
Cadeler.
Own workforce composition
____________________________________
S1-6 – Characteristics of the Cadeler’s Employees
Given the nature of the services and the industry in which Cadeler
operates, tables presenting data on the number of employees,
diversity, gender distribution, etc. are disaggregated into onshore and
offshore segments. Cadeler is proud of its highly international
workforce both in terms of locations and nationalities represented
across its different locations. Cadeler’s workforce is composed by 43
different nationalities as of 31 December 2025. While the majority of
the workforce is situated in Denmark and the United Kingdom,
Cadeler also has employees located in the offices in Japan, Taiwan,
Monaco and the US.
Characteristics of the undertaking’s employees
The reported headcount represents the total number of employees on
the payroll at year-end. The allocation of employees by country relies on
the following principles: onshore employees are assigned to a country
based on the contract rather than where they are geographically
located. Offshore employees are categorized differently, as they are on
the vessels: for Danish-flagged vessels, all crew members are allocated
to Denmark. For other vessels where all crew members are employed
under multiple contracts associated with different jurisdictions, they are
categorized as UK. Permanent employees are defined as long-term
employees on contracts of indefinite duration. Temporary employees are
employees on a time-limited contract. Offshore temporary contracts
cover all employees apart from the regular crew, due to shorter projects
or unexpected circumstances. Non-guaranteed hours employees work
exclusively under defined terms. Onshore, they are mainly working as
students assistants.
111
Management of the own workforce
Continued from previous page
The Employee turnover in 2025 represents 9.8% of Cadeler’s
workforce, meaning that 103 employees left Cadeler during the
year. Offshore employee turnover is slightly higher (11.7%) than
onshore employee turnover (5.8%).
S1-8 – Collective bargaining coverage and social dialogue
Collective bargaining in the shipping industry regulates key
conditions for seafarers, including wages, working hours, safety
standards, and leave arrangements. All seafarers operating on
Danish-flagged vessels are covered by collective bargaining
agreements within Cadeler, representing 36% of the Company’s
own workforce. Outside Denmark, 24% of seafarers are covered by
such agreements. Overall, 43% of the Company’s workforce is
covered by collective bargaining.
Employee Turnover methodology
The employee turnover rate is calculated as the number of
employees who left during the reporting year divided by the
number of employees at year-end. All figures are reported on
a headcount basis.
Denmark | United Kingdom | Other | Total | ||||
Onshore | Offshore | Onshore | Offshore | Onshore | Offshore | ||
Number of Employees [Head Count] | 242 | 396 | 90 | 333 | 12 | - | 1,073 |
Number of permanent employees [Head Count] | 236 | 357 | 88 | 286 | 11 | - | 978 |
Number of temporary Employees [Head Count] | 39 | 1 | 47 | - | - | 87 | |
Number of non-guaranteed hours employees [Head Count] | 6 | - | 1 | - | 1 | - | 8 |
112
Management of the own workforce
Continued from previous page
S1-9 – Diversity metrics
Although Cadeler strives to ensure diversity, there remains a gender imbalance, with 887 male employees
and 165 female employees in the workforce by the end of the 2025. Women represent 40% of the employees
onshore and only 4% of the employees offshore.
Male | Female | Total | |||
Onshore | Offshore | Onshore | Offshore | ||
Number of Employees [Head Count] | 207 | 700 | 137 | 29 | 1,073 |
Number of permanent employees [Head Count] | 204 | 617 | 131 | 26 | 978 |
Number of temporary Employees [Head Count] | - | 83 | 1 | 3 | 87 |
Number of non-guaranteed hours employees [Head Count] | 3 | - | 5 | - | 8 |
Cadeler believes that its initiatives in universities are helping to drive change across the industry as a whole,
and that its diversity policies will improve its future representation on these metrics, fostering greater gender
diversity across both onshore and offshore business activities.
Age | Onshore | Offshore | Number of Employees |
Below 30 years [Head Count] | 68 | 81 | 149 |
19.8% | 11.1% | 13.9% | |
Between 30 and 50 years [Head Count] | 212 | 463 | 675 |
61.6% | 63.5% | 62.9% | |
Above 50 years [Head Count] | 64 | 185 | 249 |
18.6% | 25.4% | 23.2% |
In terms of age diversity, the majority of employees across Cadeler fall within the age group of 30 to 50 age
group (over 60% both onshore and offshore). For onshore roles, the age groups under 30 and over 50 are
equally represented, whereas offshore roles have the smallest proportion of employees in the under 30 age
group.
Total | % | |
Male | 6 | 67% |
Female | 3 | 33% |
Senior Leadership Team | 9 | 100% |
Diversity metrics
Top management level is defined as the Senior Leadership Team, including the CEO, CFO, Executive Vice Presidents
and Senior Vice-Presidents. The age count is based on the age distribution of the workforce at 31/12.
Cadeler’s Diversity, Equity & Inclusion Policy, outlines and guides the Company’s active support for
commitment to a diverse and inclusive organisation, building on a firm commitment to equal opportunities
for all. This commitment includes prioritising diversity and inclusion across all levels of the organisation,
including the Senior Leadership Team, where in 2025 women represented a 33.33% of the total composition.
In addition to gender diversity and in accordance with §107d of the Danish Financial Statements Act, Cadeler
considers factors such as age, nationality or professional and educational background in Cadeler’s approach
to enhancing inclusivity at Board of Directors and Senior Leadership Team.
113
Management of the own workforce
Continued from previous page
Safeguarding physical integrity
_______________________________________
S1-14 – Health and safety metrics
To illustrate that Cadeler’s highest priority is the health and safety of its entire workforce, the Company is
ISO-45001 certified, meaning that all employees including onshore and offshore workers are covered by the
integrated management system.
In 2025 no fatalities occurred among Cadeler’s workforce or other workers operating on Cadeler-controlled
sites. This outcome reflects the Company’s continued focus on health and safety and its commitment to
maintaining a safe working environment.
There were 10 total recordable incidents during the year, resulting in a Total Recordable Incident Frequency
(TRIF) of 5.58 (vs 2.43 in 2024). Lost-time incidents were, leading to 139 days lost due to work-related injuries
and an overall Lost Time Incident Frequency (LTIF) of 1.68 (vs 0.81 in 2024).Cadeler operates more vessels in
2025 than in 2024, explaining that the absolute number of incidents has increased. Despite an increase in
terms of projects and operations, the Company is committed to reduce the number of incidents, trying to
achieve the target of zero incident.
2025 | 2024 | % change | |
Percentage of people in the workforce covered by health and safety management system | 100% | 100% | 0% |
Number of fatalities in the workforce as result of work-related injuries and work-related ill health | 0 | 0 | 0% |
Number of fatalities as result of work-related injuries and work-related ill health of other workers working on Cadeler-controlled sites | 0 | 0 | 0% |
Total recordable incidents | 10 | 3 | 233% |
Total recordable incident frequency (TRIF) - incidents per million hours worked | 5.58 | 2.43 | 130% |
Number of lost-time incidents | 3 | 1 | 200% |
Number of days lost to work-related injuries | 139 | 101 | 38% |
Lost time incident frequency (LTIF) - lost time incidents per million hours worked | 1.68 | 0.81 | 107% |
Total person working hours | 1,791,450 | 1,234,903 | 45% |
Health & Safety metrics
The Company is covered by ISO-45001 and the Company is tracking the number of recordable work-related
incidents, including fatalities, lost-time injury, medical treatment cases and restricted work cases. Cadeler is
externally audited annually by DNV (DK) and Lloyds Register (UK), ABS (UK - Panama) and Class NK (UK – Japan
DoC for ISM) against the certificated standards of the management system ISO 9001, ISO 14001, and ISO 45001 and
ISM code.
114
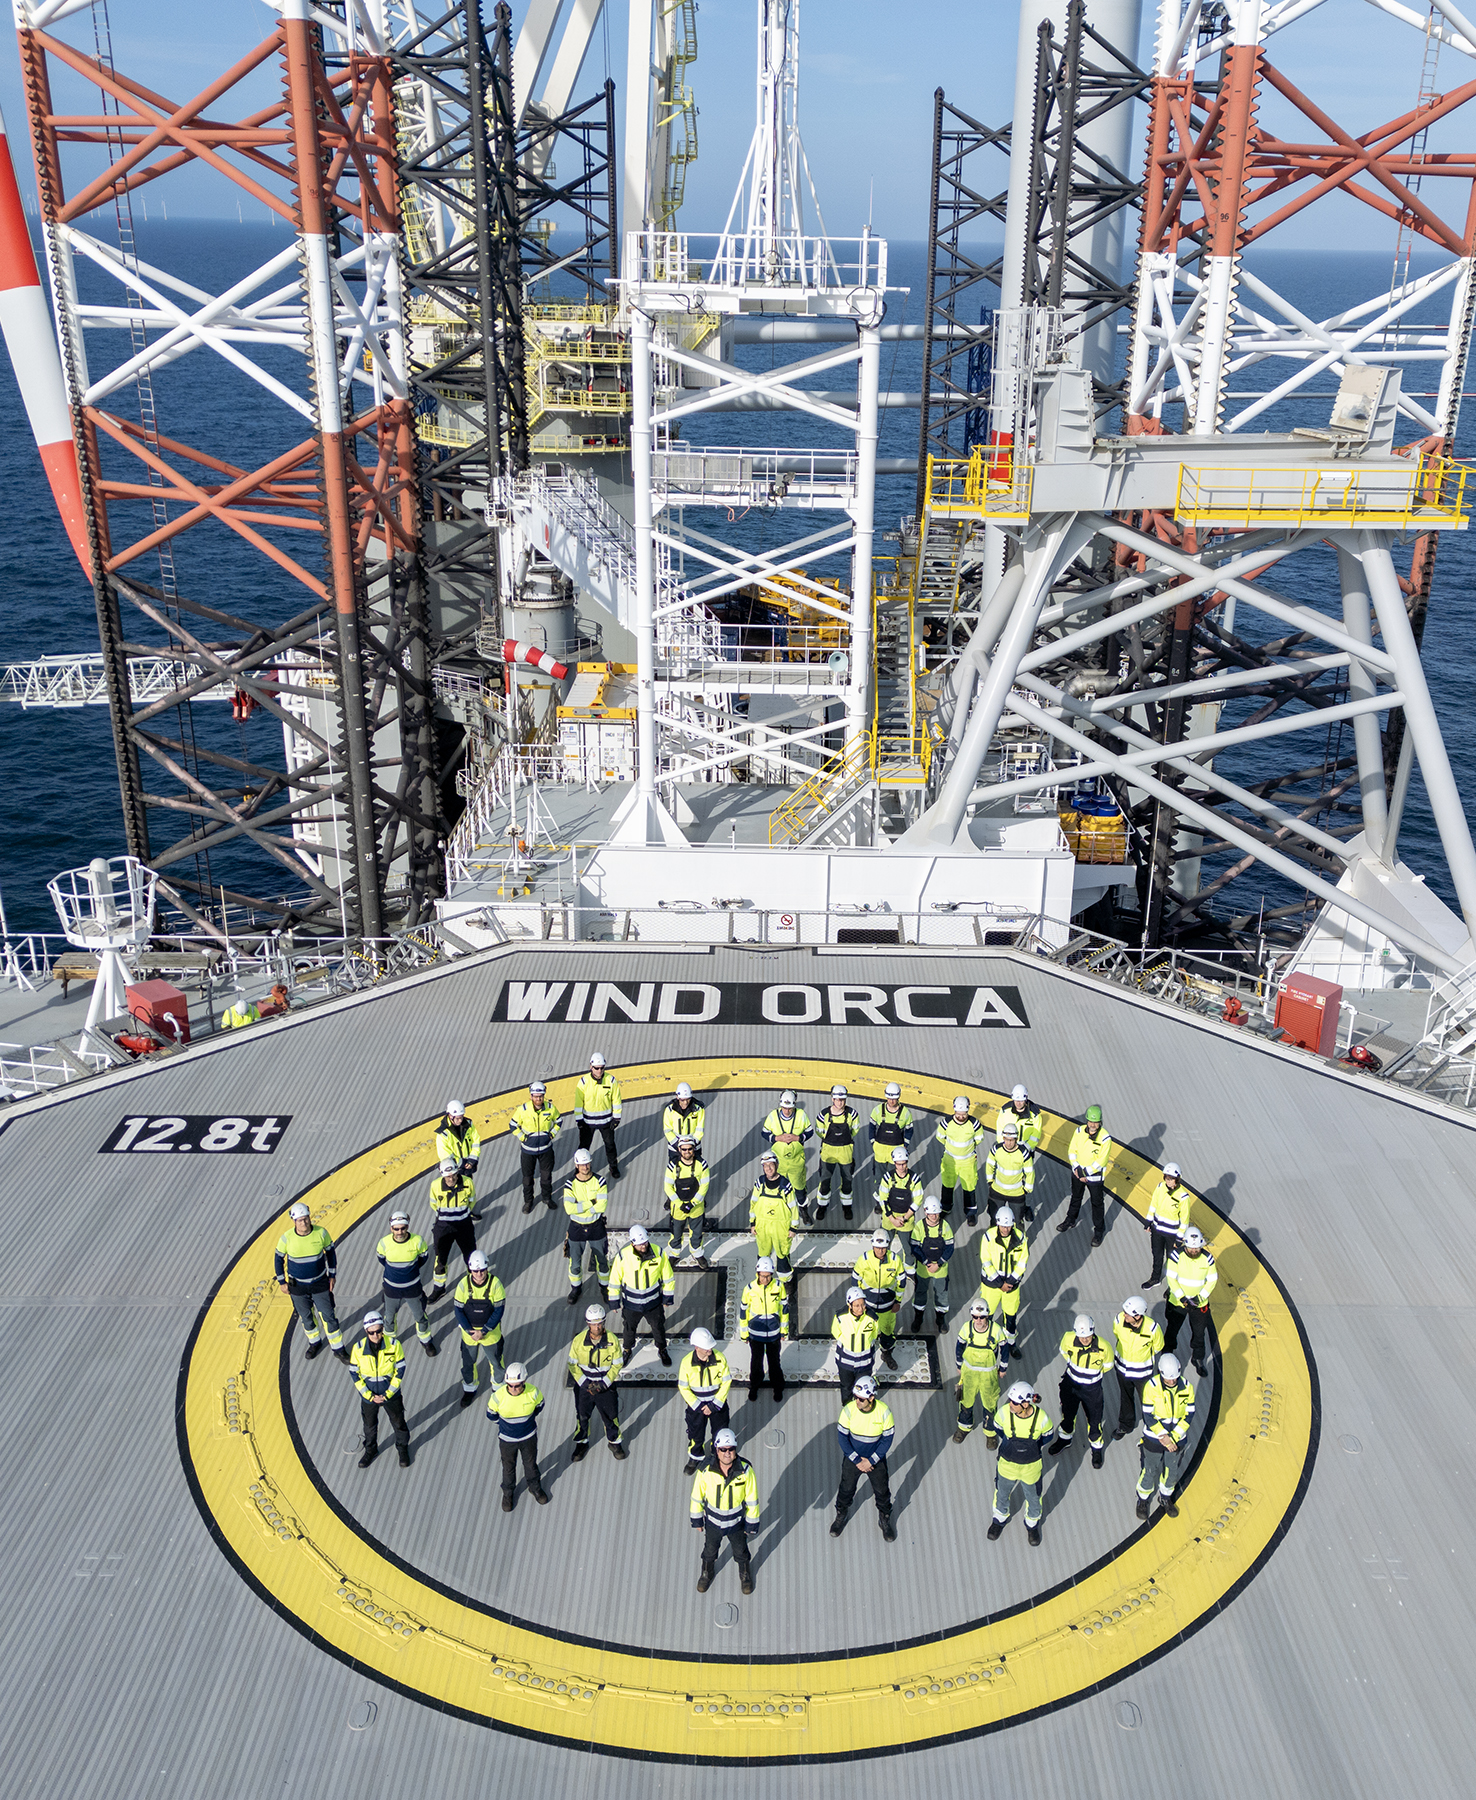
Management of the own workforce
Continued from previous page
Ensuring an equitable pay for all employees
_______________________________________________________
S1-16 – Remuneration metrics
Cadeler is committed to fair and equitable pay for all employees,
regardless gender. Compensation programs and practices are
regularly reviewed internally to ensure consistency and fairness across
the organisation. In 2025, Cadeler conducted a review of salary levels
across its regions to assess potential pay difference among employees
performing similar roles and holding comparable levels of
responsibilities and experience. The purpose of this review aims to
ensure equal pay for equal work. Going forward, this assessment will
be conducted periodically to monitor and address potential salary
gaps across the organisation.
Women represent 15.7% of Cadeler’s total workforce. In 2025, Cadeler
reports its gender pay gap for the first time. The assessment of this
metric resulted in a difference of -2% meaning that on average
women earn more than men across the total workforce. Cadeler
considers that this metric does not reflect equal pay comparisons
between male and female employees. The gender pay gap is
calculated as an aggregate measure across the entire workforce and
does not adjust for differences in role, location, seniority,
qualifications, employment conditions or the workforce composition
across onshore and offshore roles. As such, the metric provides a
general overview of workforce composition rather than a like-for-like
comparison of remuneration.
Cadeler remains committed to being a fair and equitable employer.
The Company continues to support initiatives aimed at fostering
women’s career development, and strengthening the pipeline of
female talent within the offshore wind sector.
Gender pay gap
A negative percentage indicates that female employees earn more on
average.
Gender pay gap is calculated as the difference between the average
gross pay of male and female FTEs divided by the average gross pay
of all male FTEs. This calculation does not take into account day-rate
contractors neither students/temporary roles. Gross pay includes fixed
and variable components of compensation.
Measurement uncertainty arises from certain components of
remuneration that cannot be individually assessed and are therefore
estimated.
The Company reports for the first time its annual total remuneration
ratio. This ratio represents the ratio of the highest paid individual to the
median annual total remuneration for all employees which is 25 in 2025.
Annual total remuneration ratio
The calculation based on the average annual gross pay level of all full-
time employees. The calculation includes the base salary, and where
applicable, bonuses and pension. The amounts are converted to EUR
with the effective foreign exchange rates of the last day of the year.
Gross pay level per employee is calculated as the Annual Gross Salary
per FTE. The part time employees´ salary has been excluded from the
calculation.
115
Management of the own workforce
S1-17 – Incidents, complaints and severe human rights impacts
Cadeler received 7 complaints of various types during 2025 through its channels for raising concern. There
were no reported incidents of discrimination, nor were any fines, penalties, or compensation issued in
relation to such cases. Similarly, no complaints were, to the best of Cadeler’s knowledge, filed with the
National Contact Points.
No severe human rights impacts or instances of non-compliance with the UN Guiding Principles and OECD
Guidelines for Multinational Enterprises were identified. As a result, there were no fines, penalties, or
compensation related to these matters.
Although Cadeler does everything it can to foster an open culture, it acknowledge that some cases may
never be reported through its formal channels, and that the disclosed figures therefore might be
understated.
2025 | 2024 | |
Number of incidents of discrimination [cases] | 0 | 0 |
Number of complaints filed through channels for people in own workforce to raise concerns [cases] | 7 | 10 |
Number of complaints filed to National Contact Points for OECD multinational enterprises | 0 | 0 |
Total amount paid in fines, penalties and compensation for damages result of incidents of discrimination [monetary] | 0 | 0 |
Number of severe human rights issues and incidents connected to own workforce [cases] | 0 | 0 |
Of which are cases of non-respect of UNGPs and OECD guidelines | 0 | 0 |
Total amount paid in fines, penalties and compensation for severe human rights issues and incidents connected to own workforce [monetary] | 0 | 0 |
Incidents, complaints and severe human rights impacts
Incidents of discrimination and harassment refers to cases classified under Speak Up!
Discrimination and harassment: uninvited and unwelcome verbal or physical conduct directed at an employee
because of his or her gender, religion, ethnicity or beliefs.
Sexual harassment: the making of unwanted and offensive sexual advances or of sexually offensive remarks or acts,
especially by one in a superior or supervisory position or when acquiescence to such behavior is a condition of
continued employment, promotion or satisfactory evaluation.
Retaliation: verbal, physical or written discriminatory or harassing behavior toward an individual who has made a
good faith report regarding a compliance issue.
116
Promote sustainable business practices in the value chain
Engaging with the stakeholders
_______________________________________
ESRS 2 SBM-3 – Material impacts, risks and opportunities and their
interaction with strategy and business model
Working within the Company’s value chain may affect workers’
conditions and rights in several ways. In particular, there is a risk that
working conditions may not fully comply with applicable local
regulations or with the Cadeler’s own policies and standards. Workers
in the value chain may also face potential impacts on fundamental
human rights, including risks related to forced labour or child labour,
as well as other labour-related rights such as equal pay for work of
equal value, access to quality training and professional development,
and systemic gender inequality or unequal remuneration. The
interests, views and rights of these workers are considered especially
impact-material in the upstream part of the value chain, where the
Company has comparatively less direct oversight. These issues can
arise across different countries and industries, reflecting broader
systemic challenges. Cadeler acknowledges the existence of these
systemic risks in order to better identify, prevent and address
potential adverse impacts within its value chain.
Cadeler’s disclosure on workers in the value chain aims to cover
actual and potential impacts on workers for tier one suppliers as well
as further down the value chain. Tier one and HSEQ critical suppliers
are the primary focus of this disclosure.
Through the human rights impact assessment, Cadeler identified the
following categories of potentially impacted workers in the value
chain:
•Workers in the direct supply chain: for example, shipyard
workers, contractors performing services on Cadeler’s
vessels, workers at companies providing equipment and
services for Cadeler, workers at transportation companies.
These workers are mostly upstream from Cadeler’s business,
as its business provides services rather than products. A
limited number of workers would be considered
downstream, i.e. those working with waste management
providers or involved in the decommissioning of project
equipment and eventually vessels,
•Workers in the indirect supply chain: for example, workers at
companies providing parts and services to Cadeler’s direct
supply chain,
•Workers in the extended supply chain: for example, workers
involved in the extraction of raw resources, or the
production of energy sources or bunkering ultimately used
by Cadeler or its direct supply chain,
•Workers exposed to material impacts by Cadeler’s own
operations: these include workers providing services at
Cadeler’s own operational sites,for example, onboard and
alongside the vessels. The potentially material impact that
Cadeler is most likely to have on workers in its value chain is
related to management of risks to health and safety at the
Company’s worksites. Cadeler aims to manage risks to
health and safety risks effectively and reduce the likelihood
of impacts on both its own employees and those in its value
chain to the lowest extent possible when they are present at
Cadeler’s worksites, and
•Workers exposed to impacts through the value chain: these
include workers in the Company’s direct supply chain,
indirect supply chain, and extended supply chain.
Promoting Human Rights along the Value Chain
_____________________________________________________________
The first global human rights impact assessment was conducted with
the support of external advisors in 2024 and delivered in 2025 to
ensure Cadeler’s commitment to respect human rights. This
assessment was conducted in accordance with the expectations set
out in the UN Guiding Principles.
The key findings of the impact assessment which were presented to
Cadeler in 2025 were as follows:
•Cadeler has a public commitment to respect human rights;
however, the due diligence approach can be further
improved
•Human rights risks are inherently high for Cadeler and the
offshore wind industry, given the nature of the work and the
supply chain,
•There are robust measures in place for Cadeler’s own
employees, efforts to address additional human rights risks
in the supply chain are currently largely limited to health
and safety management for selected tier one suppliers,
117
Promote sustainable business practices in the value chain
Continued from previous page
These findings have been used to develop a proportionate and
tailored human rights strategy and a three-year implementation
roadmap for Cadeler. In 2025, Cadeler has focused on establishing an
improved governance model and clear responsibility for the day-to-
day oversight as well as shared the findings from the impact
assessment across the organisation.
Cadeler’s salient human rights risks have been identified and defined
based on each key rightsholders groups. The most salient risks for
each key rightsholder are listed below:
•Offshore employees: accidents resulting in risks to life and
health, work-related risks to mental health, risk of excessive
working hours or periods, work-related risks to family life
and risks of discriminatory treatment,
•Onshore employees: accidents at projects sites resulting in
risks to life and health, risk of excessive working hours,
potential impacts of geopolitical conflicts on security and
risks of discriminatory treatment,
•Supply chain workers: accidents resulting in risks to life and
health, risk of child and forced labour in the extended
supply chain, risk of excessive hours and potential for unjust
working conditions,
•Community members: risks to human rights defenders,
impact on community rights, risks to livelihoods, risks to
effective remedy and risk of environmental harm.
The risks will be further analysed and prioritised to ensure that they
are addressed appropriately.
Cadeler needs throughout the different transport, installation and
maintenance works performed across geographies to engage and
collaborate with the appropriate third-parties and partners that
provide the required goods and services for the operations of the
Company’s assets and execution of its project work scopes.
The demand for these services is increasing as Cadeler is growing its
fleet and thereby also number of projects. Cadeler’s suppliers and
partners therefore have an increased opportunity to contribute to the
sustainability and predictability of their businesses, allowing them to
create or maintain stable jobs in their organisations as well as
upskilling their workers to meet the requirements.
Suppliers are required to confirm compliance with Cadeler’s Supply
Chain Code of Conduct which establishes the foundation for the right
framework and values for a positive work environment.
A more formalised process for conducting ongoing human rights due
diligence will also be defined, and human rights indicators will be
incorporated into supplier selection and retention to ensure that the
human rights strategy is implemented efficiently.
118
Promote sustainable business practices in the value chain
Continued from previous page
Impacts, risks and opportunities management
_________________________________________________________
S2-1 – Policies related to value chain workers
Working conditions
Cadeler’s Supply Chain Code of Conduct is shared with suppliers
across its value chain and informs the Company’s partners of its
expectations related to their ESG management practices. It is
applicable to all new onshore and offshore suppliers and includes
requirements and expectations related to forced and child labour (in
accordance with applicable ILO standards); health and safety; non-
discrimination; freedom of association and collective bargaining; and
grievance mechanisms. Further information on Cadeler’s Supply
Chain Code is provided in G1-2. As part of Cadeler’s supplier
onboarding process, and in accordance with Cadeler’s Supply Chain
Code of Conduct, suppliers are expected to have in place, or to
commit to adopting within a reasonable timeframe, health and safety
policies and management systems designed to reduce work-related
injury and illness and promote the general health of employees.
Suppliers are requested to ensure that information regarding health
and safety systems and standards is made readily available to
employees in appropriate languages.
As part of the mentioned onboarding process, suppliers are assessed
by departments of HSEQ, and E&C. The process is centralised within
Procurement, which is responsible for the registration of all relevant
master data in Cadeler’s systems, as well as the communication of the
Supply Chain Code of Conduct. The suppliers are only registered in
the system, by Procurement, after approval from HSEQ, and E&C.
Depending on the nature of the goods and services to be provided,
by the supplier, and the countries in which the supplier is based at,
and delivering and providing the goods and services, a different level
of assessment may be required as per the criteria defined by the
specific functions (HSEQ or E&C).
Through effective and regular communication, suppliers should
ensure that workers are aware of the suppliers’ obligations with
regard to site safety as well as their own obligations with respect to
ensuring the safety of themselves and other employees. As a
minimum, suppliers should provide their workers with reasonable
access to potable water and sanitary facilities, fire safety, emergency
preparedness and response, industrial hygiene, adequate lightning
and ventilation, equipment for prevention of occupational injuries
and illness and proper machine safeguarding. Suppliers should also
ensure these same standards apply to any dormitory or canteen
facilities.
Suppliers should have a policy in place that is aligned with national
and other applicable laws and regulations regarding alcohol and
drug abuse prevention, including testing where permitted, and
should communicate this policy appropriately to employees. Cadeler
expects that its suppliers do not use forced, coerced, bonded or
indentured, or involuntary labour of any form. All work, including
overtime, shall be voluntary and performed of the worker’s own free
will. Employees should be free to leave employment upon giving
reasonable notice. Suppliers should not require workers to surrender
government-issued identification papers, passports or work permits
as a condition of employment.
All workers must have written contracts that comply with local laws.
Suppliers must pay each employee at least the legal minimum wage
plus benefits (where applicable) and are encouraged to follow
voluntary codes. Suppliers must pay their employees promptly,
providing each with clear, written accounting for every pay period.
Wages should be paid regularly and, on time and be fair in respect of
work performance. Payment should not be made more than one
month in arrears and no deductions should be made from
employees’ pay for disciplinary reasons or to compensate the
employer for providing safer work conditions. Working hours must
not exceed the legal limit and, where relevant, notification should be
given of any particular hazards or risks associated with the work
performed. Workers should be properly compensated for overtime in
accordance with the law and within legal working hour limits.
119
Promote sustainable business practices in the value chain
Continued from previous page
Workers should be granted their stipulated annual leave and sick
leave without any repercussions and should be able to take their
stipulated maternity or paternity leave in accordance with national
and local laws.
Cadeler is committed to providing equal opportunities for all.
Suppliers shall not discriminate on the basis of race, national or
ethnic origin, gender, sexual orientation, religion, disability, age,
cultural background, social group, material status, family status or
political opinion, or other similar factors. Employees shall be treated
with dignity and respect. This shall be achieved by providing a
workplace free from physical, sexual, psychological or verbal
harassment or abuse, or the threat of such treatment.
All workers, if any, under the age of 18 must be protected from
performing any work that is likely to be hazardous, or likely to
interfere with education, or that may be harmful to the young
person’s health or safety. Suppliers should also adhere to legitimate
work-place apprenticeship programmes and comply with all laws and
regulations governing youth labour and apprenticeship programmes.
This explicitly includes the requirements of the International Labour
Organisation’s Minimum Age Convention, 1973. (No. 138) and Worst
Forms of Child Labour Convention, 1999 (No. 182), irrespective of
whether they have been ratified by the local country of operation.
Cadeler is committed to creating an environment free from
discrimination, harassment and bullying. This means that all
individuals contracted to work for Cadeler, must contribute to the
creation of a work culture that is engaging, supportive, and free from
negative and harmful behaviours. Also, suppliers are requested to
take intentional and thoughtful steps to promote positive
engagement with colleagues and to refrain from causing intentional
harm.
Other work-related rights
Cadeler’s Human Rights Policy sets out the Company’s commitment
to respect the human rights for its employees and those who perform
work on behalf of Cadeler. It covers topics including forced and child
labour (in accordance with applicable ILO standards), health and
safety, non-discrimination, freedom of association and collective
bargaining, and grievance mechanisms.
Cadeler’s Human Rights Policy explicitly prohibits the use of all forms
of modern slavery, included forced or indentured labour, and any
form of human trafficking. Cadeler encourages all those it does
business with to adhere to similar standards. The approach is based
on the principles set out in the International Bill of Human Rights, the
UN Guiding Principles on Business and Human Rights, and the
International Labour Organisation’s (ILO) Declaration on Fundamental
Principles and Rights at Work.
Cadeler respects the privacy and personal data its business partners,
and is committed to complying with global data protection and
privacy laws and regulations, including the EU General Data
Protection Regulation (GDPR). Cadeler’s policy sets out the
requirements for ensuring all personal data is processed by or on
behalf of Cadeler in a fair, lawful and transparent way.
The policies are reviewed annually, approved by Cadeler
SeniorLeadership Team and the Human Rights Policy by the Board of
Directors, while a designated department is responsible for
implementing each policy.
120
Promote sustainable business practices in the value chain
Continued from previous page
How to engage with upstream workers
_________________________________________________
S2-2 – Processes for engaging with value chain workers about
impacts
Cadeler seeks to select and engage with suppliers that comply with
applicable laws and regulations and that aim to go beyond
compliance by meeting standards that are generally expected.
Cadeler has a strong preference for working with suppliers who share
its commitment to honesty and integrity and who seek to integrate
principles of sustainable development into all areas of their business.
When collaborating with Cadeler, suppliers are required to comply
with the Supply Chain Code of Conduct, which establishes the
framework and values for a positive work environment at Cadeler.
Furthermore, the responsible functional or contracting manager
informs suppliers of their rights and obligations to raise concerns
whenever experienced. Cadeler is committed to safeguarding the
health and safety business partners and communities within which it
operates. Cadeler requires all relevant individuals and third parties
present at Cadeler workplaces worldwide to observe all applicable
legal requirements relating to occupational health and safety
standards and encourages suppliers to focus on safety management
at their own sites. The Procurement department, the HSEQ
department and the E&C department are responsible for selecting
the suppliers which demonstrate a real engagement towards workers’
rights within the value chain.
Remediation processes for value chain workers
___________________________________________________________
S2-3 – Processes to remediate negative impacts and channels for
value chain workers to raise concerns
Cadeler’s confidential reporting channel (Speak Up!) serves to raise
serious concerns like those related to potential human rights
violations. EthicsPoint is the independent provider of this channel. All
concerns raised are reported to Cadeler by EthicsPoint on a
confidential and anonymous basis, unless anonymity is waived by the
person reporting. SpeakUp! is available to any individuals working on
Cadeler’s behalf and any individuals with a relationship to Cadeler,
including its clients and suppliers. Further information on the
reporting channel is provided at G1-1.
Cadeler does not have a standard remediation action for all cases,
but has established a Confidential Reporting procedure and a Speak
Up Committee. Appropriate remedial actions are determined on a
case-by-case basis. Actions to provide remedy are defined, where
considered necessary, following examination and analysis of the
specific incident reported in accordance with relevant internal
procedures.
The Company’s policies emphasise that workers in the value chain
can raise concerns without fear of retaliation. Additional information
is provided in section G1-1.
In 2025, there were no reported cases concerning potential human
rights violations through Cadeler's confidential reporting channel or,
to the best of Cadeler's knowledge, through other available channels.
Outcome of Human Rights Impact Assessment
___________________________________________________________
S2-4 – Taking action on material impacts on value chain workers, and
approaches to managing material risks and pursuing material
opportunities related to value chain workers, and effectiveness of
those actions
Cadeler was provided the results of the HRIA in 2025. This was
undertaken in accordance with the expectations set out in the UN
Guiding Principles and included the following elements:
i) Saliency Mapping: Mapping Cadeler’s value chain (from supply
chain to wind farm construction, maintenance and decommissioning,
as well as direct operations and business relationships) against
internationally recognised human rights. This involved a combination
of interviews with key internal and external stakeholders and desk-
based research to determine the saliency and causal relationship of
each human right in terms of potential impact on key rightsholder
groups most relevant to Cadeler’s business,
ii) Gap Analysis: Assessing the degree to which Cadeler’s existing
measures and human rights approach align with the expectations of
the UN Guiding Principles as well as forthcoming European
regulatory requirements on human rights due diligence. This was
supplemented by benchmarking against industry peers and leading
companies to identify current management practices and, including
best practices,
121
Promote sustainable business practices in the value chain
Continued from previous page
iii) Strategy & Roadmap: Benchmarking five industry peers to identify
leading and best practices; assessing and summarizing the applicable
and forthcoming regulatory landscape on human rights due
diligence; and conducting workshops with internal stakeholders to
align on Cadeler’s ambition and maturity level in relation to human
rights management. These activities supported the definition of
Cadeler’s human rights strategy and the development of an
associated implementation roadmap. The roadmap consists of a
three-year implementation plan, structured around differentiated
priorities for each year, reflecting a phased approach to
strengthening Cadeler’s human rights management practices over
time.
In 2025, the Company developed a three-year roadmap to support
continuous improvement with respect to the rights of workers
throughout the value chain.
Cadeler is unaware of any severe human rights issues and incidents
connected to upstream and downstream value chain for the
reporting year 2025.
S2-5 – Targets related to managing material negative impacts,
advancing positive impacts and managing material risks and
opportunities
Cadeler has not yet established specific targets related to managing
impacts, risks and opportunities for workers in its value chain. Cadeler
will use the improvement areas identified during the HRIA, as
guidance for progressively setting targets to strengthen its
performance related to workers’ rights in the value chain. The
Company expects to be able to disclose concrete targets related to
this topic in the next reporting year.
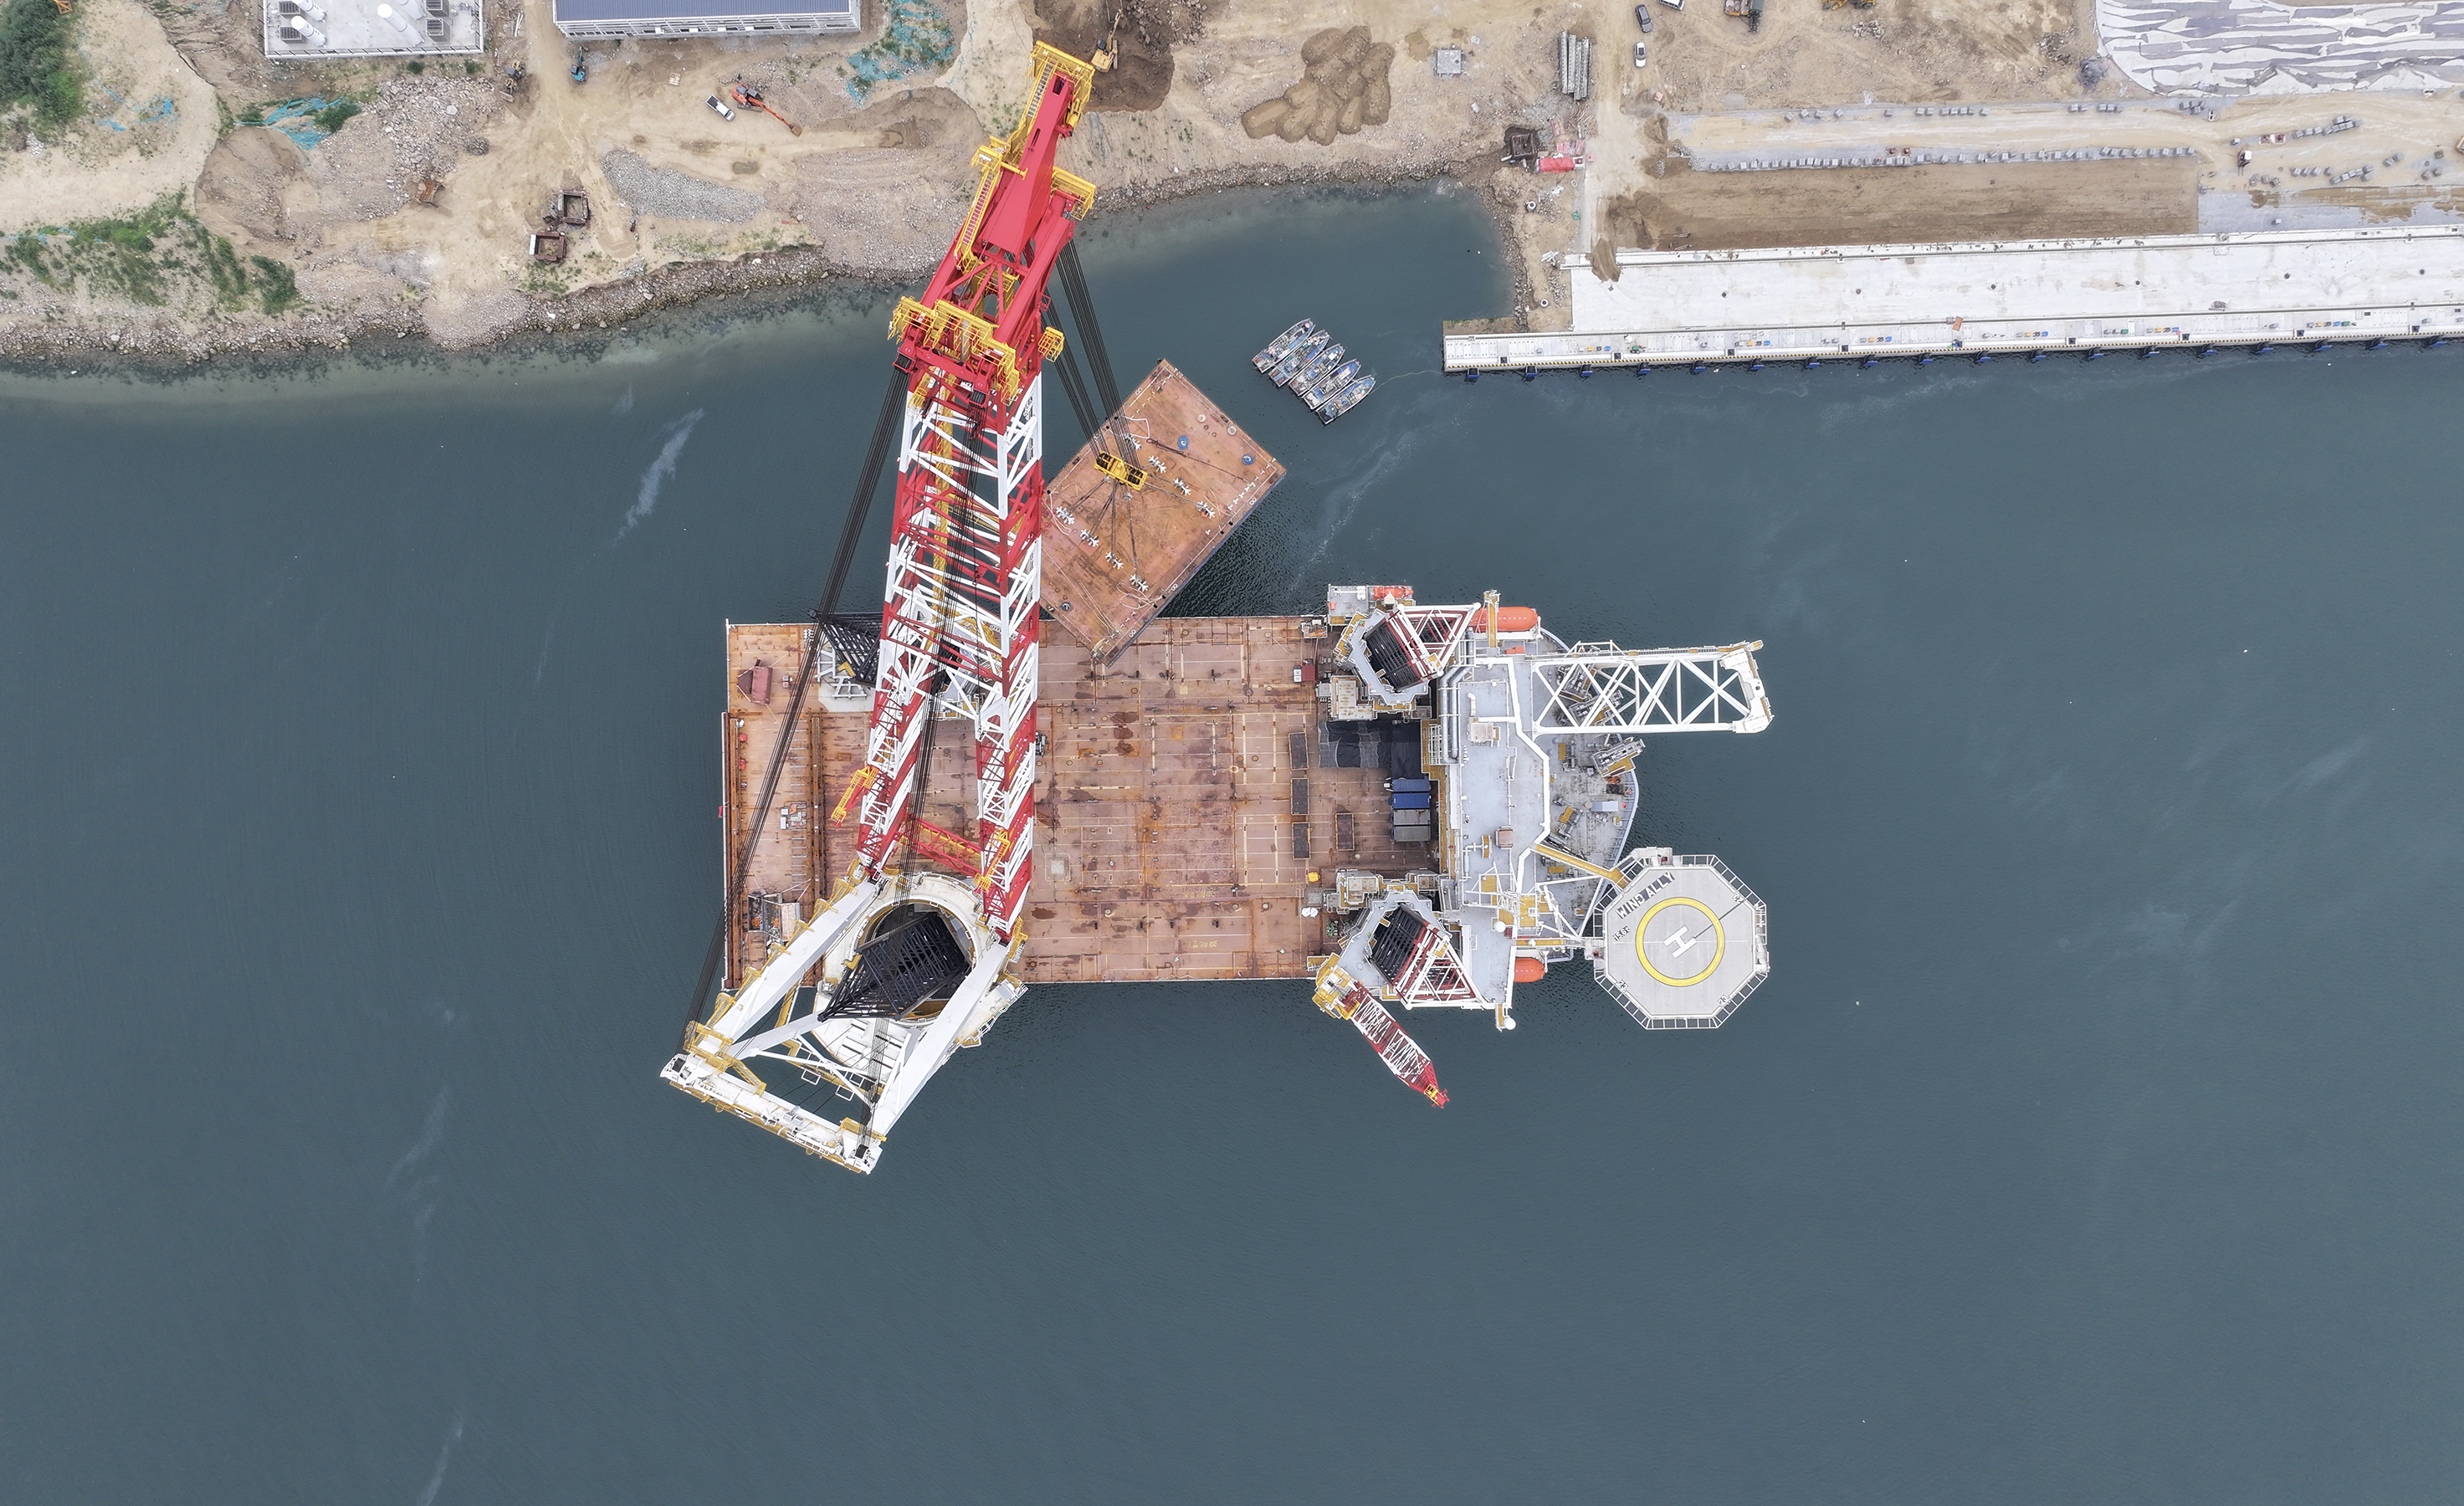
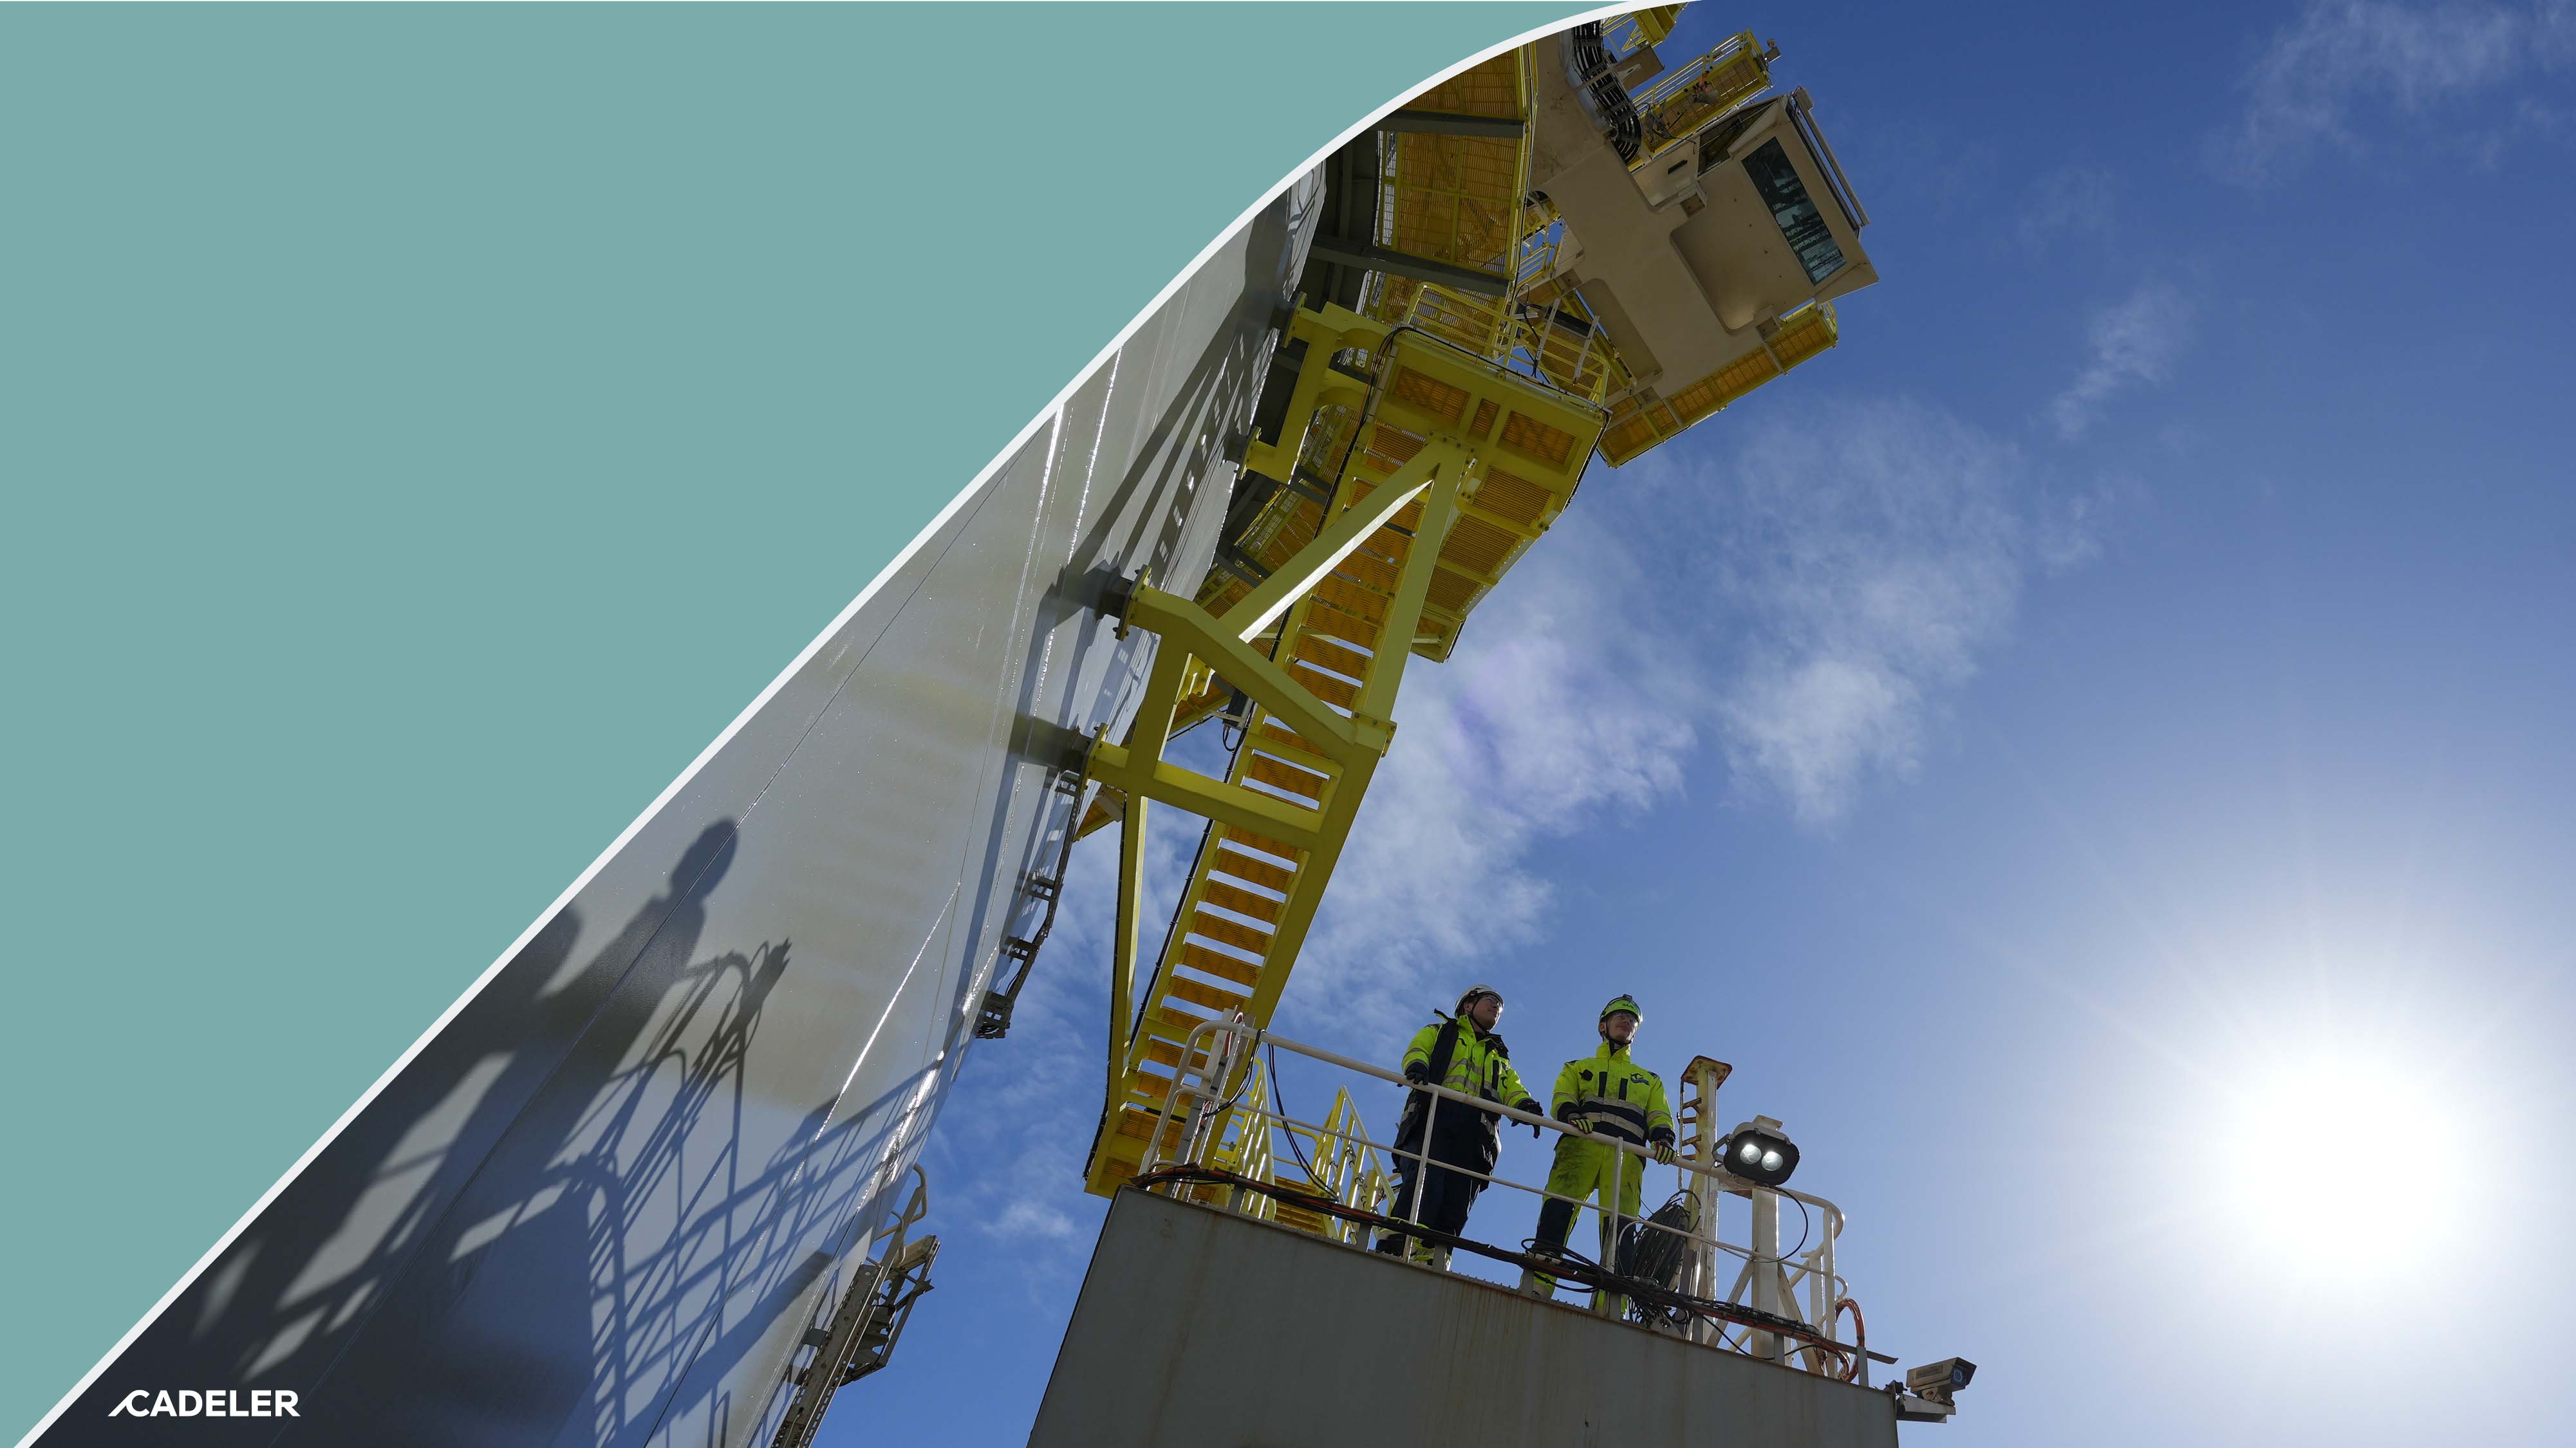
122
Governance
123
Foster business ethics
Impacts, risks and opportunities management
__________________________________________________________
ESRS 2 IRO-1 – Description of the processes to identify and assess
material impacts, risks and opportunities
To identify and assess material impacts, risks, and opportunities,
Cadeler considered risks arising from the size of the organisation, its
business activities and operations, and the various locations in which
it operates. The Company’s business conduct emphasises ethical
practices across the entire value chain. The prioritisation of IROs is
based on the experience and expertise of Senior Management and
Leadership. Based on this process, Cadeler identified the prevention
of bribery and corruption, incidents of bribery and corruption, the
management of supplier relationships, and corporate culture as
central elements for operating the business and maintaining a
leadership position in the market.
GOV-1 – The role of the administrative, management and supervisory
bodies
Cadeler has an Ethics and Compliance (E&C) function that manages
risks related to Company governance, anti-bribery and corruption
practices, human rights processes, etc. This function works in
coordination with the Procurement department to push Cadeler’s
expectations for sustainability practices towards its supply chains and
monitor supply chain risks due to issues such as human rights and
corruption.
G1-1 – Business conduct policies and corporate culture
Business conduct policies and corporate culture
Cadeler’s Code of Conduct (the “Code”) outlines the principles and
guidelines for maintaining ethical business practices and integrity
within Cadeler. It sets out the values that those working for Cadeler
are expected to adhere to, including with respect to anti-bribery and
corruption; health, safety and environment; and equal opportunities,
diversity and respect in the workplace. The Code is publicly available
and is mandatory for all onshore and offshore employees, officers
and directors of Cadeler.
The Code is supported by internal policies and procedures that
further strengthens Cadeler’s approach to key areas of business
conduct, including inter alia, HSEQ; Anti-bribery & Corruption;
Sustainable Development; Human Rights; and Personal Data &
Privacy.
Cadeler’s policies are developed by the respective departments, with
the support from the E&C team in conjunction with the Policy
Management Committee. They are reviewed periodically and
approved by Cadeler Executive Senior Leadership, while a designated
department is responsible for implementing each policy.
The expertise of Cadeler’s administrative bodies is disclosed in the
Annual Report. Please refer to the Management Review for
disclosures related to business conduct matters.
Protection of whistleblowers
All employees and any individual with a relationship with Cadeler,
such as clients and suppliers, are encouraged to raise concerns
whenever they identify activities that are not aligned with Cadeler’s
values and behaviours throughout Speak Up! which provides a
framework for concerns to be raised confidentially and without fear
of adverse repercussions.
EthicsPoint is the independent third party in charge of managing
confidentiality reports, providing an anonymous and confidential
mechanism for raising concerns about serious matters for unethical
or improper conduct, including suspected violations of applicable
laws and regulations or Cadeler policies and procedures;
discrimination, bullying or harassment of any kind; and
environmental, health and safety or human rights concerns.
Cadeler prohibits retaliation of any kind against employees who raise
concern in good faith, even if doing so may result in a loss of
business. Cadeler takes every report of potential misconduct seriously
and is committed to conducting all reviews and investigations in an
independent, fair and impartial manner.
Information about the confidential reporting hotline and the
Confidential Reporting (Speak-Up!) Procedures is available on the
Company’s Intranet, through training materials and the Confidential
Reporting Channels can also be accessed from the Company’s
website. Awareness is further promoted through the display of
posters in shared areas at both onshore and offshore workplaces and,
to increase accessibility, a QR code linked to the hotline’s webpage is
available, encouraging employees to raise concerns whenever
necessary.
Cadeler’s Supply Chain Code of Conduct also refers to the
confidential reporting channel, emphasising that value chain workers
can raise concerns and seek remediation without fear of retaliation.
124
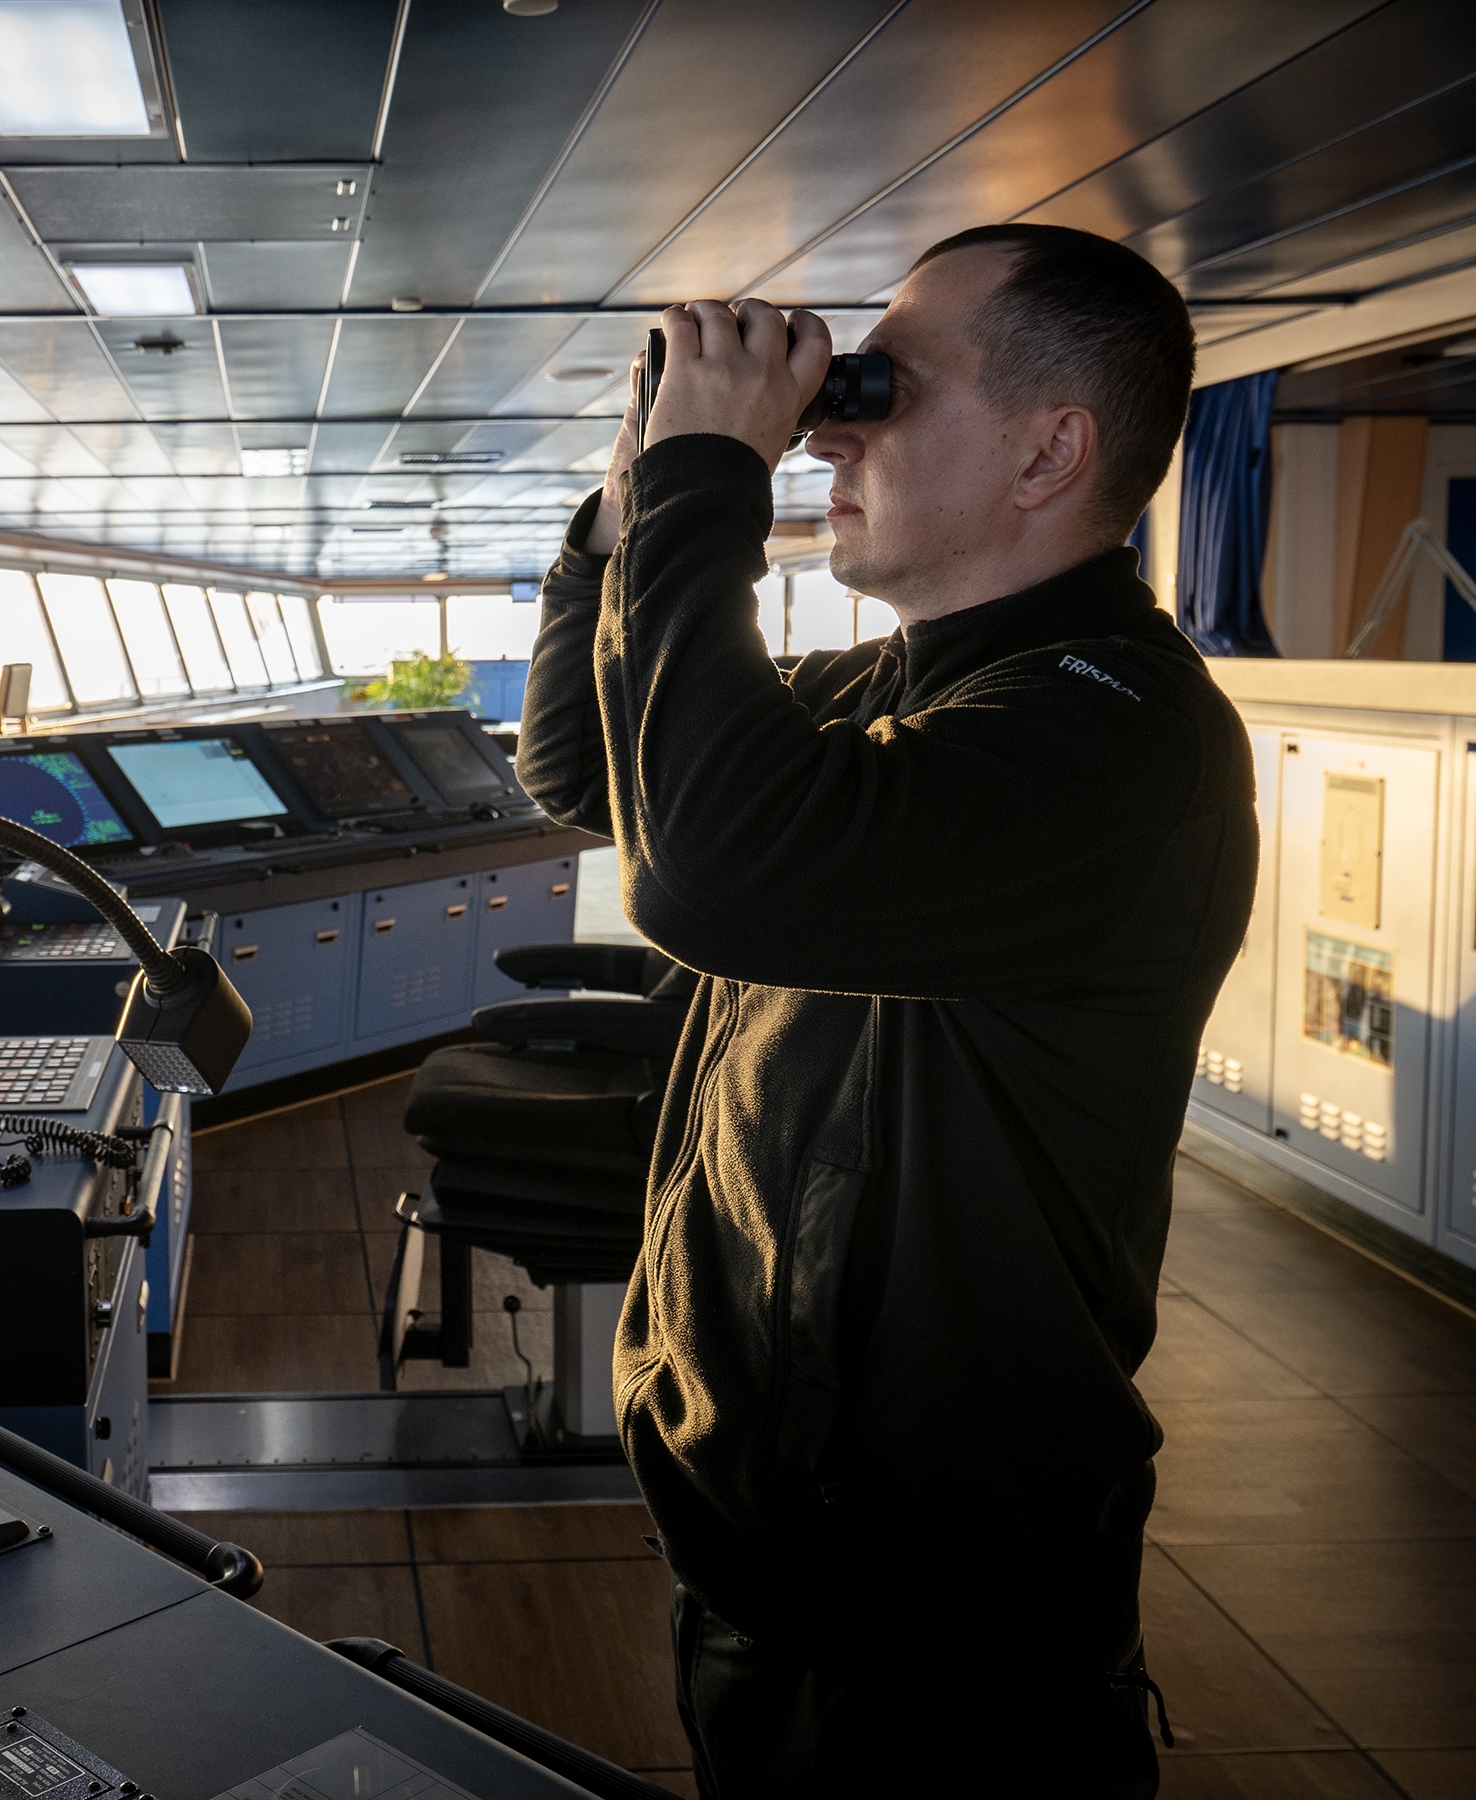
Foster business ethics
Continued from previous page
G1-2 – Management of relationships with suppliers
In line with its approach to responsible business, Cadeler actively
seeks to select and work with suppliers who not only comply with
laws and regulations but also go beyond compliance by meeting the
standards expected of an industry leader. Cadeler has a strong
preference for working with suppliers who share its commitment to
honesty and integrity and who seek to integrate principles of
sustainable development into all areas of their business.
Cadeler commits to paying all its suppliers and partners, including
specialists, on time and in accordance with agreed payment terms.
This commitment is reflected in the finance management procedures
governing the invoice payment process. Invoices are filtered,
extracted and classified into the relevant payment file and invoice
currencies on a weekly basis.
The payment files are then submitted, generating a summary list of
invoice amounts per supplier within the system. Structured reports
are set up in Cadeler’s ERP system and twice weekly reviews are
conducted to identify invoices requiring handling or approval. An
automatic reminder notification system is in place to prevent late
payments.
Supply Chain Code of Conduct
Cadeler’s Supply Chain Code of Conduct sets out the requirements
and principles that Cadeler’s suppliers are expected to adhere to. The
Supply Chain Code of Conduct applies to all new onshore and
offshore suppliers and includes requirements and expectations
related to forced and child labour, environment, anti-bribery and
corruption, health and safety, non-discrimination, freedom of
association and collective bargaining, and grievance mechanisms.
Adherence to the Supply Chain Code of Conduct is a contractual
requirement for all new suppliers onboarded under Cadeler’s
standard terms and conditions.
Due Diligence Activities
Cadeler follows a structured procedure under which suppliers are
identified, assessed, onboarded and managed when applicable. From
a procurement perspective, the key process relates to the sourcing
lifecycle in Cadeler, including the business need or scope of work,
business case, tender process or sourcing approach, evaluation and
selection of a supplier for a contract, framework agreement or
purchase order. This procedure applies to new contracts with an
estimated value exceeding EUR 25,000. The process is described in
detail in the procedure “Sourcing and Supplier Selection”. For
amounts below EUR 25,000, the purchasing activity may be handled
via a purchase order without a contract or framework agreement and
governed by Cadeler’s Purchase Order Terms and Conditions.
From a business perspective, suppliers are also classified as “Basic”,
“Standard” and “Manage”, triggering the requirements for
onboarding, monitoring and corresponding management. Cadeler
HSEQ has established specific criteria for classifying suppliers as “Low”,
“Medium” or “High Risk” from an HSEQ perspective. This is reflected in
Cadeler’s Supplier Management Procedures. Since 2024 , Cadeler has
included the HSEQ risk assessment in the onboarding process.
The Company is continuing to optimize its third-party supplier due
diligence processes through the integration of an electronic screening
tool introduced in 2024. The tool forms part of the supplier
onboarding framework to help identify risks associated with financial
crime, sanctions, key legal issues captured in the media, and other
responsible business practices which are risk-weighted in accordance
with internal risk methodology.
Onboarded suppliers are also subject to ongoing monitoring and
periodic risk assessments. Frequency of the assessment depends on
the experience of Cadeler with the suppliers. Any flagged issue
automatically triggers a review from HSEQ, E&C and/or Procurement.
125
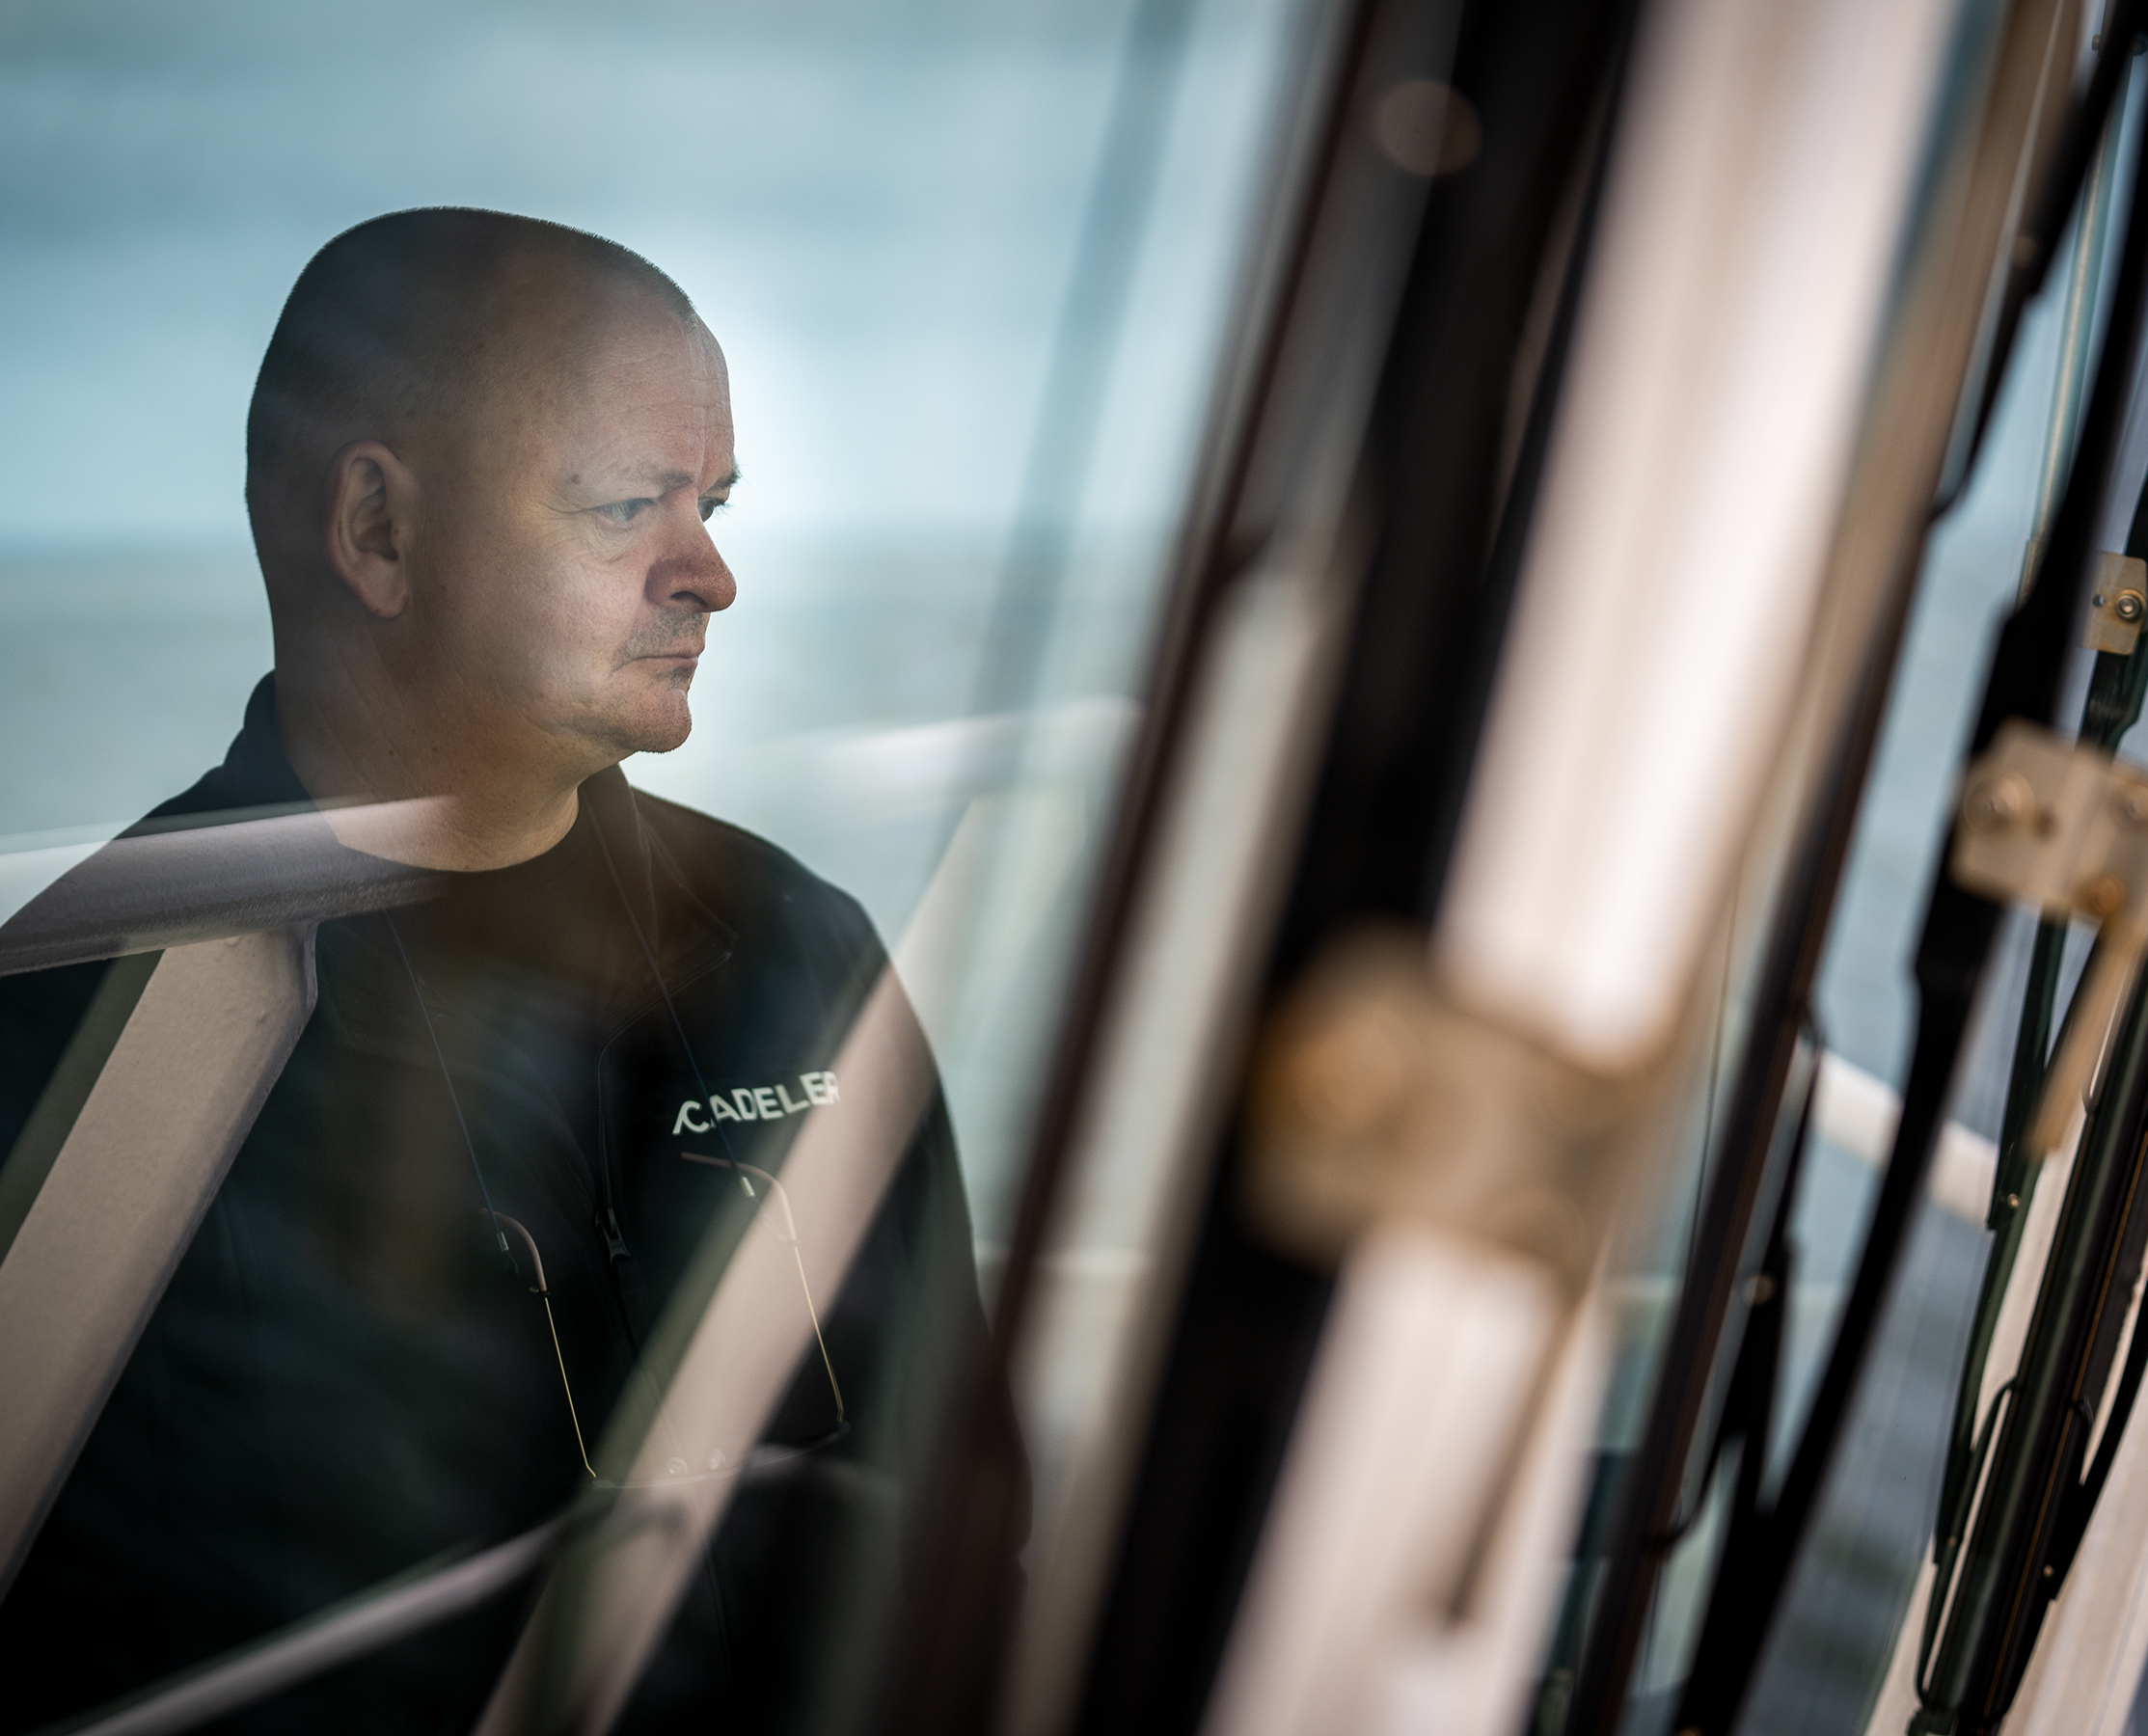
Foster business ethics
Continued from previous page
Fighting against corruption and Bribery
__________________________________________________
G1-3 – Prevention and detection of corruption and bribery
Cadeler has zero tolerance for any form of bribery and corrupt payments, whether given or received,
directly or indirectly, anywhere in the world. This prohibition is clearly outlined in the Company’s Code of
Conduct and the Anti-bribery and Corruption Policy, which is applied to all offshore and onshore
employees, individuals contracted to work for Cadeler and any third parties acting on behalf of Cadeler,
including consultants, agents and suppliers. These documents are available on Cadeler’s internal platform.
Cadeler’s Anti-bribery and Corruption Policy is further supported by a Gifts and Hospitality Policy, which
sets out the minimum requirements and principles that apply when giving or receiving anything of value on
behalf of Cadeler, as well as by the Supply Chain Code of Conduct. Both the Code of Conduct and the
Suppliers Code of Conduct are available on the Company’s website.
Employees are encouraged to immediately notify Cadeler’s E&C team if they become aware of any
behaviour that has the potential to breach Cadeler’s policies. Where this is not possible, or if individuals do
not feel comfortable doing so, concerns may also be raised via Cadeler’s confidential reporting channel
(Speak Up!) in accordance with the procedures described in G1-1. Reports of corruption or bribery will be
investigated by E&C in conjunction with Finance and Legal departments. Dependent on the nature of the
concern, assistance from external third-party specialists may also be utilised.
126
Foster business ethics
Continued from previous page
Training and awareness
To support the implementation of Cadeler’s Code and associated
policies and procedures, a companywide electronic Ethics
Engagement Training was rolled out in 2024 to all new onshore and
offshore employees.
An update of the Code of Conduct is planned for 2026 together
with an awareness training module for all employees. To continue
to foster an appropriate tone from the top, face-to-face training is
provided on an annual basis to Cadeler’s Senior Leadership team,
covering key areas of business conduct such as competition law,
anti-bribery and corruption, and data protection and privacy.
Prevention and detection of corruption and bribery
The at-risks functions outlined in the training table are defined as
follows: ‘risk’ determined with regard to nature of activities , type
of role and seniority of role. Hence, the Company considers as at-
risk functions the Board, Senior Leadership, Finance, Procurement,
Sales, Strategy and Business development, Legal, and Contract
management teams as well as the vessel masters and ports
captains.
2025 | |||
Training coverage | Managers | Board of Directors | At-risk functions* |
Total | 100% | 0% | 100% |
Total receiving training (e-learning) | 0% | 0% | 83.6% onshore/73.7% offshore |
Total receiving training (face-to-face) | 100% | 0% | N/A |
Delivery method and duration | |||
Classroom training | 1 hour | N/A | N/A |
Computer-based training | N/A | N/A | N/A |
Voluntary computer-based training | N/A | N/A | 20 minutes |
Frequency | |||
How often training is required | Annual | N/A | Annual |
Topics covered | |||
Definition of corruption | Covered | Not covered | Covered |
Policy | Covered | Not covered | Covered |
Procedures on suspicion/detection | Covered | Not covered | Covered |
*Cadeler’s definition of at-risk functions with respect to corruption and bribery include
the Board, senior leadership, finance, procurement, sales, strategy & business
development, legal, contract management teams as well as the vessel masters and site
managers.
Please note that at-risk functions training did not occur in 2025. The frequency of this
training for at-risk functions will be every 2 years onwards.
127
Foster business ethics
Continued from previous page
G1-4 – Incidents of corruption or bribery
Cadeler recorded no incidents of corruption or bribery in 2025, with no evolution compared to 2024.
Cadeler remains committed to ethical business practice, and it will continue to engage with business
partners that demonstrate the same commitment.
2025 | |
Number of convictions for violation of anti-corruption and anti-bribery laws [Cases] | 0 |
Amount of fines for violation of anti-corruption and anti-bribery laws [Monetary] | 0 |
Number of confirmed incidents of corruption or bribery [Cases] | 0 |
Number of confirmed incidents in which own workers were dismissed or disciplined for corruption or bribery-related incidents [Cases] | 0 |
Number of confirmed incidents relating to contracts with business partners that were terminated or not renewed due to violations related to corruption or bribery [Cases] | 0 |
Number of public legal cases regarding corruption or bribery brought against undertaking and own workers [Cases] | 0 |
Incidents of corruption or bribery
A confirmed incident of corruption or bribery with business partners is defined as an incident of corruption
or bribery that has been found to be substantiated and where the employee was dismissed or disciplined.
A confirmed incident relating to contracts with business partners that were terminated or not renewed due
to violations related to corruption or bribery is defined as an incident of corruption or bribery that has been
found to be substantiated and where the contract with a business partner was terminated or not renewed.
Payment practices
The average number of days prior to paying an invoice is calculated as the average of days between
the invoice day and the settlement date. Cadeler has included invoices that were due before 2025
and paid in 2025, invoices that were due during the fiscal year 2025, and invoices due in 2026 which
has been settled during 2025. The percentage of payments aligned with standard payment terms is
calculated as the number of invoices paid within payment terms divided by total number of invoices.
G1-6 – Payment practices
Cadeler’s standard payment terms are 45 days. The average time to pay invoices in 2025 was 50, with 72.8% of
payments aligned with standard payment terms. Payment performance in 2025 reflects the operational
transition associated with migrating legacy operations into the group’s unified financial system. Cadeler will
continue to strive towards increasing its performance on these specific metrics. Cadeler has no outstanding legal
proceedings related to late payments, highlighting its commitment to responsible and timely payment practices.
2025 | 2024 | |
Average number of days to pay invoice [days] | 53 | 36 |
Description of undertakings standard payment terms in number of days by main category of suppliers [days] | 45 | 45 |
Percentage of payments aligned with standard payment terms [percent] | 66.9% | 74.3% |
Number of outstanding legal proceedings for late payments [cases] | 0 | 0 |
128
Data points that
derive from other
EU legislation
129
Data points that derive from other EU legislation
ESRS | Disclosure requirement | Data point | SFDR | Pillar 3 | Benchmark regulation | EU climate law | Section* | Page | |
ESRS 2 | GOV-1 | 21 d | Board's gender diversity ratio | x | MR | page 31 | |||
ESRS 2 | GOV-1 | 21 e | Percentage of independent board member | x | MR | ||||
ESRS 2 | GOV-4 | 30; 32 | Disclosure of mapping of information provided in sustainability statement about due diligence process | x | SUS | page 47 | |||
ESRS 2 | SBM-1 | 40 d ⅰ | Undertaking is active in fossil fuel (coal, oil and gas) sector | x | SUS | page 87 | |||
ESRS 2 | SBM-1 | 40 d ⅱ | Undertaking is active in chemicals production | x | Undertaking not active | ||||
ESRS 2 | SBM-1 | 40 d ⅱ | Revenue from chemicals production | x | SUS | page 91 | |||
ESRS 2 | SBM-1 | 40 d ⅲ | Undertaking is active in controversial weapons | x | Undertaking not active | ||||
ESRS 2 | SBM-1 | 40 d ⅲ | Revenue from controversial weapons | x | SUS | page 91 | |||
ESRS 2 | SBM-1 | 40 d ⅳ | Undertaking is active in cultivation and production of tobacco | x | Undertaking not active | ||||
ESRS 2 | SBM-1 | 40 d ⅳ | Revenue from cultivation and production of tobacco | x | SUS | page 91 | |||
ESRS E1 | E1-1 | 14 | Transition plan to reach climate neutrality by 2050 | x | SUS | ||||
ESRS E1 | E1-1 | 16 (g) | Undertakings excluded from Paris-aligned Benchmarks | x | x | SUS | page 68 | ||
ESRS E1 | E1-4 | 34 | GHG emission reduction targets | x | x | x | SUS | ||
ESRS E1 | E1-5 | 38 | Energy consumption from fossil sources disaggregated by sources (only high climate impact sectors) | x | SUS | ||||
ESRS E1 | E1-5 | 37 | Energy consumption and mix | x | SUS | page 79 | |||
ESRS E1 | E1-5 | 40-43 | Energy intensity associated with activities in high climate impact sectors | x | SUS | page 78 | |||
ESRS E1 | E1-6 | 44 | Gross Scope 1, 2, 3 and Total GHG emissions | x | x | x | SUS | ||
ESRS E1 | E1-6 | 53-55 | Gross GHG emissions intensity | x | x | x | SUS | page 80 | |
ESRS E1 | E1-7 | 56 | GHG removals and carbon credits | x | SUS | page 77 | |||
ESRS E1 | E1-9 | 66 | Exposure of the benchmark portfolio to climate-related physical risks | x | Not reported/phase-in | ||||
ESRS E1 | E1-9 | 66 (a); 66 (c) | Disaggregation of monetary amounts by acute and chronic physical risk; Location of significant assets at material physical risk | x | Not reported/phase-in | ||||
ESRS E1 | E1-9 | 67 (c) | Breakdown of the carrying value of its real estate assets by energy-efficiency classes | x | Not material | ||||
ESRS E1 | E1-9 | 69 | Degree of exposure of the portfolio to climate-related opportunities | x | Not material | ||||
ESRS E2 | E2-4 | 28 | Amount of each pollutant listed in Annex II of the E-PRTR Regulation emitted to air, water and soil | x | Not material |
*SUS – Sustainability Statements; MR – Management Review; RR – Remuneration Report; FS – Financial Statements;
130
Data points that derive from other EU legislation
Continued from previous page
ESRS | Disclosure requirement | Data point | SFDR | Pillar 3 | Benchmark regulation | EU climate law | Section* | Page | |
ESRS E3 | E3-1 | 9 | Water and marine resources | x | Not material | ||||
ESRS E3 | E3-1 | 13 | Dedicated policy | x | Not material | ||||
ESRS E3 | E3-1 | 14 | Sustainable oceans and seas | x | Not material | ||||
ESRS E3 | E3-4 | 28 (c) | Total water recycled and reused | x | Not material | ||||
ESRS E3 | E3-4 | 29 | Total water consumption in m3 per net revenue on own operations | x | Not material | ||||
ESRS E4 | ESRS 2 - SBM-3 - E4 | 16 (a) ⅰ | x | Not material | |||||
ESRS E4 | ESRS 2 - SBM-3 - E4 | 16 (b) | x | Not material | |||||
ESRS E4 | ESRS 2 - SBM-3 - E4 | 16 (c) | x | Not material | |||||
ESRS E4 | E4-2 | 24 (b) | Sustainable land / agriculture practices or policies | x | Not material | ||||
ESRS E4 | E4-2 | 24 (c) | Sustainable oceans / seas practices or policies | x | Not material | ||||
ESRS E4 | E4-2 | 24 (d) | Policies to address deforestation | x | Not material | ||||
ESRS E5 | E5-5 | 37 (d) | Non-recycled waste | x | SUS | page 100 | |||
ESRS E5 | E5-5 | 39 | Hazardous waste and radioactive waste | x | SUS | page 100 | |||
ESRS S1 | ESRS 2 - SBM-3 - S1 | 14 (f) | Risk of incidents of forced labour | x | Not material for S1 | ||||
ESRS S1 | ESRS 2 - SBM-3 - S1 | 14 (g) | Risk of incidents of child labour | x | Not material for S1 | ||||
ESRS S1 | S1-1 | 20 | Human rights policy commitments | x | SUS | page | |||
ESRS S1 | S1-1 | 21 | Due diligence policies on issues addressed by the fundamental International Labor Organisation Conventions 1 to 8 | x | page 103 | ||||
ESRS S1 | S1-1 | 22 | Processes and measures for preventing trafficking in human beings | x | Not material for S1 | ||||
ESRS S1 | S1-1 | 23 | Workplace accident prevention policy or management system | x | SUS | page 103 | |||
ESRS S1 | S1-3 | 32 (c) | Grievance/complaints handling mechanisms | x | SUS | page 106 | |||
ESRS S1 | S1-14 | 88 (b); 88 (c) | Number of fatalities and number and rate of work-related accidents | x | x | SUS | page 113 | ||
ESRS S1 | S1-14 | 88 (e) | Number of days lost to injuries, accidents, fatalities or illness | SUS | page 113 |
*SUS – Sustainability Statements; MR – Management Review; RR – Remuneration Report; FS – Financial Statements;
131
Data points that derive from other EU legislation
Continued from previous page
ESRS | Disclosure requirement | Data point | SFDR | Pillar 3 | Benchmark regulation | EU climate law | Section* | Page | |
ESRS S1 | S1-16 | 97 (a) | Unadjusted gender pay gap | x | x | page 114 | |||
ESRS S1 | S1-16 | 97 (b) | Excessive CEO pay ratio | page 114 | |||||
ESRS S1 | S1-17 | 103 (a) | Incidents of discrimination | x | SUS | page 115 | |||
ESRS S1 | S1-17 | 104 (a) | Non-respect of UNGPs on Business and Human Rights and OECD | x | x | SUS | page 115 | ||
ESRS S2 | S2-1 | 17 | Human rights policy commitments | x | SUS | page 118 | |||
ESRS S2 | S2-1 | 18 | Policies related to value chain workers | x | SUS | page 118 | |||
ESRS S2 | S2-1 | 19 | Non-respect of UNGPs on Business and Human Rights principles and OECD guidelines | x | x | page 119 | |||
ESRS S2 | S2-1 | 19 | Due diligence policies on issues addressed by the fundamental International Labor Organisation Conventions 1 to 8 | x | page 119 | ||||
ESRS S2 | S2-4 | 36 | Human rights issues and incidents connected to its upstream and downstream value chain | x | page 120 | ||||
ESRS S3 | S3-1 | 16 | Human rights policy commitments | x | Not material | ||||
ESRS S3 | S3-1 | 17 | Non-respect of UNGPs on Business and Human Rights, ILO principles or and OECD guidelines | x | x | Not material | |||
ESRS S3 | S3-4 | 36 | Human rights issues and incidents | x | Not material | ||||
ESRS S4 | S4-1 | 16 | Policies related to consumers and end-users | x | Not material | ||||
ESRS S4 | S4-1 | 17 | Non-respect of UNGPs on Business and Human Rights and OECD guidelines | x | x | Not material | |||
ESRS G1 | G1-1 | 10b | United Nations Convention against Corruption paragraph 10 (b) | x | SUS | page 123 | |||
ESRS G1 | G1-1 | 10d | Protection of whistle- blowers paragraph 10 (d) | x | SUS | page 123 | |||
ESRS G1 | G1-4 | 24a | Fines for violation of anti-corruption and anti-bribery laws paragraph 24 (a) | x | x | SUS | page 127 | ||
ESRS G1 | G1-4 | 24a | Standards of anti- corruption and anti- bribery paragraph 24 (b) | x | SUS | page 127 |
*SUS – Sustainability Statements; MR – Management Review; RR – Remuneration Report; FS – Financial Statements;

132
Green Finance
Report
Note: This section is not required for compliance with EU CSRD
133
Cadeler and Green Finance
Green Loan Facilities
Green finance instruments are issued to finance or refinance eligible green projects, in whole or in part, that
promote the transition towards a low-carbon and climate-resilient society.
The green financing is supported by the Cadeler Green Finance Framework, rated Medium Green by S&P
Global in a Second Party Opinion in December 2023.
Annual Green Financing Reporting
To keep investors, lenders and other stakeholders informed about the progress of the Green Projects
funded by Green Finance Instruments, Cadeler publishes a Green Finance Report on the Company website,
either as a separate document or as information integrated in the Company’s annual sustainability
reporting. The Green Finance Report includes an Allocation Report and an Impact Report and is published
annually as a part of the Annual Report. If any change is made to the location of reporting in future years, a
statement will be included in the Annual Report.
Impact Reporting
Impact reporting aims to disclose the environmental impact of the Green Projects financed under this
Framework, and will, where possible, be measured, otherwise estimated. Impact reporting will, to some
extent, be aggregated and depending on data availability, calculations will be made on a best intention
basis.
Allocation Reporting
Cadeler publishes an annual allocation report as long as there are green finance instruments outstanding.
Cadeler intends to produce an annual statement including the following information: the amounts allocated
to each of the Green Project categories and the share of new financing versus refinancing, examples of
Green Projects that have been funded by Green Finance Instruments, the nominal amount of Green Finance
Instruments outstanding and the split between Green Bonds and Green Loans, and the amount of net
proceeds awaiting allocation to Green Projects (if any).
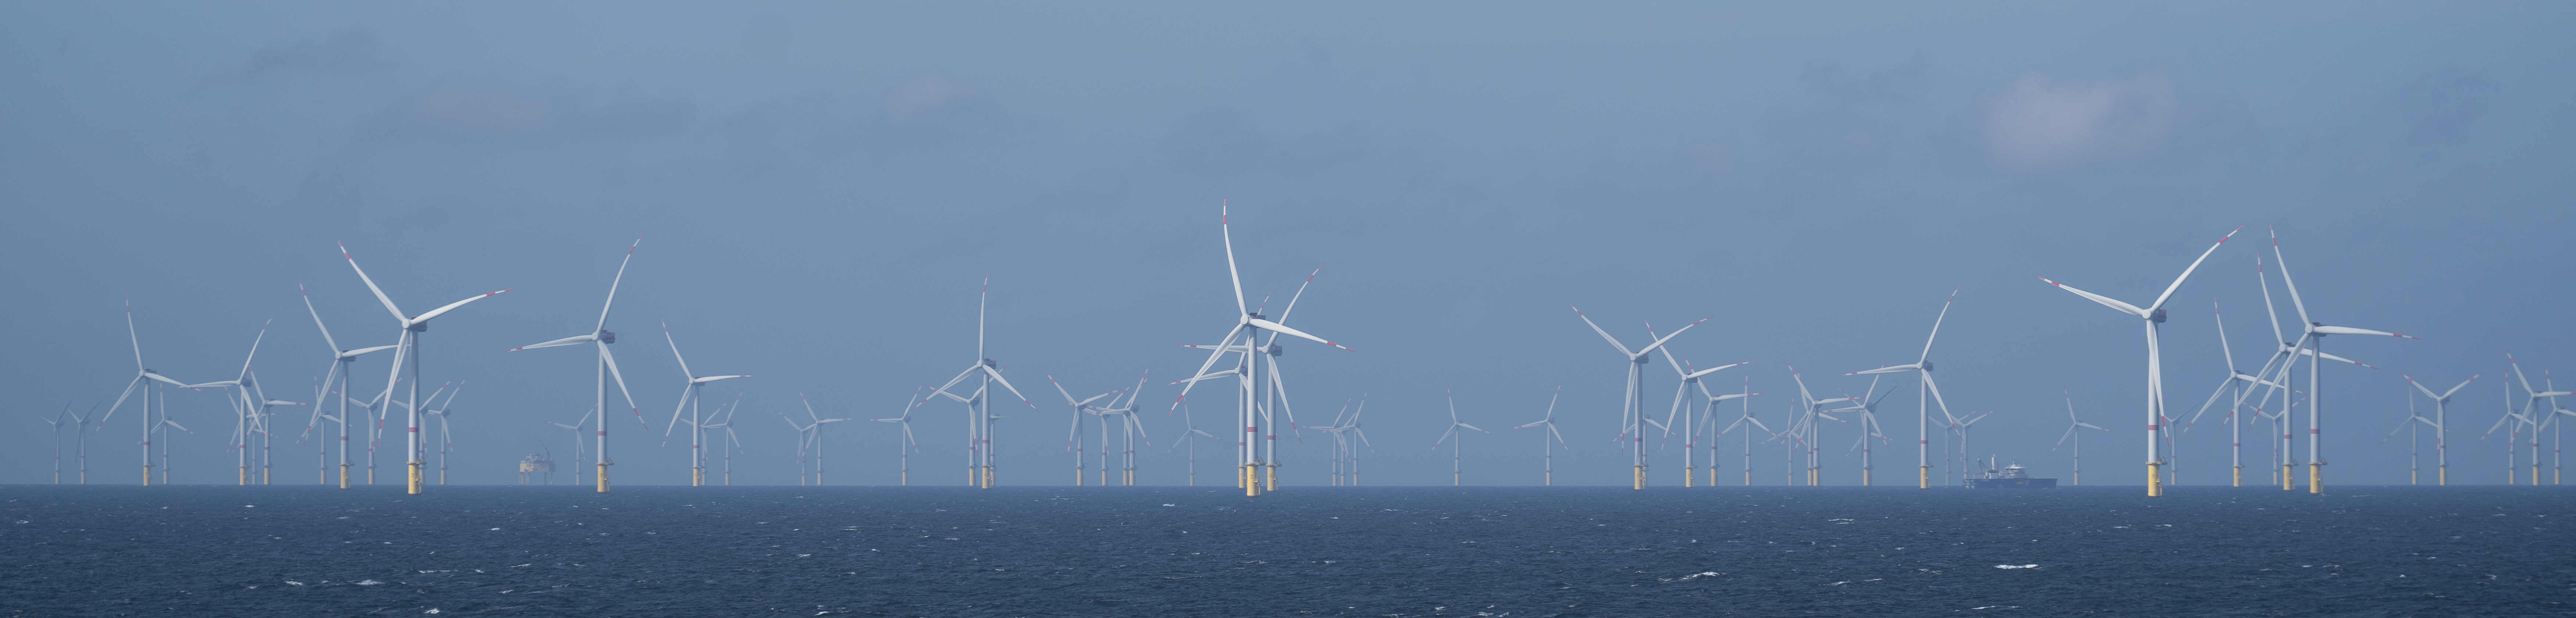
134
Green Company Financing
As at 31 December 2025, all corporate facilities of the Group qualify as Green Finance Instrument under
Cadeler’s Green Finance Framework. Please refer to Note 25 of Financial Statements for further details on
each facility. An externally verified Compliance Certificate, outlining alignment with the Green Company
Eligibility Criteria, will be shared with the relevant lenders.
Company Impact Report - Key Performance Indicators | Unit | 2025 | 2024 |
Number of installed offshore wind turbine foundations | number | 0 | 0 |
Number of installed offshore wind turbines | number | 245 | 186 |
Number of serviced offshore wind turbines | number | 56 | 9 |
Installed power generation capacity | MW | 3,370 | 2,130 |
Serviced power generation capacity | MW | 594 | 114 |
GHG emissions from offshore wind installation activities - Scope 1 emissions | tCO2e | 115,939 | 64,000 |
Scope 1 emissions (tCO2e) per MW installed or serviced | tCO2e/MW | 29.3 | 28.9 |
Green Loan Criteria/Company Eligibility Criteria | 2025 | 2024 |
Share of annual revenue from renewable energy projects | 100% | 100% |
Share of annual revenue from new/existing oil and gas installations | 0% | 0% |
Share of CapEx and OpEx aligned with the green project categories of the Green Finance Framework | 100% | 100% |
135
Green Project Financing
As of 31 December 2025, all vessel facilities of the Group qualify as
Green Finance Instrument, and the underlying assets as Green
Project, under Cadeler’s Green Finance Framework.
Please refer to Note 25 of Financial Statements for further details on
each facility.
For Green Project Financing, an independent auditor appointed by
Cadeler provides on an annual basis a limited assurance report
confirming that an amount equal to the net proceeds from such
Green Finance Instruments have been allocated to Green Projects.
Impact Report
The un-utilised Green facilities are financing for vessels that are not
yet in operation. Once Wind Ace is in operation, Cadeler will also
provide a report on the impacts of this vessel, as needed, directly to
the relevant lenders.
136
Green Project Financing
2025 | |||||||||||
Allocation Report | Allocation Project Category | ||||||||||
Debt Issue | Issued | Maturity | Proceeds | Proceeds allocated | To be allocated | Utilised | Installation/ maintenance vessels | Key enabling equipment | Weather stations | Waste and wastewater management | Project funded |
Senior Secured Green Term Loan Facility | 22/12/2023 | 12 y | 425m | 425m | 0m | 421m | 100% | Wind Peak and Wind Pace | |||
Senior Secured Green Term Loan Facility | 16/08/2024 | 12 y | 420m | 420m | 0m | 420m | 100% | Wind Maker and Wind Mover | |||
Senior Secured Green Term Loan Facility | 21/03/2025 | 12 y | 525m | 525m | 262.5m | 262.5m | 100% | Wind Ally and Wind Ace | |||
Facilities agreement | 22/05/2025 | 30/04/2026 | 150m | (repaid) | (repaid) | (repaid) | 100% | Wind Keeper initial acquisition | |||
Green Term loan facilities | 21/07/2025 | 5 y | 125m | 125m | 0m | 125m | 100% | Wind Keeper | |||

137
Financial Statements

138
Consolidated
Financial
Statements

139
Consolidated Statement of Profit or Loss and Other
Comprehensive Income
EUR'000 | Note | 2025 | 2024 | 2023 |
Revenue | 3 | 620,354 | 248,738 | 108,622 |
Cost of sales | 4 | (236,755) | (124,228) | (59,858) |
Gross profit | 383,599 | 124,510 | 48,764 | |
Net other operating income and expenses | 5 | 8,770 | 2,035 | 137 |
Administrative expenses | 4 | (74,626) | (57,101) | (34,458) |
Operating profit | 317,743 | 69,444 | 14,443 | |
Financial income | 9 | 7,498 | 5,233 | 1,541 |
Financial expenses | 9 | (37,377) | (7,200) | (4,486) |
Profit before income tax | 287,864 | 67,477 | 11,498 | |
Income tax credit/expense | 10 | (7,680) | (2,408) | — |
Profit for the period | 280,184 | 65,069 | 11,498 | |
Profit for the period attributable to: | ||||
Equity holders of the parent | 11 | 280,184 | 65,069 | 11,498 |
Earnings per share | ||||
Basic, profit/(loss) for the period attributable to ordinary equity holders of the parent (EUR per share) | 11 | 0.80 | 0.19 | 0.06 |
Diluted, profit/(loss) for the period attributable to ordinary equity holders of the parent (EUR per share) | 11 | 0.79 | 0.19 | 0.06 |
EUR'000 | Note | 2025 | 2024 | 2023 |
Other comprehensive income/loss | ||||
Items that may be reclassified to profit or loss | ||||
Exchange differences on translation of foreign operations | — | 34,105 | (6,724) | |
Cash flow hedges - changes in fair value | 24 | (5,003) | 13,079 | (18,505) |
Cash flow hedges - items recycled | 24 | (2,582) | 1,527 | (776) |
Cash flow hedges - cost of hedging | 24 | (5,708) | 8,752 | (3,621) |
Other comprehensive (loss)/income after tax | (13,293) | 57,463 | (29,626) | |
Total comprehensive income/loss for the period, net of tax | 266,891 | 122,532 | (18,128) | |
Total comprehensive income/loss attributable to: | ||||
Equity holders of the parent | 266,891 | 122,532 | (18,128) |
140
Consolidated Balance Sheet
EUR'000 | Note | 2025 | 2024 | 2023 |
Intangible assets | 12 | 19,432 | 18,190 | 16,947 |
Property, plant and equipment | 13 | 2,937,060 | 1,712,266 | 1,085,632 |
Right-of-use assets | 14 | 12,598 | 10,337 | 973 |
Leasehold deposits | 1,141 | 1,014 | 1,220 | |
Derivative assets | 23 , 24 | 2,419 | 6,593 | 338 |
Other non-current assets | 17 | 54,069 | 7,211 | — |
Total non-current assets | 3,026,719 | 1,755,611 | 1,105,110 | |
Inventories | 15 | 3,540 | 1,039 | 1,836 |
Trade and other receivables | 16 | 139,029 | 62,986 | 30,552 |
Contract assets | 16 | 81,923 | 37,609 | 8,880 |
Prepayments | 17 | 13,523 | 16,643 | 9,562 |
Current derivative assets | 23 , 24 | 263 | 11,875 | — |
Current income tax receivable | — | — | 12 | |
Cash and cash equivalents | 18 | 151,679 | 51,253 | 96,608 |
Total current assets | 389,957 | 181,405 | 147,450 | |
Total assets | 3,416,676 | 1,937,016 | 1,252,560 | |
EUR'000 | Note | 2025 | 2024 | 2023 |
Share capital | 22 | 47,144 | 47,144 | 41,839 |
Share premium | 1,099,495 | 1,099,495 | 952,858 | |
Treasury shares | (2,999) | (1,283) | — | |
Reserves | 18,423 | 29,180 | (28,283) | |
Retained earnings / (accumulated losses) | 341,613 | 59,358 | (7,373) | |
Total equity | 1,503,676 | 1,233,894 | 959,041 | |
Provisions | 20 | — | — | 4,813 |
Lease liabilities | 14 | 12,482 | 9,697 | 392 |
Deferred tax liabilities | 10 , 21 | 13,256 | 11,972 | 10,191 |
Deferred revenue | 3 | 30,901 | 1,747 | 1,778 |
Debt to credit institutions | 23 | 1,494,623 | 539,854 | 204,773 |
Derivative liabilities | 23 , 24 | 10,654 | 16,205 | 17,957 |
Total non-current liabilities | 1,561,916 | 579,475 | 239,904 | |
Trade and other payables | 20 | 98,208 | 43,595 | 32,636 |
Current provisions | 20 | — | 841 | 2,086 |
Payables to related parties | 27 | 272 | 223 | 162 |
Deferred revenue | 3 | 128,716 | 45,590 | 12,103 |
Current lease liabilities | 14 | 1,057 | 1,274 | 601 |
Current income tax liabilities | 3,638 | 752 | 1,224 | |
Current debt to credit institutions | 23 | 116,131 | 31,163 | 799 |
Current derivative liabilities | 23 , 24 | 3,062 | 209 | 4,004 |
Total current liabilities | 351,084 | 123,647 | 53,615 | |
Total liabilities | 1,913,000 | 703,122 | 293,519 | |
Total equity and liabilities | 3,416,676 | 1,937,016 | 1,252,560 |
141
Consolidated Statement of Changes in Equity
Reserves | ||||||||
EUR'000 | Share capital | Share premium | Treasury shares | Hedging reserves | Cost of hedging reserves | Foreign currency translation reserve | (Accumulated losses)/ retained earnings | Total |
2025 | ||||||||
Beginning of financial year | 47,144 | 1,099,495 | (1,283) | (3,332) | 5,131 | 27,381 | 59,358 | 1,233,894 |
Profit for the year | — | — | — | — | — | — | 280,184 | 280,184 |
Other comprehensive income for the year, net of tax | — | — | — | (7,585) | (5,708) | — | — | (13,293) |
Total comprehensive income for the year, net of tax | — | — | — | (7,585) | (5,708) | — | 280,184 | 266,891 |
Transfer of cash flow hedge reserve to property, plant and equipment | — | — | — | 2,536 | — | — | — | 2,536 |
Treasury shares | — | — | (1,716) | — | — | — | — | (1,716) |
Share-based payments | — | — | — | — | — | — | 2,071 | 2,071 |
End of financial year | 47,144 | 1,099,495 | (2,999) | (8,381) | (577) | 27,381 | 341,613 | 1,503,676 |
2024 | ||||||||
Beginning of financial year | 41,839 | 952,858 | — | (17,938) | (3,621) | (6,724) | (7,373) | 959,041 |
Profit for the year | — | — | — | — | — | — | 65,069 | 65,069 |
Other comprehensive income for the year, net of tax | — | — | — | 14,606 | 8,752 | 34,105 | — | 57,463 |
Total comprehensive profit for the year, net of tax | — | — | — | 14,606 | 8,752 | 34,105 | 65,069 | 122,532 |
Capital increase February 2024 | 5,301 | 149,567 | — | — | — | — | — | 154,868 |
Costs incurred in connection with February 2024 capital increase | — | (3,014) | — | — | — | — | — | (3,014) |
Capital increase June 2024 | 4 | 84 | — | — | — | — | — | 88 |
Treasury shares | — | — | (1,283) | — | — | — | — | (1,283) |
Share-based payments | — | — | — | — | — | — | 1,662 | 1,662 |
End of financial year | 47,144 | 1,099,495 | (1,283) | (3,332) | 5,131 | 27,381 | 59,358 | 1,233,894 |
142
Consolidated Statement of Changes in Equity
Continued from previous page
Reserves | ||||||||
EUR'000 | Share capital | Share premium | Treasury shares | Hedging reserves | Cost of hedging reserves | Foreign currency translation reserve | (Accumulated losses)/ retained earnings | Total |
2023 | ||||||||
Beginning of financial year | 26,575 | 509,542 | — | 1,343 | — | — | 3,108 | 540,568 |
Profit for the year | — | — | — | — | — | — | 11,498 | 11,498 |
Other comprehensive income for the year, net of tax | — | — | — | (19,281) | (3,621) | (6,724) | — | (29,626) |
Total comprehensive profit for the year, net of tax | — | — | — | (19,281) | (3,621) | (6,724) | 11,498 | (18,128) |
Registration of new shares in relation to business combination | 15,264 | 450,271 | — | — | — | — | — | 465,535 |
Costs incurred in connection with listing | — | (6,955) | — | — | — | — | — | (6,955) |
Changes from business combination | — | — | — | — | — | — | (23,113) | (23,113) |
Share-based payments | — | — | — | — | — | — | 1,134 | 1,134 |
End of financial year | 41,839 | 952,858 | — | (17,938) | (3,621) | (6,724) | (7,373) | 959,041 |
143
Consolidated Statement of Cash Flows
EUR'000 | Note | 2025 | 2024 | 2023 |
Cash flow from operating activities | ||||
Profit/(loss) for the period | 280,184 | 65,069 | 11,498 | |
Adjustments of non-cash items | 19 | 132,403 | 60,137 | 31,709 |
Changes in working capital | 19 | (16,591) | (33,650) | 20,174 |
Income tax paid | (3,510) | (1,747) | 2 | |
Interest received | 1,714 | 3,292 | — | |
Net cash provided by operating activities | 394,200 | 93,101 | 63,383 | |
Cash flow from investing activities | ||||
Cash acquired in a business combination, net | — | — | 10,403 | |
Additions to property, plant and equipment | 13 | (1,235,673) | (615,542) | (66,899) |
Disposal of property, plant and equipment | — | — | 1,800 | |
Movements in other non-current assets | 17 | (26,858) | (7,211) | — |
Additions to intangible assets | (1,506) | (410) | (31) | |
Leasehold deposits | (127) | 206 | — | |
Net cash used in investing activities | (1,264,164) | (622,957) | (54,727) |
EUR'000 | Note | 2025 | 2024 | 2023 |
Cash flow from financing activities | ||||
Principal repayment of lease liabilities | (2,073) | (1,961) | (569) | |
Interest paid | (56,471) | (19,689) | (7,143) | |
Proceeds from borrowing net of bank fees | 23 | 1,309,206 | 365,975 | 199,935 |
Proceeds from issue of share capital | — | 154,956 | — | |
Transactional costs on issues of shares | — | (3,014) | (6,955) | |
Repurchase of treasury shares | (1,716) | (1,283) | — | |
Bank charges | (1,975) | (2,368) | — | |
Repayment of loan | 23 | (279,281) | (10,630) | (115,000) |
Net cash provided by financing activities | 967,690 | 481,986 | 70,268 | |
Net (decrease)/increase in cash and cash equivalents | 97,726 | (47,870) | 78,924 | |
Cash and cash equivalents at beginning of the period | 51,253 | 96,608 | 19,012 | |
Effect of exchange rate on cash and cash equivalents | 2,700 | 2,515 | (1,328) | |
Cash and cash equivalents at end of the period | 151,679 | 51,253 | 96,608 |
144
Notes to the
Consolidated
Financial
Statements
145
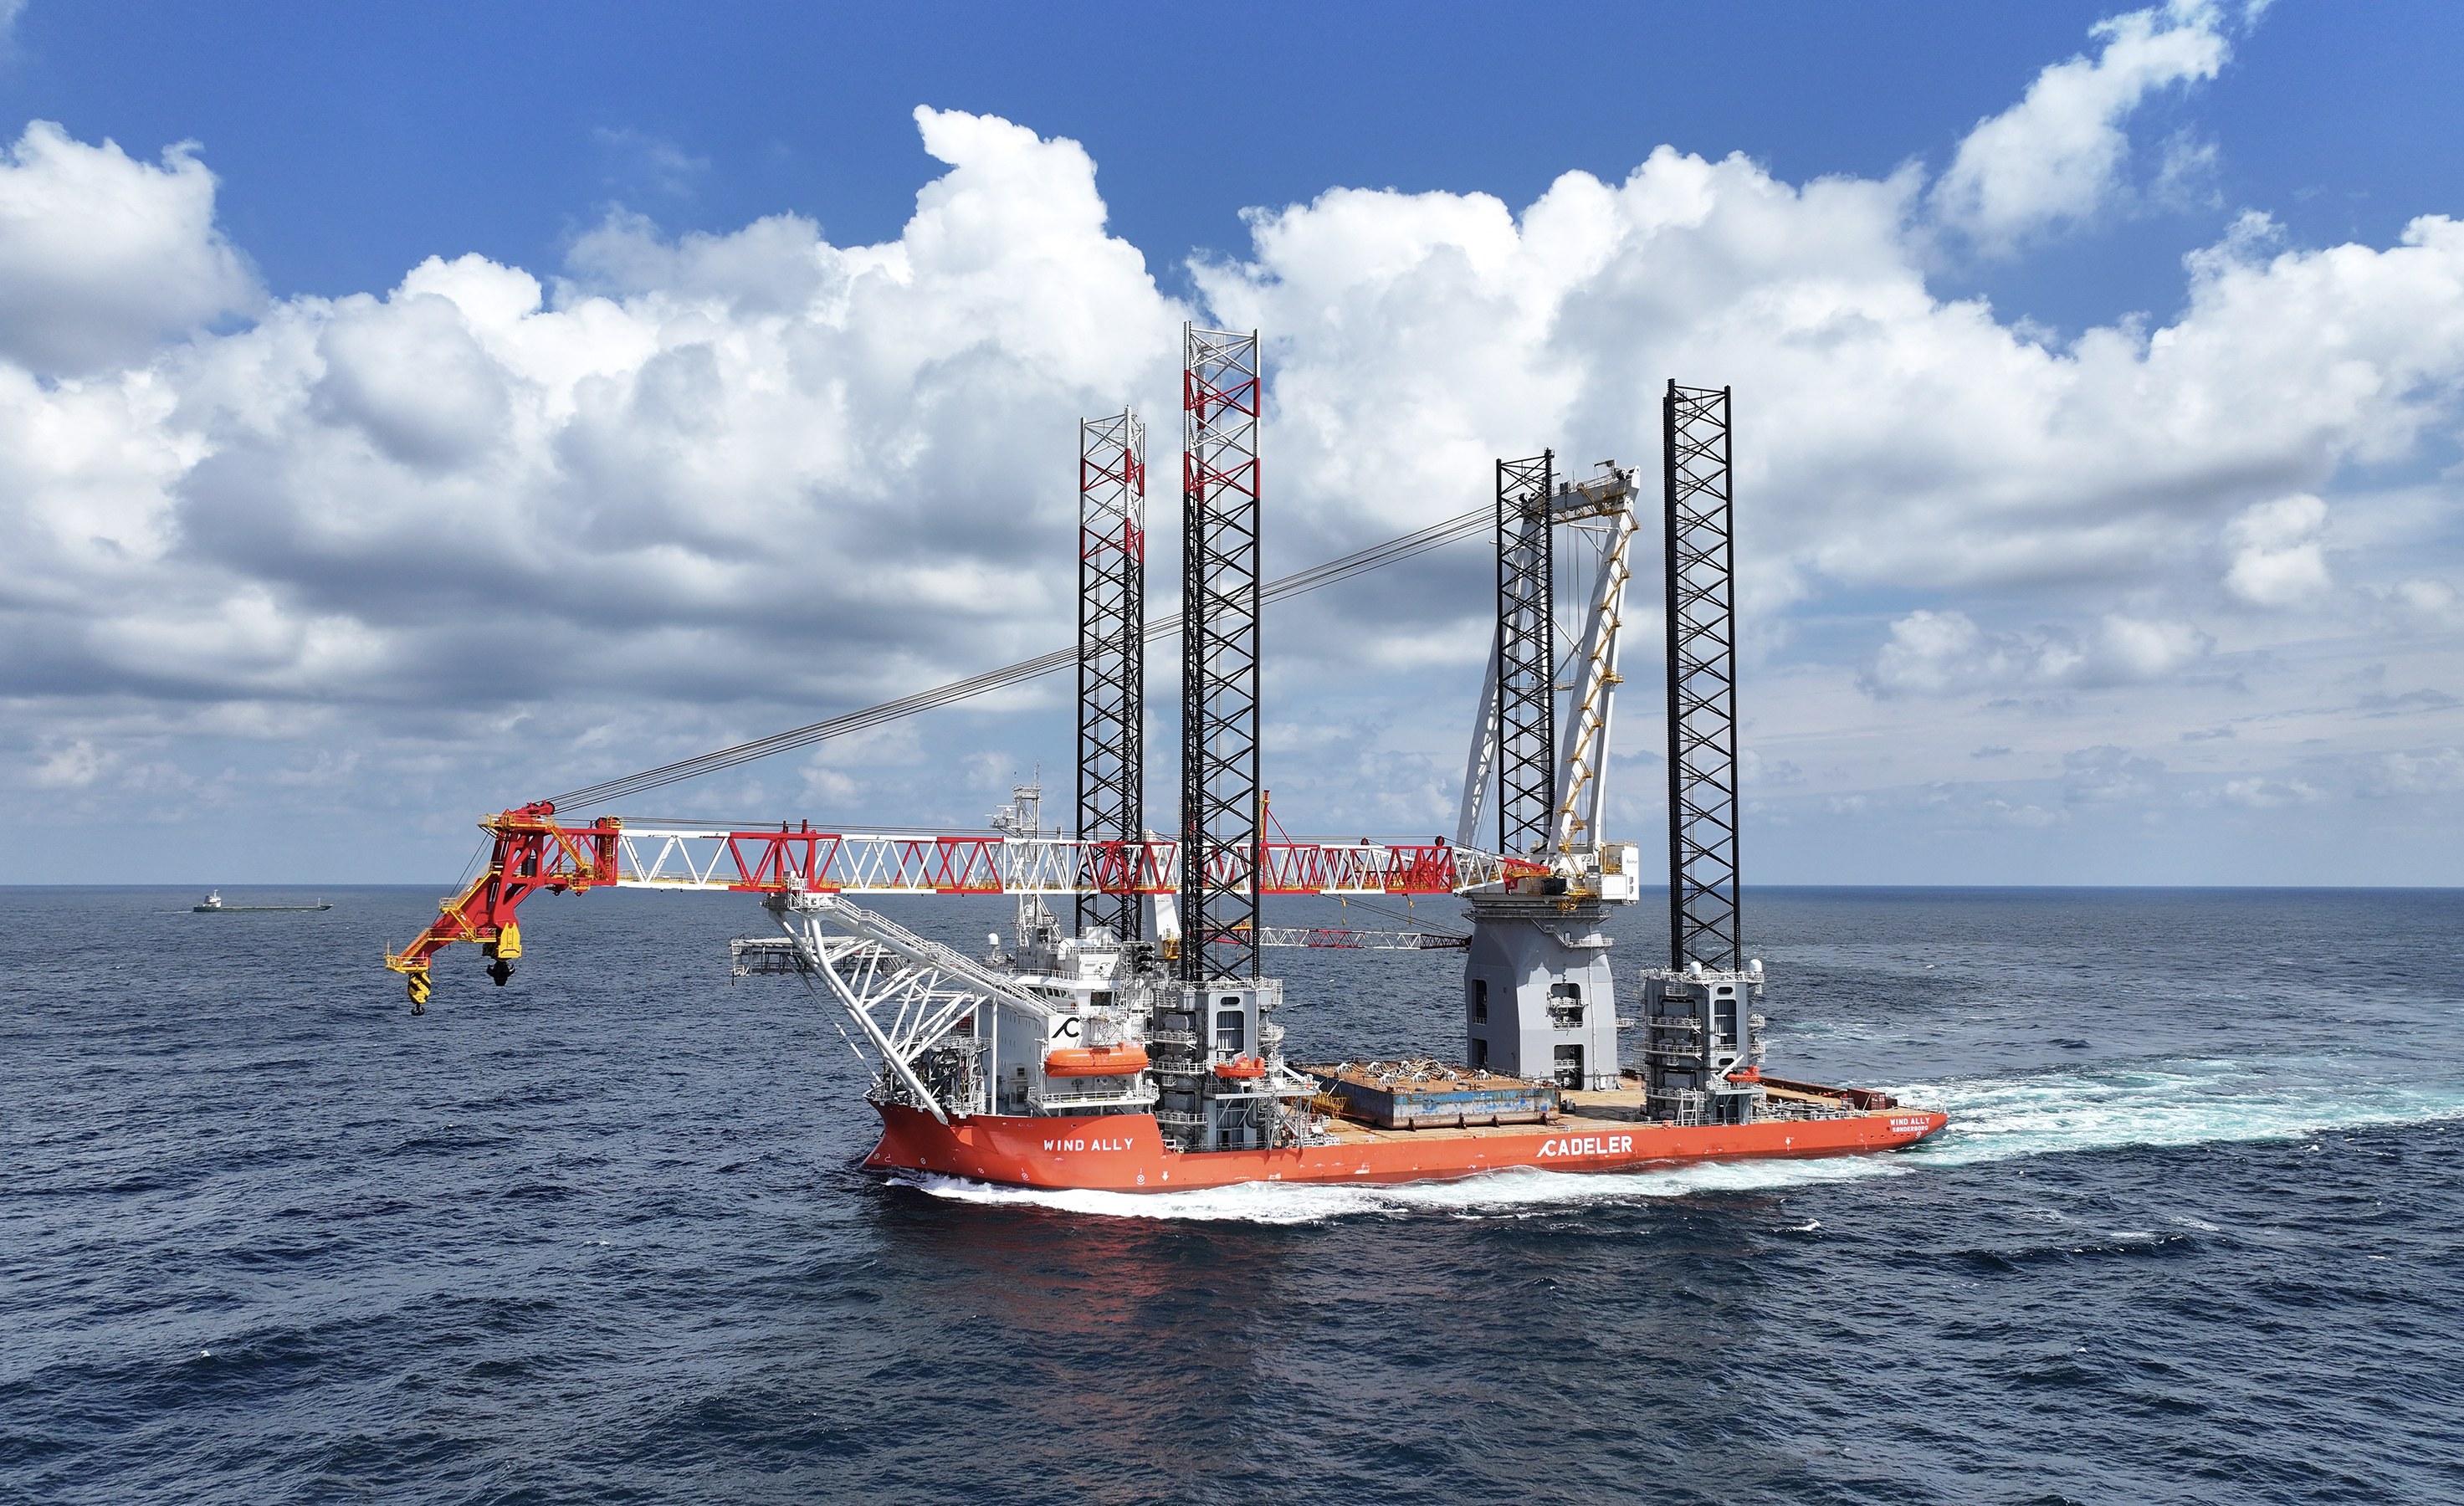
Note 1
General Information
Corporate information
Cadeler A/S (the “Company” or the “Group”) is incorporated and
domiciled in Denmark. The address of its registered office is Kalvebod
Brygge 43, DK-1560 Copenhagen, Denmark. The Company is listed
on the New York Stock Exchange (ticker: CDLR) and the Oslo Stock
Exchange (ticker: CADLR).
The Group is a global leader in offshore wind installation, operations,
and maintenance services headquartered in Copenhagen, Denmark.
The Group owns ten offshore jack-up Wind Turbine Installation
Vessels (WTIVs): Wind Orca, Wind Osprey, Wind Scylla, Wind Zaratan,
Wind Peak, and five vessels added during 2025, Wind Pace, Wind
Maker, Wind Keeper, Wind Ally and Wind Mover, the last of which
was delivered in December 2025. In addition to wind farm
installation, these vessels can perform maintenance, construction,
decommissioning, and other tasks within the offshore industry.
The consolidated financial statements of the Group are composed of
the Financial Statements of Cadeler A/S and its subsidiaries (which
are wholly owned by the Parent Company Cadeler A/S). For further
information on the subsidiaries of Cadeler A/S please refer to Note
29.
146
Note 2
Basis of Presentation and other significant accounting policies
2.1. Basis for preparation
The consolidated financial statements included in this Annual Report
have been prepared in accordance with IFRS Accounting Standards
(IFRS) as issued by the International Accounting Standards Board
(IASB) and as endorsed by the EU, as well as further requirements in
the Danish Financial Statements Act.
The preparation of these consolidated financial statements in
conformity with IFRS requires management to exercise its judgement
in the process of applying the Company’s accounting policies. It also
requires the use of certain critical accounting estimates and
assumptions. Areas involving a higher degree of judgement or
complexity, or areas where estimates and assumptions are significant
to the consolidated financial statements are further described in Note
2.4.
The consolidated financial statements are presented in euros and all
values are rounded to the nearest thousand, except when otherwise
indicated.
The accounting policies set out in the notes have been applied
consistently in the preparation of the consolidated financial
statements for all the years presented unless stated otherwise below.
Comparative figures
In December 2023, Cadeler and Eneti merged, and from this point in
time the consolidated figures comprised Cadeler A/S and its
subsidiaries and Eneti and its subsidiaries (which are wholly owned by
the Group). Therefore the activity of the Group is not fully
comparable between 2025, 2024 and 2023. For further information
on the subsidiaries of Cadeler A/S please refer to Note 29.
Materiality
Our Annual Report is structured around the principle of materiality,
focusing on information that holds relevance for the users of the
consolidated financial statements. These consolidated financial
statements encompass numerous transactions, which are grouped
into categories based on their nature or function. These categories
are then presented in the consolidated financial statements as
required by IFRS. When individual items are deemed immaterial, they
are combined with other similar items in either the consolidated
financial statements or the accompanying notes.
In line with IFRS guidelines we include the necessary disclosures,
unless the information is considered immaterial to the economic
decision-making of the users or is not applicable in the context of the
consolidated financial statements.
Going concern assessment
The Company’s Board of Directors and Executive Directors, have at
the time of approving the consolidated financial statements, assessed
that the Group has adequate resources to continue as a going
concern for at least 12 months after the balance sheet date.
Thus, the Group continues to adopt the going concern basis of
accounting in preparing the consolidated financial statements.
147
Note 2
Basis of Presentation and other significant accounting policies
Continued from previous page
European Single Electronic Format (ESEF)
As a group with securities listed on a regulated market within the EEA, Cadeler A/S is required to prepare
its official Annual Report in the XHTML format and to tag the main consolidated financial statements using
inline eXtensible Business Reporting Language (iXBRL) applying a specific ESEF taxonomy. The annual
report submitted to the Danish Financial Supervisory Authority consists of the XHTML document together
with the required technical files, all included in a ZIP file named cadeler-2025-12-31-en.zip.
As such, the Annual Report is both human- and machine-readable.
A separate assurance report on the iXBRL tagging of the consolidated financial statements is issued by
Cadeler's independent auditors and included on page 252. For general use, a PDF version of the Annual
Report is published in line with previous years.
2.2. General accounting policies
This section introduces accounting policies and significant accounting estimates and judgements. A more
detailed description of accounting policies and significant estimates and judgements related to specific
reported amounts is presented in the respective notes. The purpose is to provide transparency on the
disclosed amounts and to describe the relevant accounting policy, significant estimates and numerical
disclosure for each note.
Note 3 - Revenue recognition (including Deferred revenue)
Note 4 - Cost of sales and administrative expenses
Note 5 - Net other operating income and expenses
Note 6 - Employee compensation
Note 7 - Long term incentive programmes
Note 9 - Financial income and expenses
Note 10 - Income taxes
Note 11 - Earnings per share (EPS)
Note 12 - Intangible Assets (including Goodwill)
Note 13 - Property, plant and equipment (including Borrowing costs and Impairment of non- financial assets)
Note 14 - Right-of-use assets and lease liabilities
Note 15 - Inventories
Note 16 - Trade and Other Receivables
Note 18 - Cash and cash equivalents
Note 20 - Provisions, Trade and other payables
Note 22 - Issued Share capital
Note 23 - Lease liabilities
Note 24 - Derivatives and hedge accounting
Note 25 - Financial liabilities
Note 26 - Business combinations
148
Note 2
Basis of Presentation and other significant accounting policies
Continued from previous page
Principles of consolidation
The consolidated financial statements include the Parent Company,
Cadeler A/S, and all enterprises over which the Parent Company has
control. Control of an enterprise exists when the Company has
exposure, or rights to, variable returns from its involvement with the
enterprise and has the ability to control those returns through its
power over the enterprise. Accordingly, the consolidated financial
statements of the Group are composed of the financial statements of
the Company Cadeler A/S and its subsidiaries (which are wholly
owned by the Parent Company, Cadeler A/S).
All intra-group assets and liabilities, equity, income, expenses and
cash flows relating to transactions between Group enterprises are
eliminated in full on consolidation.
Currency translation
The financial statements are presented in euro (EUR), which is also
the functional currency of the parent company. For each entity in the
Group, the Group determines the functional currency and items
included in the financial statements of each entity are measured
using that functional currency.
As of 1 January 2025, all entities of the former Eneti Group have
changed their functional currency from USD to EUR. The change is
driven by Cadeler’s acquisition of the former Eneti Group at the end
of 2023 followed by changes to the financing, organisation and
activities whereby it is Management’s assessment that the primary
economic environment in which each of the entities operates has
changed to be mainly denominated in EUR. Accordingly,
management has determined that EUR is the new functional currency
that will most faithfully reflect the underlying transactions, events and
conditions relevant to the entities following the acquisition. The
amount recognised in other comprehensive income is not reclassified
to profit or loss until disposal of the operation.
As some of the Group entities are conducting business in an
international environment, management has applied judgement to
determine the primary economic environment considering that the
underlying transactions, events and conditions.
Transactions in a currency other than the EUR (“foreign currency”) are
translated into EUR using the exchange rates at the dates of the
transactions. Foreign exchange differences resulting from the
settlement of such transactions and from the translation of monetary
assets and liabilities denominated in foreign currencies at the closing
rates at the balance sheet are recognised in profit or loss. Non-
monetary items measured at fair values in foreign currencies are
translated using the exchange rates at the date when the fair values
are determined.
Foreign exchange gains and losses impacting profit or loss are
presented in the statement of profit or loss within financial income or
financial expenses.
Other reserves and retained earnings
Other reserves include hedging reserves, cost of hedging reserves,
and foreign currency translation reserves. Hedging reserves reflect
the changes in the fair value of derivative financial instruments
designated as cash flow hedges. Cost of hedging reserves include the
time value of options and other costs associated with hedging
activities. Foreign currency translation reserves include the cumulative
translation adjustments (CTA), which arise from the conversion of the
financial statements of foreign operations into the reporting currency.
Retained earnings include results from previous periods, changes to
equity arising from business combination purchase price, and share-
based payments.
Statement of cash flows
The statement of cash flows shows the Group’s cash flows for the
year, classified as operating, investing and financing activities, net
changes for the year in cash and cash equivalents as well as the
Group’s cash and cash equivalents at the beginning and end of the
year.
Positive amounts indicate cash inflows, whereas negative amounts
indicate cash outflows.
149
Note 2
Basis of Presentation and other significant accounting policies
Continued from previous page
Cash flows from operating activities
Cash flows from operating activities are stated as the profit or loss for
the year adjusted for non-cash operating items such as depreciation,
changes in working capital and income tax paid or received. Working
capital includes current assets less current liabilities, excluding cash
and cash equivalents and interest income.
Cash flows from investing activities
Cash flows from investing activities comprise cash flows from the
acquisition and sale of non-current assets and businesses. Cash flows
from restricted cash are presented within investing activities.
Cash flows from financing activities
Cash flows from financing activities comprise cash flows from
instalments on lease liabilities, and interest paid as well as proceeds
from the issue of shares, restricted cash, treasury shares and debt as
well as the prepayment of borrowings.
2.3. Changes in accounting policies and disclosures
2.3.1. New accounting policies and disclosures
The Group has adopted standards and interpretations effective as of
1 January 2025. Adoption of new, amended standards and
interpretations had no material impact on the Group’s consolidated
financial statements.
2.3.2. Standards issued but not yet effective
IASB has issued several new and amended accounting standards
(IFRS) and interpretations (IFRS IC). The Group has assessed these
new and amended accounting standards and interpretations, and
does not anticipate any of them to have any material impact on
recognition or measurement in the consolidated financial statements.
IFRS 18 Presentation and Disclosure in Financial Statements, which
was issued in April 2024, becomes effective for reporting periods
beginning on or after 1 January 2027 and replaces IAS 1 Presentation
of Financial Statements.
The implementation will affect the presentation of the consolidated
statement of profit or loss with the introduction of specified
categories and specified sub totals. The changed presentation will
result in certain items being classified differently, such as foreign
exchange adjustments and interest income. These items will be
classified in the category as the related income and expense arise,
e.g. foreign exchange adjustments related to accounts payables or
receivables will be classified in the operating category and interest
income and foreign exchange adjustments arising from cash and
cash equivalents will be classified in the investing category. The
reported net results will not be affected. The implementation is also
expected to impact the presentation of statement of financial
position with goodwill being presented as a separate line item, the
starting point of the statement of cash flows changing to operating
profit or loss and the disclosures related to management defined
performance measures (MPM).
The Group is currently working to further identify and analyse the
implications on the consolidated financial statements. Our
interpretation of the application may evolve as additional guidance
will become available.
The Group expects to adopt the accounting standards and
interpretations as they become mandatory.
2.4. Material accounting judgements, estimates and
assumptions
The preparation of the Group’s consolidated financial statements
requires management to make judgements, estimates and
assumptions that affect the reported amounts of revenue, expenses,
assets and liabilities, accompanying disclosures, and the disclosure of
contingent liabilities. Uncertainty about these assumptions and
estimates could result in outcomes that require a material adjustment
to the carrying amount of assets or liabilities affected in future
periods.
The key assumptions concerning the future and other key sources of
estimation uncertainty at the reporting date that have a significant
risk of causing a material adjustment to the carrying amounts of
assets and liabilities within the next financial year are described
below. The Group has based its assumptions and estimates on
parameters available when the consolidated financial statements
were authorised for issuance. Existing circumstances and assumptions
about future developments, however, may change due to market
changes or circumstances that are beyond the control of the Group.
Such changes are reflected in the assumptions when they occur.
150
Note 2
Basis of Presentation and other significant accounting policies
Continued from previous page
Material estimates
Useful life of vessels
The estimation made regarding the useful life of the O-class vessels
has been based on, among other things, an analysis made by an
external expert. The determined fatigue analysis is based on the
technical specification of the WTIV and comparable vessels. The
useful life of the vessels is estimated at 25 years.
In 2020, the Group acquired the above mentioned vessels which had
already been in use for eight years. Therefore, the remaining useful
life of these vessels is estimated at 17 years for all components except
the jacking system and the main crane. These components have a
remaining useful life of three years from the acquisition of the vessels.
In 2024, the main crane of these vessels underwent an upgrade. The
old main crane was disposed of, and the new main crane was
capitalised, with its useful life set to align with the remaining useful
life of the vessels.
In 2023, as part of the business combination, the Group acquired two
additional vessels. One of these vessels was delivered in 2015 and the
other in 2012. Similar to the vessels acquired in 2020, the estimated
useful life of these vessels, 25 years when first acquired, depends on
initial delivery. Therefore, their remaining useful lives at acquisition
date were assessed to be 17 and 14 years respectively, and all
components will have the same useful life. Depreciation will be
calculated over the remaining useful life of these vessels.
The estimation made regarding the useful life of New Builds has been
based on an internal technical analysis based on the technical
specification of the vessel and validated by an external expert. The
useful life of each New Build Vessel is estimated at 25 years.
The residual value, useful life, and methods of depreciation of
property, plant, and equipment are reviewed at each financial year
end and adjusted accordingly, if appropriate. No changes were made
during 2025. For further information, refer to Note 13.
Income tax
Pillar Two tax effects
In October 2021, more than 130 countries agreed on a two-pillar
approach to reform the international tax system. The Pillar Two rules
are designed to ensure that multinational corporations with EUR 750
million or more in annual revenue pay a minimum effective corporate
tax rate of 15% on income received in each jurisdiction in which they
operate.
The principal jurisdictions in which the Group may be exposed to
additional taxation under Pillar Two include Denmark, the United
Kingdom, and Cyprus, all of which have enacted legislation
implementing these rules. However, this legislation does not currently
apply to the Group, as its consolidated revenue is lower than EUR 750
million.
The Group continues to assess and monitor the potential future
impact of the Pillar Two rules on its business. Based on the Group’s
initial assessment, a portion of its future income in these jurisdictions
may be subject to top-up tax under the new rules, noting that
international shipping income is excluded from the calculation of
GloBE income under Pillar Two, and certain other exclusions may also
apply.
151
Note 2
Basis of Presentation and other significant accounting policies
Continued from previous page
Impairment of non-financial assets
Management is responsible for the identification of internal and
external indicators of impairment related to non-financial assets. If an
indicator of impairment is identified, assessment of whether an
impairment test is required will be conducted.
The recoverable amount depends on the fair value less cost of
disposal, and the value in use which is impacted by the discount rate
used in the DCF model as well as future cash in-flows and growth
rate assumptions. For further information please refer to Note 12.
Material judgements
Identification of CGU for the purpose of goodwill impairment
For the purpose of goodwill impairment, management has assessed
that Cadeler has two cash generating units (CGUs), consisting of:
•the transport and installation of wind turbine generators
and foundation installation vessels (WTGFIVs) and
•O&MV
The wind turbine generators and foundations vessels (WTGFIV) CGU
is comprised of the Cadeler vessel class covering the O-Class, P-Class,
M-Class and A-Class and Wind Scylla vessels, which are largely
interchangeable, and the cash flows generated by them are
interdependent. These vessels are operated collectively, employed
interchangeably, and actively managed to meet the needs of our
customers in that market. The O&M CGU is comprised of the two
vessels Wind Zaratan and Wind Keeper, which have different
specifications and generate cash flows that are independent and
separable from the other vessels.
Revenue recognition
Judgement is applied when determining whether a contract contains
one or more performance obligations. Judgement is applied as
complexities arise when multiple types of promises to the customer
are bundled.
Evaluating the criteria for revenue recognition requires
management's judgement to identify and assess the performance
obligations within a contract. This includes assessing the nature of
performance obligations and whether they are distinct or should be
combined with other performance obligations to determine whether
the performance obligations are satisfied over time or at a point in
time.
In contracts where multiple activities are bundled, judgement is
applied in the determination of the most appropriate recognition
method and the most appropriate measure of progress. Both
judgements have a primary impact on the timing and amount of
revenue to be recognised.
152
Note 2
Basis of Presentation and other significant accounting policies
Continued from previous page
Evaluating the application of the criteria for revenue recognition for
contracts with customers requires management's judgement to
assess and determine the following:
•Identification of performance obligations within the
contract, including assessing their nature and determining
whether they are distinct or should be combined, as well as
whether they are satisfied over time or at a point in time.
•Determination of the transaction price, including an
assessment of variable consideration in the contract.
•In contracts where multiple performance obligation are
bundled, the allocation of the transaction price to
performance obligations in order to determine the stand-
alone selling price of each performance obligation identified
in the contract using key assumptions that may include
observable market inputs and expected margin in the
activities.
Macroeconomic factors and climate risks
As part of its commitment to transparency and risk management,
Cadeler recognises the significance of macroeconomic factors and
climate risks in financial evaluations. These factors are integral to
assessing the useful lives and residual values of assets and
conducting Discounted Cash Flow (DCF) analyses for impairment
testing. Operating within the offshore wind installation sector,
Cadeler’s fleet supports the energy transition, a key driver of long-
term demand.
Management has evaluated climate-related risks, including regulatory
developments, technological advancements, and market shifts, and
does not currently identify indicators requiring changes to the
Group’s depreciation assumptions, residual values, or impairment
outlook. The Group’s vessels are designed to accommodate evolving
industry requirements, mitigating the risk of obsolescence from
climate policies or emissions regulations.
Cadeler’s assessment considers potential financial impacts of climate-
related risks, including operational disruptions from extreme weather,
supply chain vulnerabilities, and shifting industry standards. While
climate risks could influence project timing or infrastructure
investments, there is no evidence suggesting a material impact on
asset valuations. The useful life of the Group’s vessels is reviewed
regularly considering emerging industry trends, and current market
conditions support the expectation that our assets will continue to
generate economic benefits as planned. Additionally, ongoing
investments in modern, upgradeable vessels enhance adaptability to
future regulatory changes, further supporting our financial
assumptions.
Beyond climate risks, Cadeler monitors broader macroeconomic
conditions, including inflationary pressures, interest rate fluctuations,
and geopolitical uncertainties that may impact operations. The
international macroeconomic situation is currently characterised by
material uncertainty, mainly due to the elevated levels of public debt
in many of the leading global economies, increasing interest and
inflation rates, the war in Ukraine, the imposition of sanctions against
Russia, conflict in the Middle East, European energy crises and global
supply-chain constraints. Over the past year, the sector has
experienced continued negative sentiment and political headwinds in
the United States. The energy sector remains subject to volatility due
to regulatory shifts, oil prices and economic developments, and we
remain proactive in integrating these factors into financial
evaluations. Through continuous assessment and review, we ensure
that our accounting policies reflect a comprehensive understanding
of macroeconomic and climate-related risks, maintaining a robust
approach to financial reporting and impairment analyses. For further
information on the risks to which Cadeler is exposed, refer to the
Financial review.
153
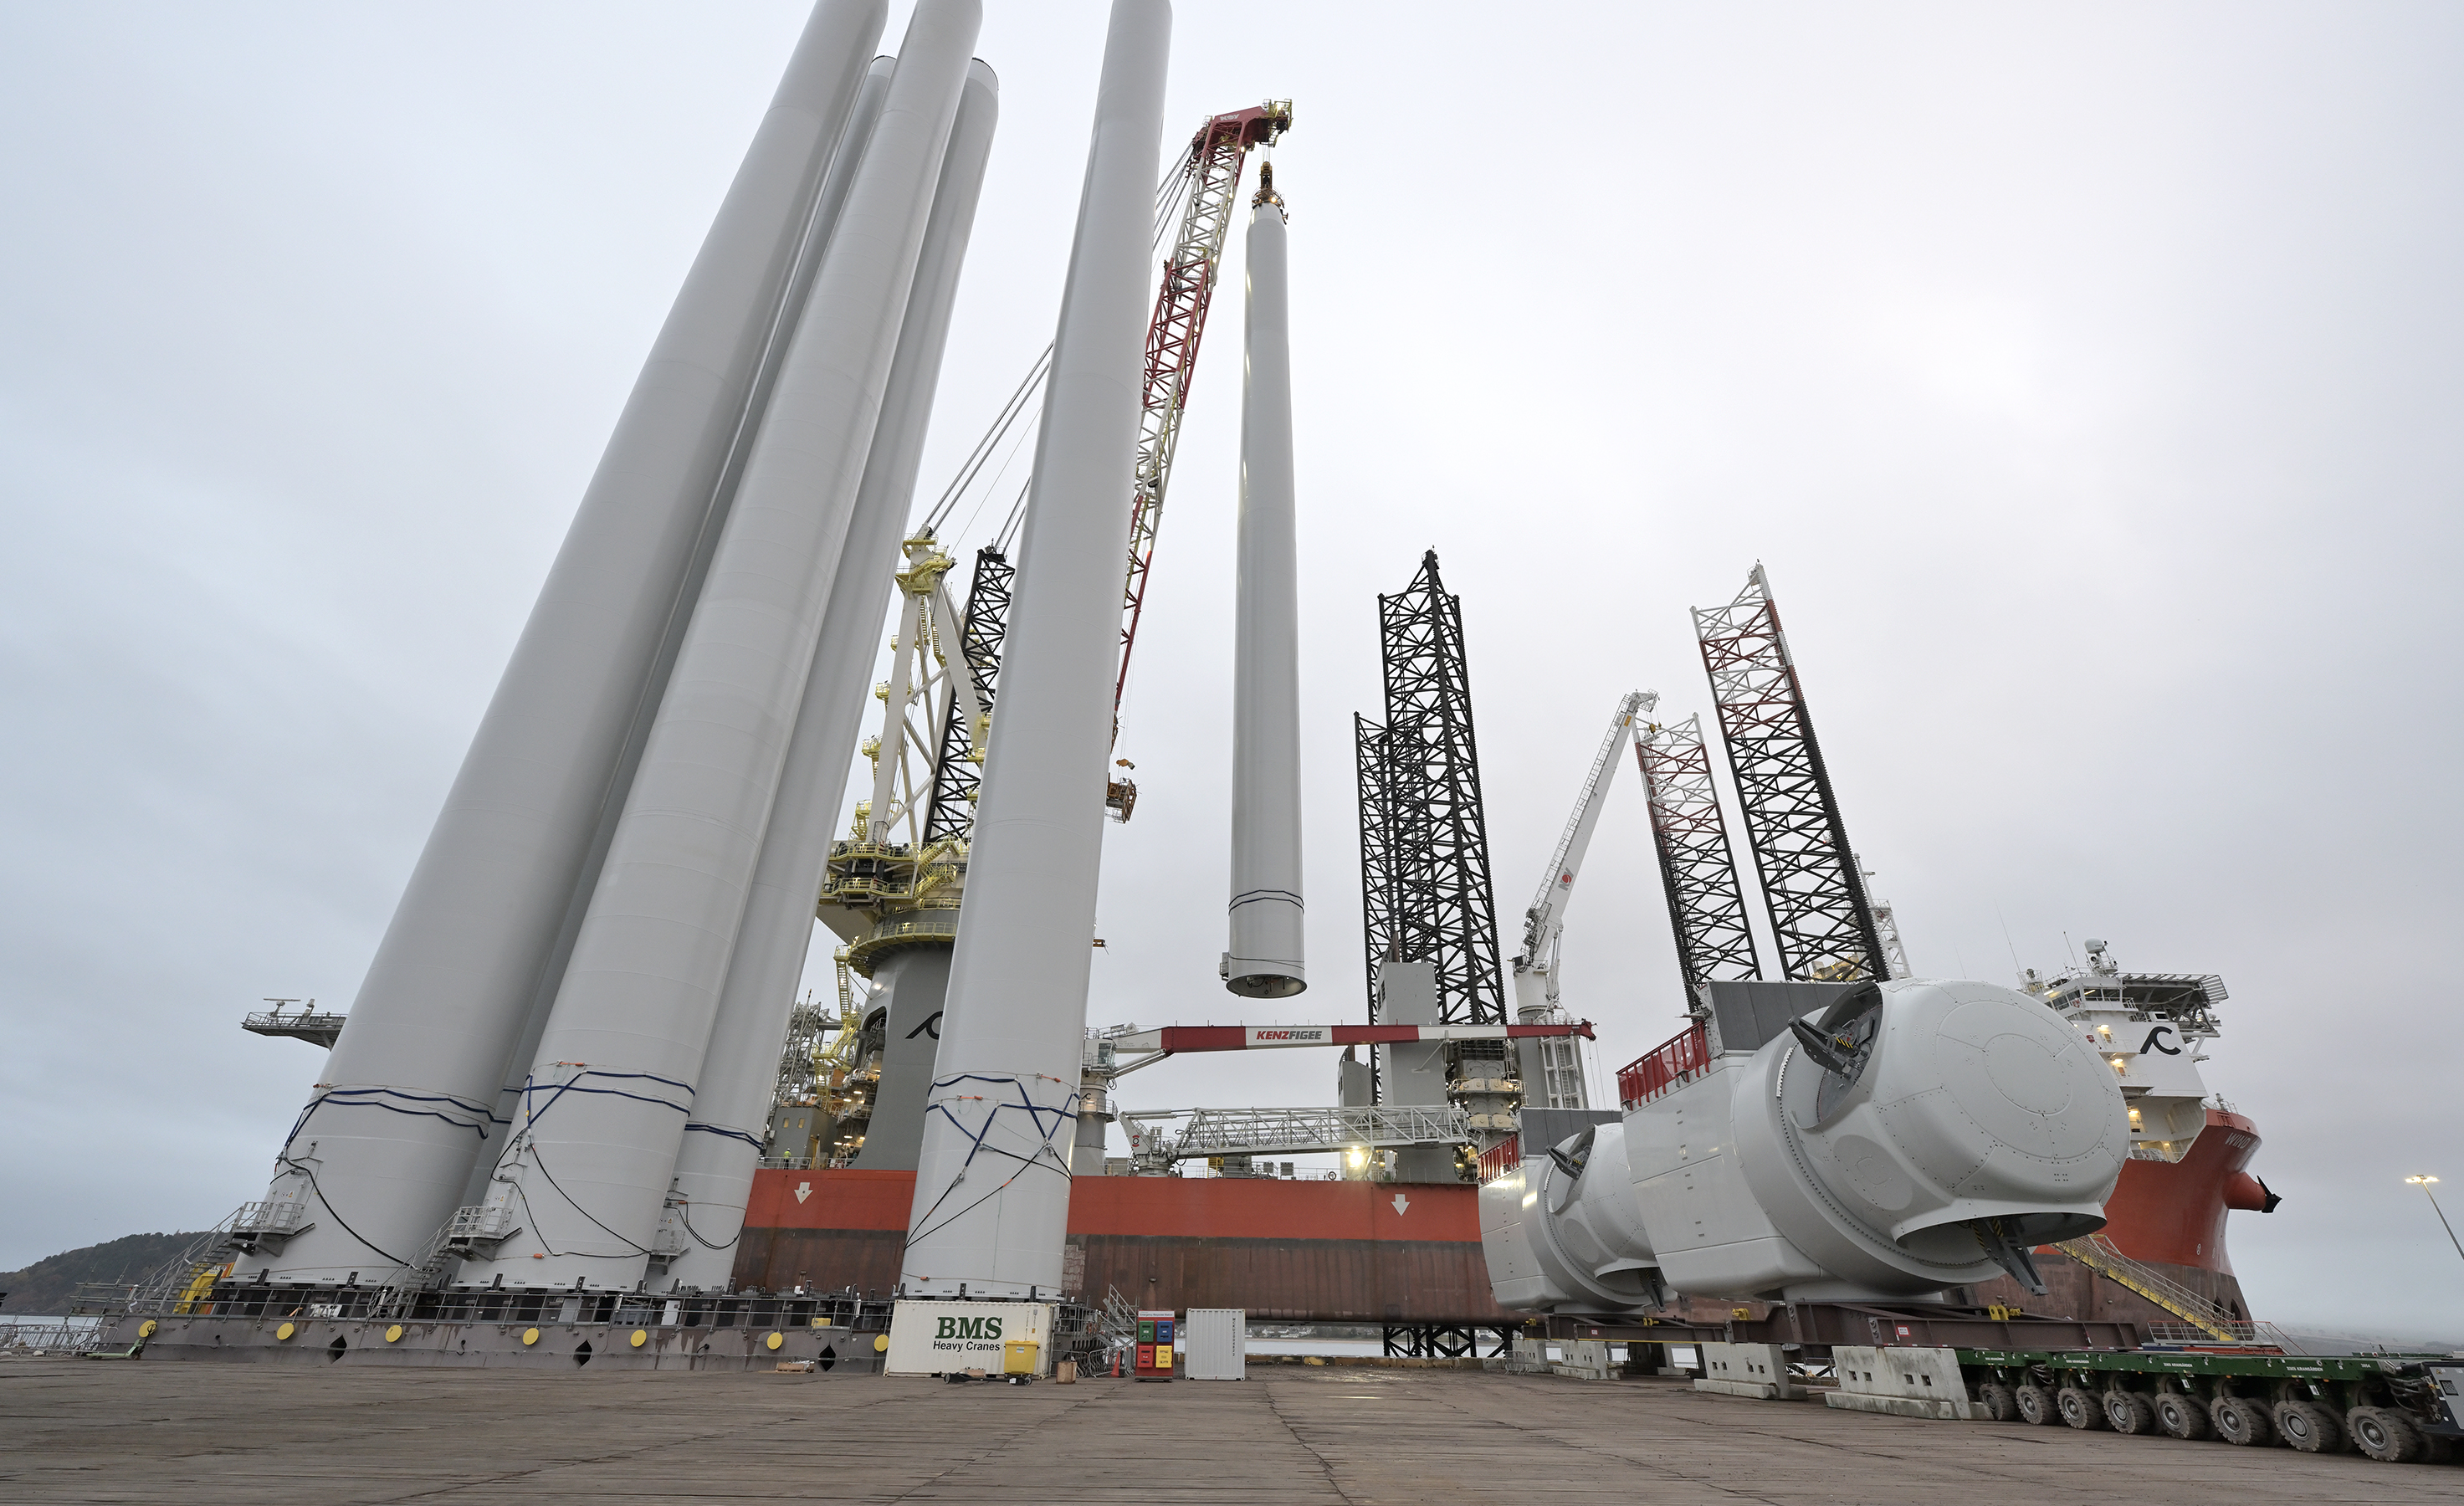
Note 3
Revenue
The Group is a leading supplier to the offshore wind industry,
specialising in T&I and O&M services rendered to customers in Europe,
Asia, and the United States. The Group owns and operates the world's
largest, most advanced, and most flexible fleet of wind turbine transport
and installation vessels.The Group’s revenue is dependent on project
contracts and vessel charters for the employment and utilization of the
vessels. The customers are typically major project developers or energy
companies that operate globally, and the current order backlog spans a
number of years. Refer to separate information on major customers and
order backlog below. The Group has operated nine vessels compared
to five operating vessels in 2024. The increase in the number of
operating vessels in 2025 compared to 2024 is the main driver for
increased revenue.
The Group derives its revenue from fees charged to our customers for
the use of our vessels and related services. The Group’s contracts with
customers comprises the following main revenue generating activities:
Time-charter activities represents revenue earned from time charter
contracts and time charter related activities. Revenue from time
charter hire services are contracts with customers where the Group
utilizes its vessels, equipment and crew to deliver a service to the
customer normally based on either a fixed day rate or milestone
deliverables. Contracts may also include other promises such as
mobilization and demobilization, provision of bunker services,
catering and accommodation.
Transportation and installation activities (T&I) represents contracts
with customers where the Group utilises its vessels, equipment and
crew to perform the transportation and installation of offshore wind
turbine foundations as well as heavy lifting operations,
decommissioning and planning and engineering.
Other revenue represents cost recharges and other personnel
services revenue, as well as early termination fees by customers.
154
Note 3
Revenue
Continued from previous page
Disaggregation of revenue from contracts with customers by activity
The following table provides information about disaggregated revenue.
EUR'000 | 2025 | 2024 | 2023 |
Revenue disaggregation | |||
Time charter services and transportation and installation services | 490,454 | 226,545 | 99,841 |
Other revenue, including fees earned for early termination of contracts by customers | 129,900 | 22,193 | 8,781 |
Total revenue | 620,354 | 248,738 | 108,622 |
Balance of other revenue primarily includes fees earned for early termination of contracts by customers in
2025 includes the receipt of termination fees under a Long-Term Agreement (LTA).
We have determined that our contracts - in general - contain a lease component and, therefore, we
separately disclose revenues associated with the lease and service components of our contracts. For the
year ended 31 December 2025, the lease component, included within time charter services and
transportation and installation services, amounts to EUR 194 million (2024: EUR 85 million; 2023: EUR
79 million). The lease component is calculated by applying the estimated bareboat charter day-rate to the
on-hire days.
Operating segments and geographical information
Operating segments
The Group’s nine windfarm installation vessels (WFIVs) operate in a global market and are often redeployed
to different regions due to changing customers or contracts. Accordingly, the Group reports its operations
as a single reportable segment.
Geographical revenue split
The following table presents financial information by country and region based on the location of the
service provided. Individual countries are shown if they are above 10% of revenue.
EUR'000 | 2025 | 2024 | 2023 |
Total revenue by country and region | |||
Denmark | 102,466 | 51,071 | 5,431 |
UK | 131,679 | 68,511 | 48,880 |
Germany | 60,439 | — | — |
Poland | 58,512 | — | — |
Rest of Europe | 3,575 | 4,983 | 54,311 |
Europe | 356,671 | 124,565 | 108,622 |
United States | 140,612 | 87,958 | — |
Americas | 140,612 | 87,958 | — |
Taiwan | 123,071 | 36,215 | — |
Asia | 123,071 | 36,215 | — |
Total Revenue | 620,354 | 248,738 | 108,622 |
155
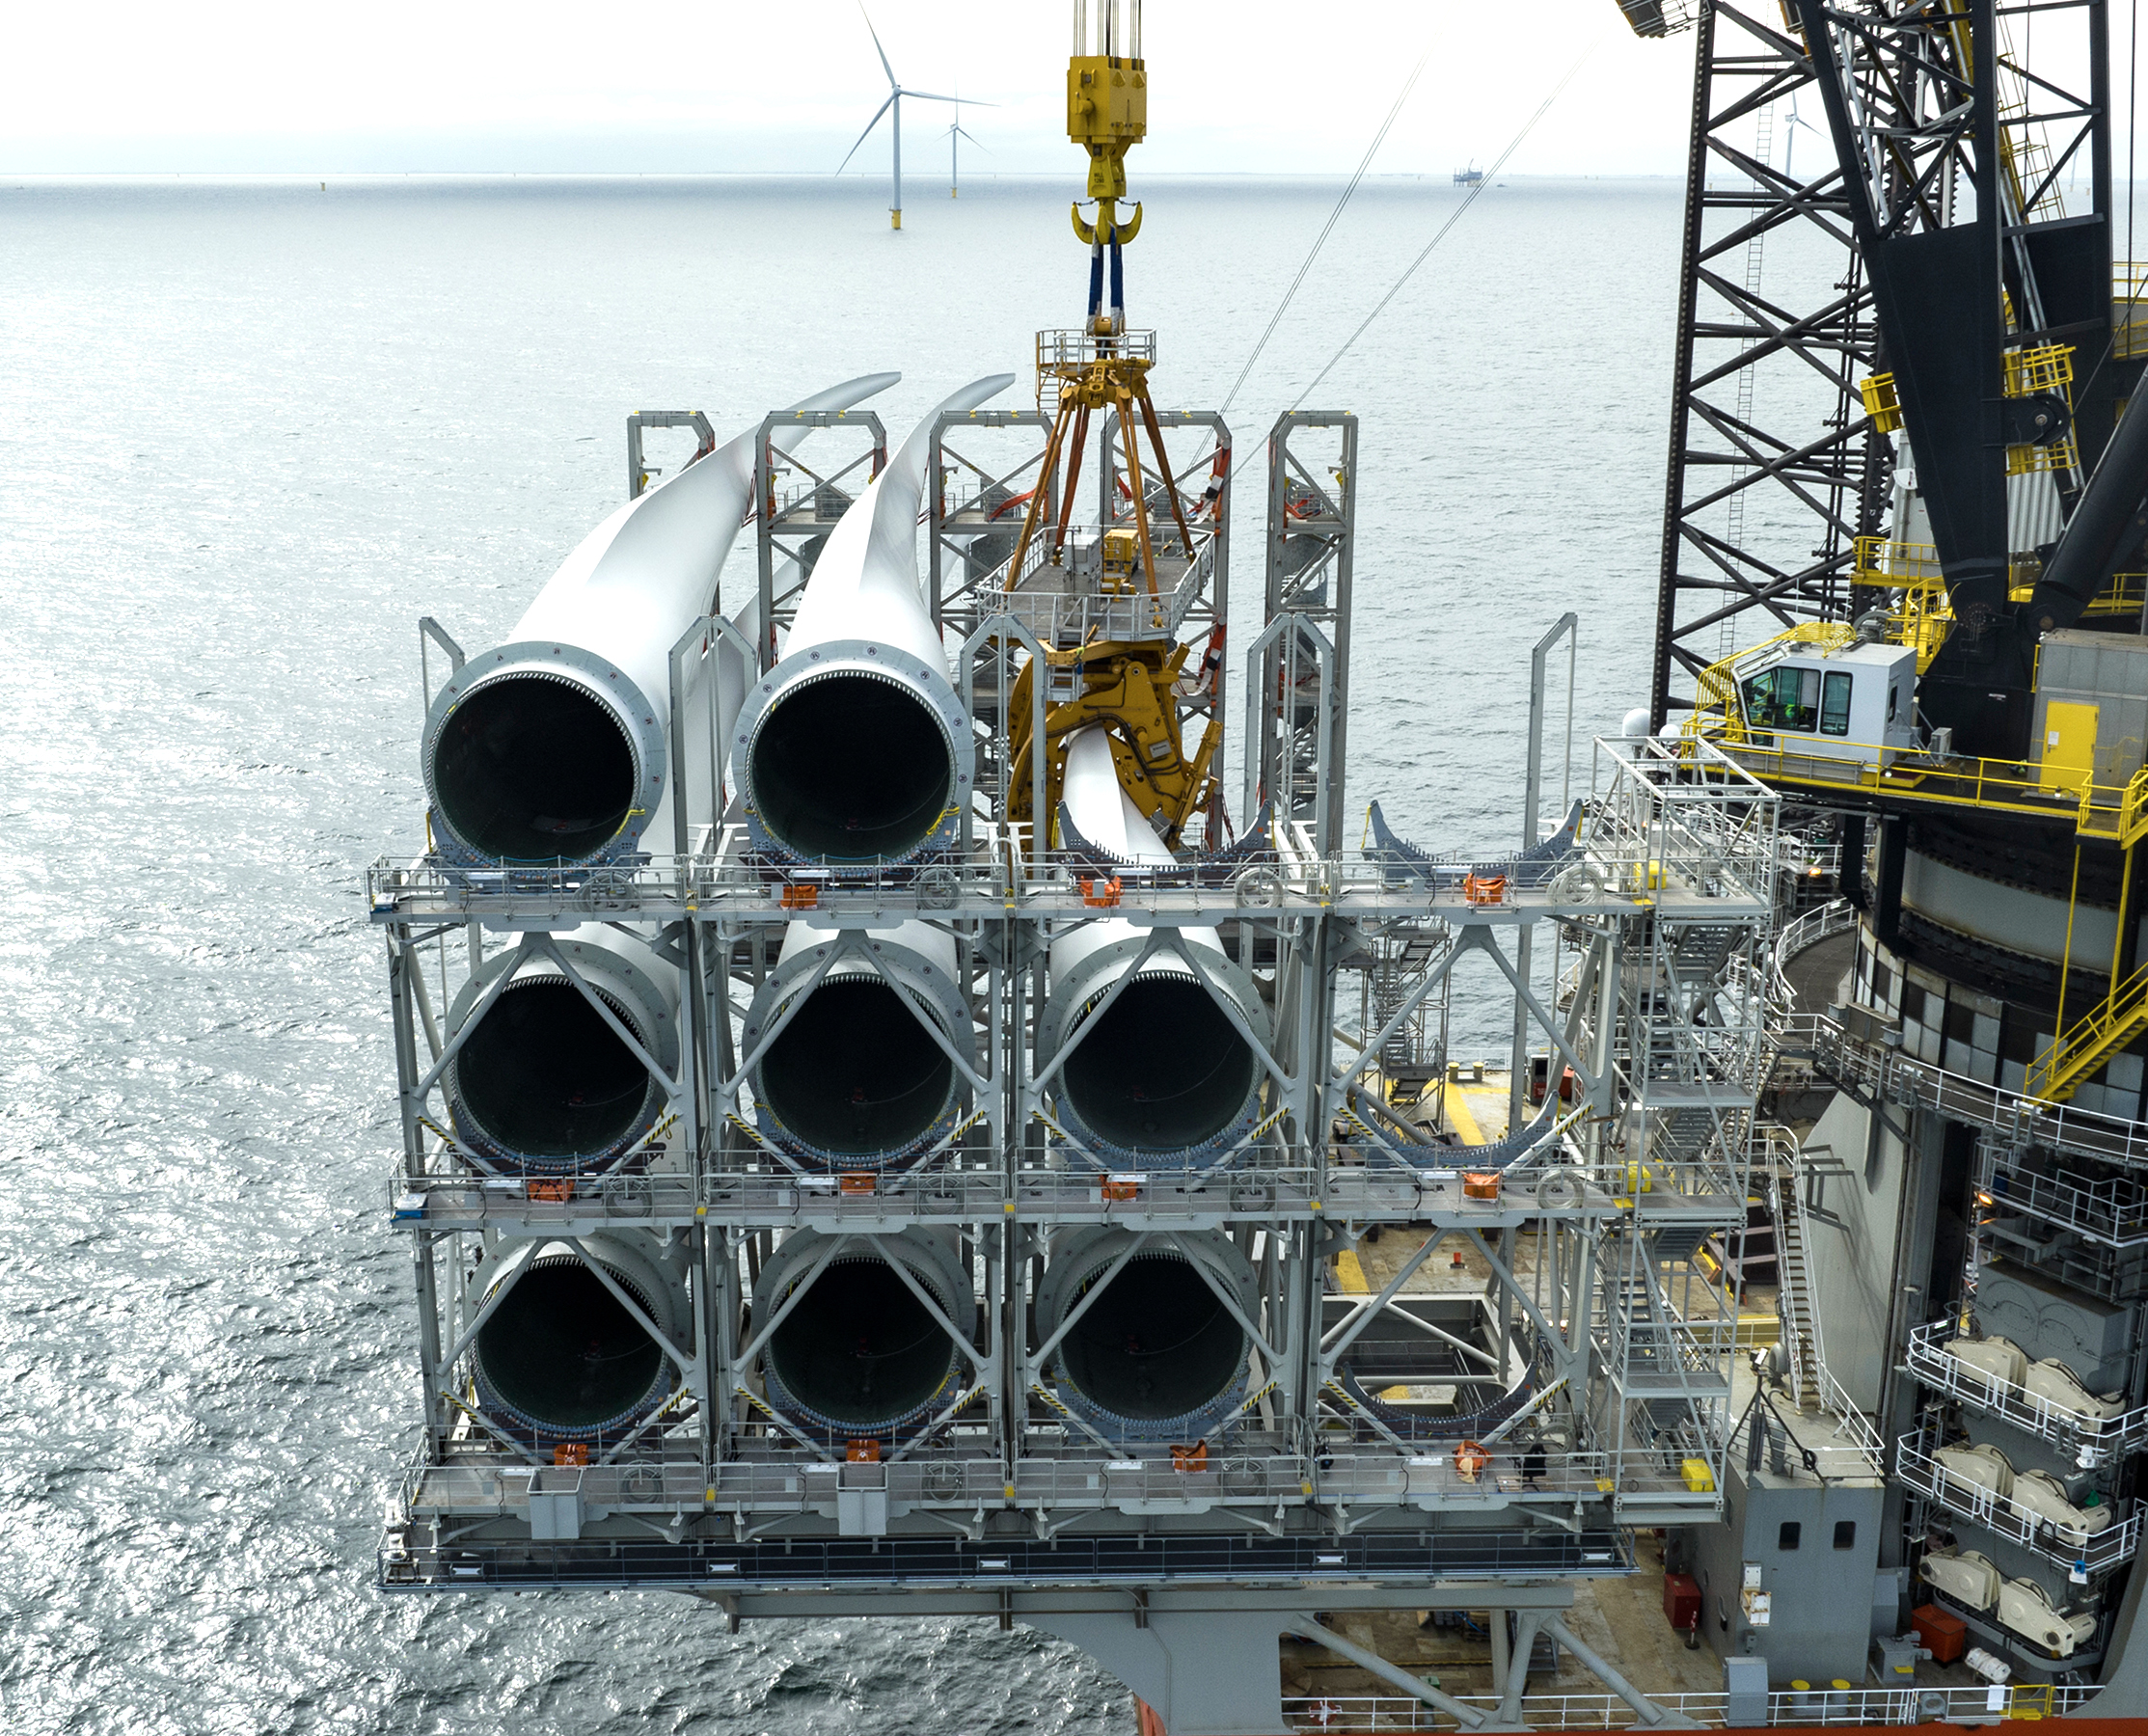
Note 3
Revenue
Continued from previous page
Major customers
For the year ended 31 December 2025, revenue from 3 customers each exceeded 10% of total revenue. The
revenue derived from these three customers was EUR 312 million, EUR 110 million, EUR 72 million respectively.
For the year ended 31 December 2024, revenue from four customers each exceeded 10% of total revenue.
The revenue derived from these four customers was EUR 60 million, EUR 58 million, EUR 56 million and
EUR 36 million respectively.
For the year ended 31 December 2023, revenue from three customers each exceeded 10% of total revenue.
The revenue derived from these three customers was EUR 44.5 million, EUR 28.5 and EUR 22.7 million
respectively.
Non-current assets by geography
The Company’s non-current assets (excluding derivatives) are based on domicile of the legal entity
ownership in the following countries/regions:
EUR'000 | 2025 | 2024 | 2023 |
Non-current assets (excluding derivatives) by country and region | |||
Denmark (country of domicile) | 395,881 | 491,463 | 430,878 |
UK | 1,158,396 | 499,070 | 369,594 |
Cyprus | 1,346,002 | 663,174 | 217,788 |
Rest of Europe | 679 | — | — |
Total Europe | 2,900,958 | 1,653,707 | 1,018,260 |
Japan | 81,780 | 88,083 | 86,484 |
Taiwan | 740 | 2 | 26 |
Total Asia | 82,520 | 88,085 | 86,510 |
United States | — | 14 | |
Total | 2,983,478 | 1,741,806 | 1,104,770 |
156
Note 3
Revenue
Continued from previous page
Contract backlog
The Group's order backlog including options as of 31 December 2025
amounts to EUR 2.8 billion (2024: EUR 2.3 billion; 2023: EUR
1.7 billion). EUR 846 million of the backlog pertains to contracts that
management expects to recognise in 2026, if all options are
exercised.
The Group's order backlog excluding options as of 31 December 2025
amounts to EUR 2.4 billion (2024: EUR 1.9 billion; 2023: EUR
1.4 billion).
Contract backlog for firm orders (as of reporting date)
The following table presents the aggregate amount of the revenues
expected to be realized in the future from partially or fully unsatisfied
performance obligations as we perform under the contracts. We
disclose both the value of firm contracts and a contract backlog
including options (non-GAAP measure). The values includes all new
contracts signed at the reporting date:
EUR million | Within 1 year | After 1 year | Total |
Contract Backlog | |||
Firm, excluding options | 764 | 1,627 | 2,391 |
Options considered as contingent considerations for revenue recognition purposes | 41 | 146 | 187 |
Options not considered as contingent considerations for revenue recognition purposes | 41 | 146 | 187 |
Total as of 31 December 2025 | 846 | 1,919 | 2,765 |
Firm, excluding options | 372 | 1,534 | 1,906 |
Options considered as contingent considerations for revenue recognition purposes | 28 | 187 | 215 |
Options not considered as contingent considerations for revenue recognition purposes | 28 | 187 | 215 |
Total as of 31 December 2024 | 428 | 1,908 | 2,336 |
Firm, excluding options | 176 | 1,201 | 1,377 |
Options considered as contingent considerations for revenue recognition purposes | 16 | 163 | 179 |
Options not considered as contingent considerations for revenue recognition purposes | 16 | 163 | 179 |
Total as of 31 December 2023 | 208 | 1,527 | 1,735 |
Total contract backlog represents estimated transaction price for unfulfilled performance obligations, including both fixed and variable
consideration. Options that are considered for revenue recognition purposes and options not considered for revenue recognition purpose,
represent 50% each of the variable portion of the backlog. Contract backlog excludes vessel reservation agreements. All contracts may be
subject to future modifications, and off-hire days, that might impact the amount and/or timing of revenue recognition.
157
Note 3
Revenue
Continued from previous page
Contract costs, assets and deferred revenue
Customers are typically invoiced monthly, when the vessels are on contract, with normal payment terms
between 30-60 days. Payment terms with customers are considered industry standard and do not include a
significant financing component. To the extent possible, we obtain payment guarantees to minimise the
credit risk during the contract term.
Sometimes revenue is recognised for work performed prior to issuance of invoice to customer and it will be
reported as a contract asset. For more information about contract assets at the reporting period, refer to
Note 16. When the right to consideration is conditional only on the passage of time, the balance does not
meet the definition of a contract asset and is classified as an unbilled receivable. This typically arises where
the timing of the related billing cycle occurs in a period after the performance obligation is satisfied.
Deferred revenue relates to consideration received from customers for unsatisfied performance obligations.
Revenue will be recognised when the related services are provided to the customers, which is almost
entirely within 12 months.
Incremental costs of obtaining a contract and certain costs to fulfil a contract to be recognised as a
contract asset if certain criteria are met. Any capitalised contract assets are amortised on a systematic basis
that is consistent with the transfer of the related goods or services to the customer.
EUR'000 | 2025 | 2024 | 2023 |
Beginning of financial year | 47,337 | 13,881 | 3,157 |
Acquisition of businesses | — | — | 1,913 |
Deferred during the period | 158,739 | 45,360 | 10,670 |
Recognised as revenue during the period | (46,459) | (11,928) | (1,859) |
Exchange differences | — | 24 | — |
Total deferred revenue at end of period | 159,617 | 47,337 | 13,881 |
Current | 128,716 | 45,590 | 12,103 |
Non-current | 30,901 | 1,747 | 1,778 |
158
Note 3
Revenue
Continued from previous page
Accounting policies for revenue from contracts with
customers
We initially assess whether the contracts contain a lease component.
In general, we have determined that our contracts consist of a leasing
component (the element relating to hire of the vessel) and a service
component. These components are not treated or priced separately
in the contracts, nor does the Group offer either of the services
separately. The service component is within the scope of IFRS 15,
while the leasing component is within the scope of IFRS 16. The lease
components are classified as an operating lease, as such leases do
not cover a significant part of the economic life of the vessels and the
Group retains substantially all risks and rewards incidental to
ownership of the vessels. The leasing component is recognised as
revenue over time over the charter period. Prepayments from
customers for the leasing component are recognised as deferred
revenue.
Once the service component has been determined to be within the
scope of IFRS 15, the Group performs the following five steps on a
contract-by-contract basis: (i) identify the contract(s) with a customer;
(ii) identify the performance obligations in the contract; (iii) determine
the transaction price; (iv) allocate the transaction price to the
performance obligations in the contract; and (v) recognise revenue
when (or as) the Group satisfies a performance obligation.
Our contracts with customers are complex and normally contains
multiple types of promises to the customer. At contract inception,
judgement is performed when determining if a contract contains one
or more performance obligations. The Group assesses the goods and
services promised within each contract and identifies as a
performance obligation each good or service that is distinct.
Revenue from transportation and installation activities may,
depending on the contract, represent one or more performance
obligations. In respect of T&I service components, the following main
promises apply: Planning and engineering, Transport of monopiles
and secondary steel from supply port to feeder port, Installation of
monopiles and secondary steel offshore, Storage and handling at
feeder port, and Warranty. While the contracts contain several
distinct promises, these are considered less interdependent and
interrelated and as such are considered multiple performance
obligations.
Revenue is generally recognised over time as the service is being
provided using a method, depending on what better depicts the
progress of each separate performance obligation, as detailed below:
Performance obligations in T&I contracts | Recognition of revenue | Measure of progress |
Planning and engineering services to the customer. | Over time | Total costs incurred to date compared with total forecast costs at completion |
Transportation of monopiles and secondary steel from supply port to feeder port | Over time | Total time spend compared with total forecast time |
Storage and handling of the material used in the installation | Over time | Total time spend compared with total forecast time |
Installation of monopiles and secondary steel offshore | Over time | Total time spend compared with total forecast time |
While time-charter contracts contain several promises, these are
usually considered highly interdependent and highly interrelated and
as such considered as one single performance obligation recognised
over time applying a relevant measured of progress, usually output
method based on time.
The Group is sometimes providing bunker procurement services to
help customers ensure that sufficient bunker is available to operate
the vessels at the right time and in the right quality and quantity.
Management’s assessment of whether a principal or agent
relationship exists is based upon whether the Group has the ability to
control the goods before they are transferred to the customer. This
assessment is performed on a contract-by-contract basis at contract
inception and takes into account various factors such as whether the
Group takes legal title of the bunker and has the ability to direct the
use of the bunker. The fees earned are recognized as revenue over
the service period.
Revenue is recognised when control of the services is transferred to
the customer at an amount that reflects the consideration to which
the Group expects to be entitled in exchange for those services.
Revenue is recognised in the amount of the transaction price that is
allocated to the respective performance obligations when (or as) the
performance obligation is satisfied.
Variable consideration, for example in respect of weather days and
extension of time, steel price or bunker price etc, is constrained at
contract inception to the extent that it is highly probable that a
significant reversal in the amount of cumulative revenue recognised
will not occur when the uncertainty associated with the variable
consideration is subsequently resolved.
The Group provides warranties for repair of defects which are
identified during the contract and within a defined period thereafter.
In general, all are assurance-type warranties, as defined within IFRS
15, which the Group recognises under IAS 37. Compensation
received, or receivable, for early termination are recognised as
revenue with deferral of an estimated value of any obligations to
standing ready for new engagements in the remaining contract
period.
159
Note 4
Operating Expenses
EUR'000 | Note | 2025 | 2024 | 2023 |
Cost of sales | ||||
Right-of-use asset depreciation | 14 | — | 235 | 30 |
Insurance | 6,268 | 2,754 | 1,573 | |
Vessel depreciation | 13 | 104,042 | 53,696 | 22,484 |
Impairment of property, plant and equipment | 13 | — | — | 5,000 |
Seafarer payroll | 6 | 50,088 | 32,285 | 15,921 |
Fuel and oil | 7,928 | 2,976 | 711 | |
Maintenance | 17,878 | 7,886 | 5,121 | |
Messing costs | 5,270 | 2,948 | 1,448 | |
Seafarer travel | 11,634 | 7,110 | 2,835 | |
Specific charter costs | 30,512 | 10,776 | 4,052 | |
Utilities | 1,720 | 1,308 | 389 | |
Other operating expenses | 1,334 | 2,254 | 294 | |
Tonnage tax | 81 | — | — | |
Total cost of sales | 236,755 | 124,228 | 59,858 |
EUR'000 | Note | 2025 | 2024 | 2023 |
Administrative expenses | ||||
Depreciation and amortisation | 12 , 13 , 14 | 3,549 | 2,522 | 534 |
Employee compensation | 6 | 46,282 | 33,132 | 18,889 |
Repair and maintenance expenses | 3,449 | 3,020 | 1,123 | |
Legal and professional fees | 9,087 | 7,576 | 2,122 | |
Transaction costs | — | — | 7,707 | |
Rental expenses | 2,484 | 1,757 | 751 | |
Travel expense | 2,393 | 1,988 | 985 | |
Marketing and entertainment expenses | 968 | 1,283 | 602 | |
Other expenses | 6,414 | 5,823 | 1,745 | |
Total administrative expenses | 74,626 | 57,101 | 34,458 |
Transaction costs in 2023 include all costs related to the business combination with Eneti, such as advisory,
legal and consulting fees, which are included in administrative expenses.
160
Note 4
Operating Expenses
Continued from previous page
Accounting policies
Cost of sales and administrative expenses
Cost of sales consists of expenses directly attributable to the Group’s core activities, including seafarers
payroll, vessel depreciation, and the operation and maintenance of vessels.
Administrative expenses, which include administrative staff costs, share-based compensation, management
costs, office expenses, business combination transaction costs and other administration-related expenses,
are expensed as they are incurred.
Auditor remuneration
Administrative expenses include fees to the auditors appointed by the shareholder at the Annual General
Meeting:
EUR'000 | 2025 | 2024 | 2023 |
Statutory audit | 1,748 | 2,016 | 474 |
Other assurance services | 34 | 264 | 1,608 |
Tax services | 25 | 9 | 2 |
Other services | — | 22 | 606 |
Total | 1,807 | 2,311 | 2,690 |
Statutory audit services consist of fees for professional services rendered by Ernst & Young for the audit of
the annual consolidated financial statements and services that are provided by the auditor in connection
with the statutory audit.
For 2025 and 2024, the fee includes services related to the issuance of audit report on the design and
operating effectiveness of the Company's internal controls over financial reporting (SOX404(b)).
Other assurance services consist of reviews of interim financial information and, for 2023, include PCAOB
re-audits for 2021 and 2022, as well as assurance reports in respect of pro forma financial information in
connection with regulatory filings.
Tax services consist of tax compliance services.
Other services consist of services provided for other permitted services, including fees for work performed
in connection with the US listing in December 2023.
161
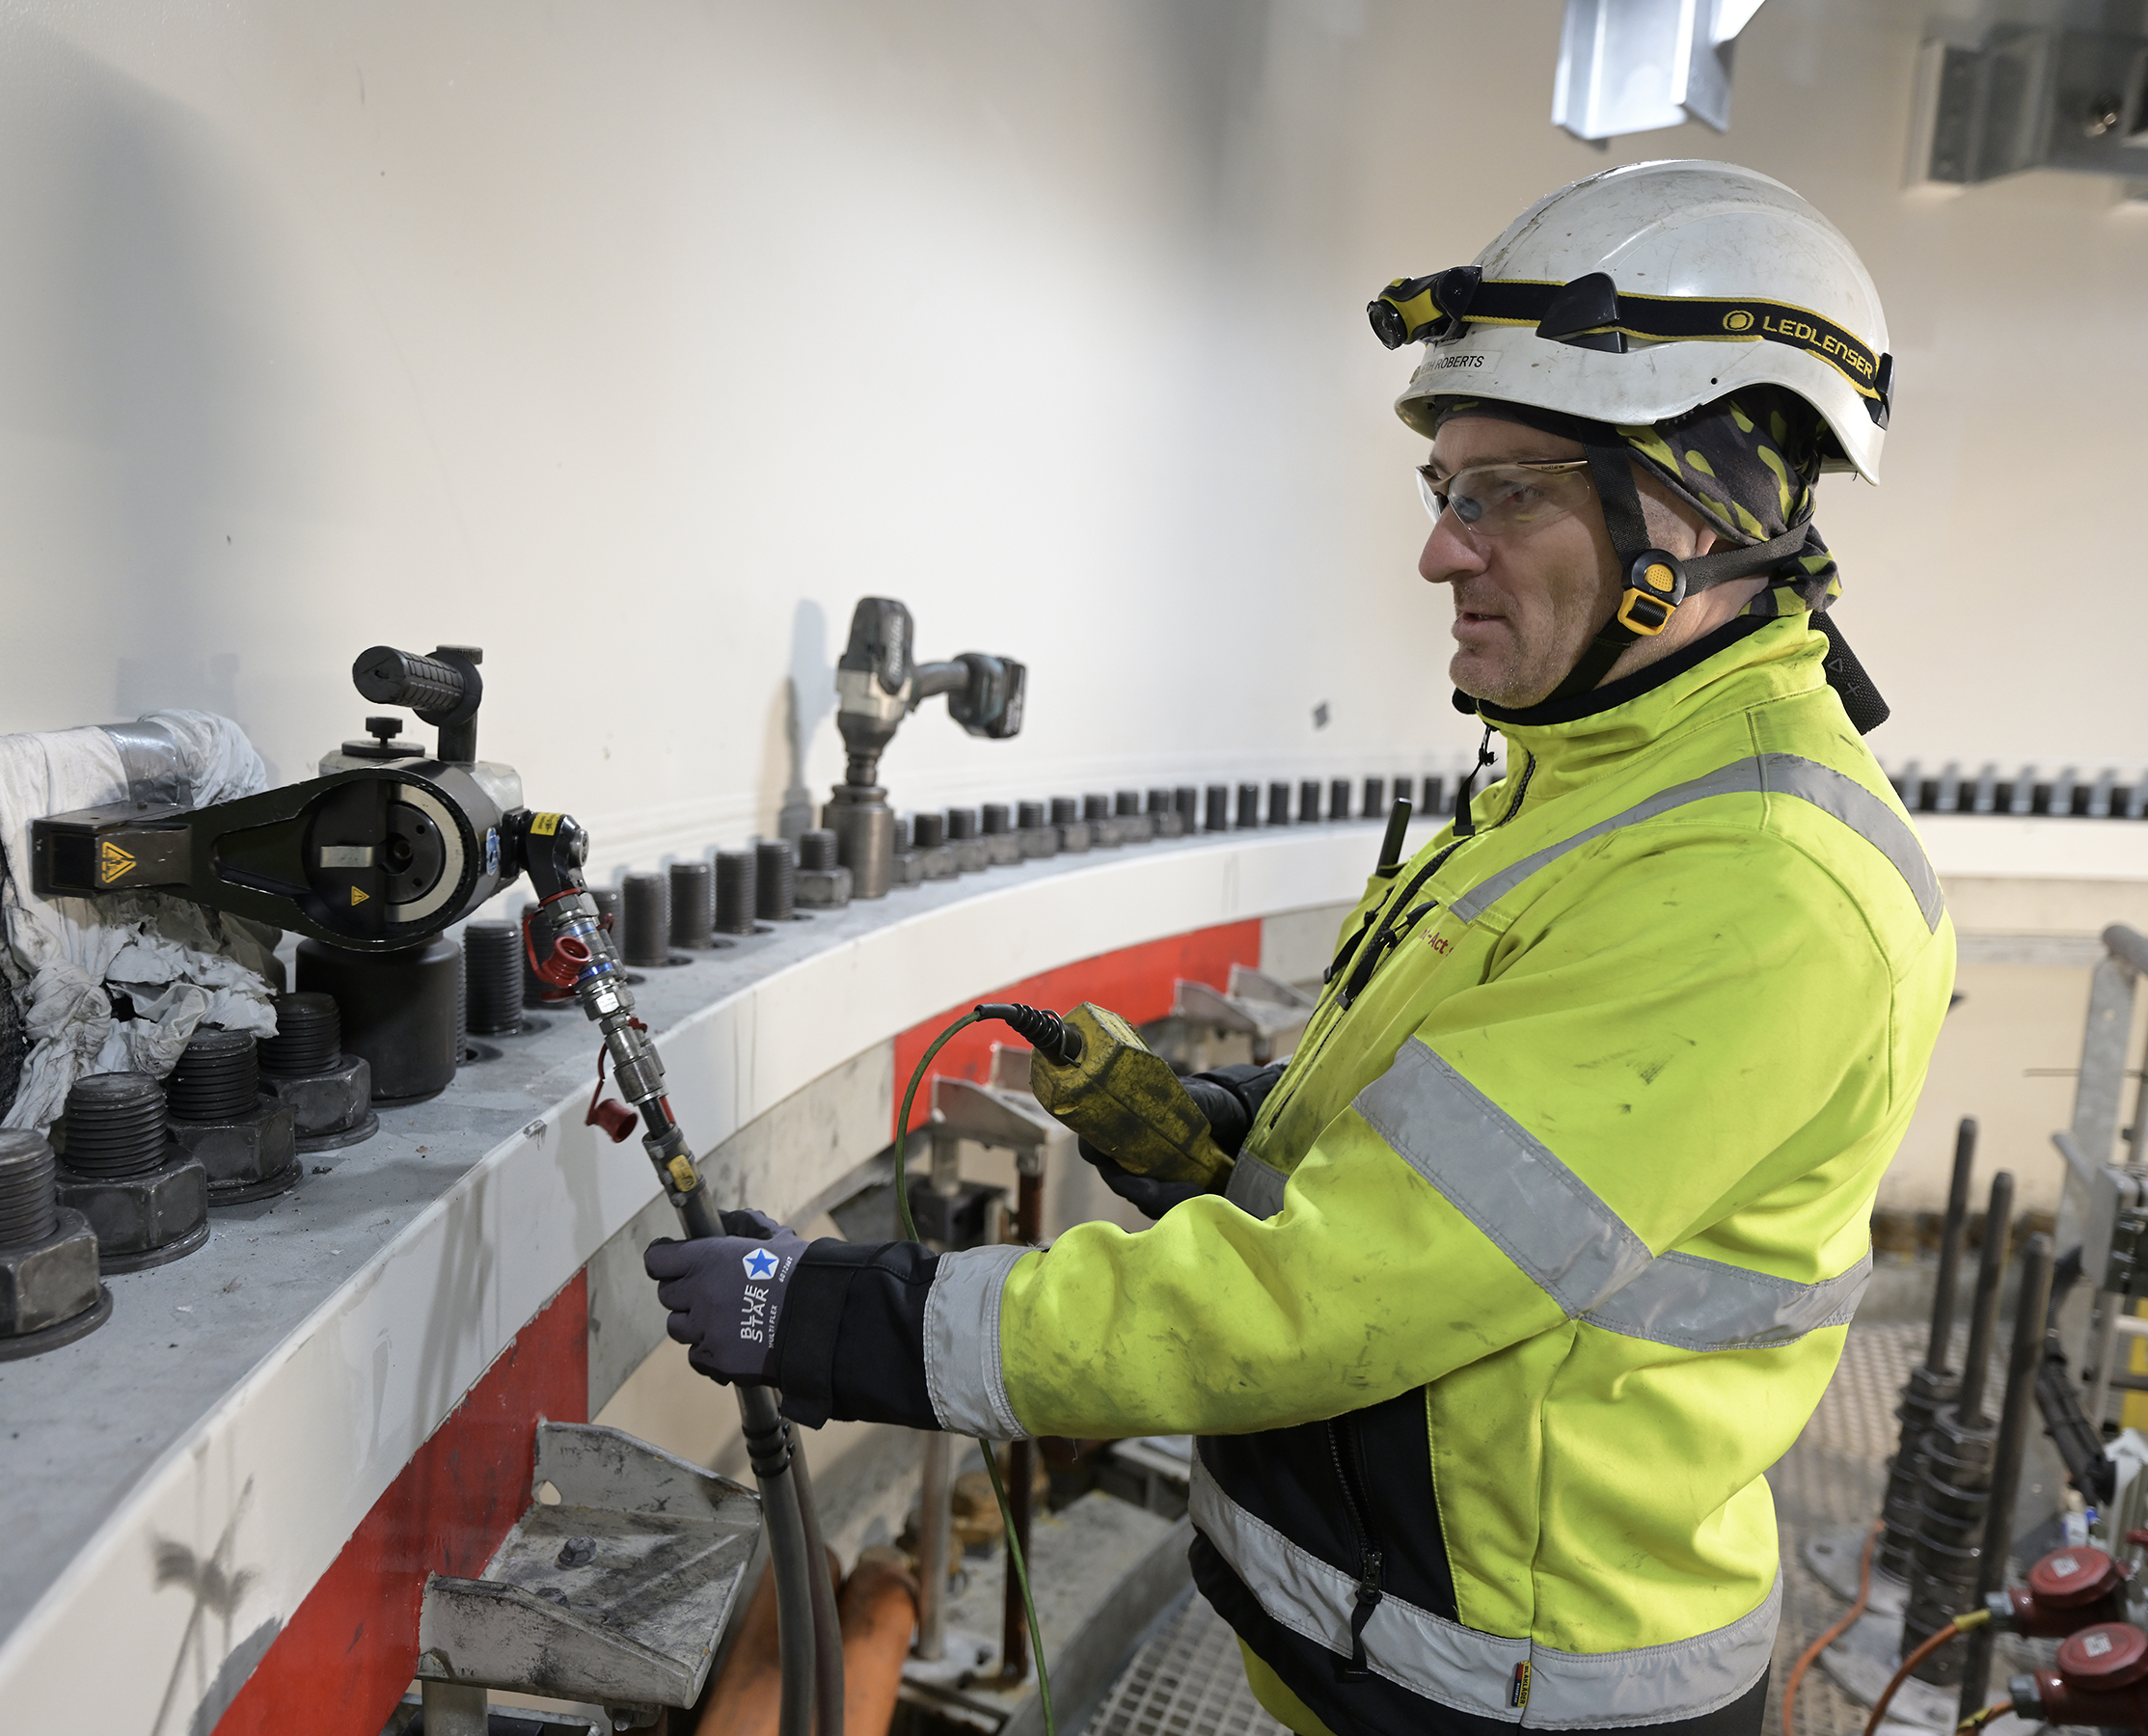
Note 5
Net Other Operating Income and Expenses
EUR'000 | Note | 2025 | 2024 | 2023 |
Other operating income | 8,770 | 2,286 | 3,000 | |
Other operating expenses | — | (251) | (2,863) | |
Net other operating income and expenses | 8,770 | 2,035 | 137 |
Other operating income and expenses for 2025 includes approximately EUR 5 million in accelerated
payments relating to the early termination of a contract for operations and advisory services.
Other operating income and expenses for 2024 primarily consist of management fees earned from the
operation of third-party vessels.
Other operating income and expenses for 2023 include the net gain from the sale of the main cranes and
spare parts of both O-class vessels. The contract signed for the sale of both main cranes states a purchase
price of EUR 1.5 million for each main crane. In the case of Wind Orca, the carrying amount of the main
crane had been written down, reflecting the value that was expected from the disposal of the assets. Thus,
an impairment loss of EUR 5 million was reflected in the statement of profit and loss. The Wind Osprey
main crane had been kept at its carrying amount since there was a gain from the disposal. The sale of both
main cranes was driven by the main crane upgrades to the O-class vessels.
Accounting policies
Other operating income and expenses, include transactions not related to the operations of the Group,
such as, gains and losses on the sale of non-current assets. Such transactions are generally recognised
when it is probable that the benefits and losses associated with the transaction will flow to the Company
and when the significant risks and rewards have been transferred to the buyer (generally when the
transaction is finalised).
162
Note 6
Employee Compensation
Onshore - presented within administrative expenses
EUR'000 | Note | 2025 | 2024 | 2023 |
Wages and Salaries | 37,322 | 29,340 | 16,957 | |
Employer's contribution to defined contribution plans | 3,765 | 1,635 | 847 | |
Share based payment expense | 7 | 2,071 | 1,662 | 1,134 |
Other short-term benefits | 3,124 | 495 | 611 | |
Total onshore employee compensation | 46,282 | 33,132 | 19,549 | |
Average number of employees | 307 | 242 | 113 |
In 2023, employee compensation includes EUR 660 thousand related to bonus paid, included in transaction
costs.
Accounting policies
Employee benefits are recognised as an expense, unless the cost qualifies for capitalisation as an asset.
Employee compensation includes wages and salaries, including compensated absence and pensions, as
well as other social security contributions made to the entity’s employees or public and government
authorities.
Offshore - presented within cost of sales
EUR'000 | Note | 2025 | 2024 | 2023 |
Wages and Salaries | 46,008 | 30,043 | 14,056 | |
Employer's contribution to defined contribution plans | 3,557 | 2,059 | 1,124 | |
Other short-term benefits | 523 | 183 | 741 | |
Total offshore employee compensation | 50,088 | 32,285 | 15,921 | |
Average number of employees | 586 | 364 | 182 |
Total
EUR'000 | Note | 2025 | 2024 | 2023 |
Wages and Salaries | 83,330 | 59,383 | 31,013 | |
Employer's contribution to defined contribution plans | 7,322 | 3,694 | 1,971 | |
Share based payment expense | 7 | 2,071 | 1,662 | 1,134 |
Other short-term benefits | 3,647 | 678 | 1,352 | |
Total employee compensation | 96,370 | 65,417 | 35,470 | |
Average number of full time employees | 893 | 606 | 295 | |
Number of employees at the end of the reporting period | 1,073 | 659 | 570 |
163
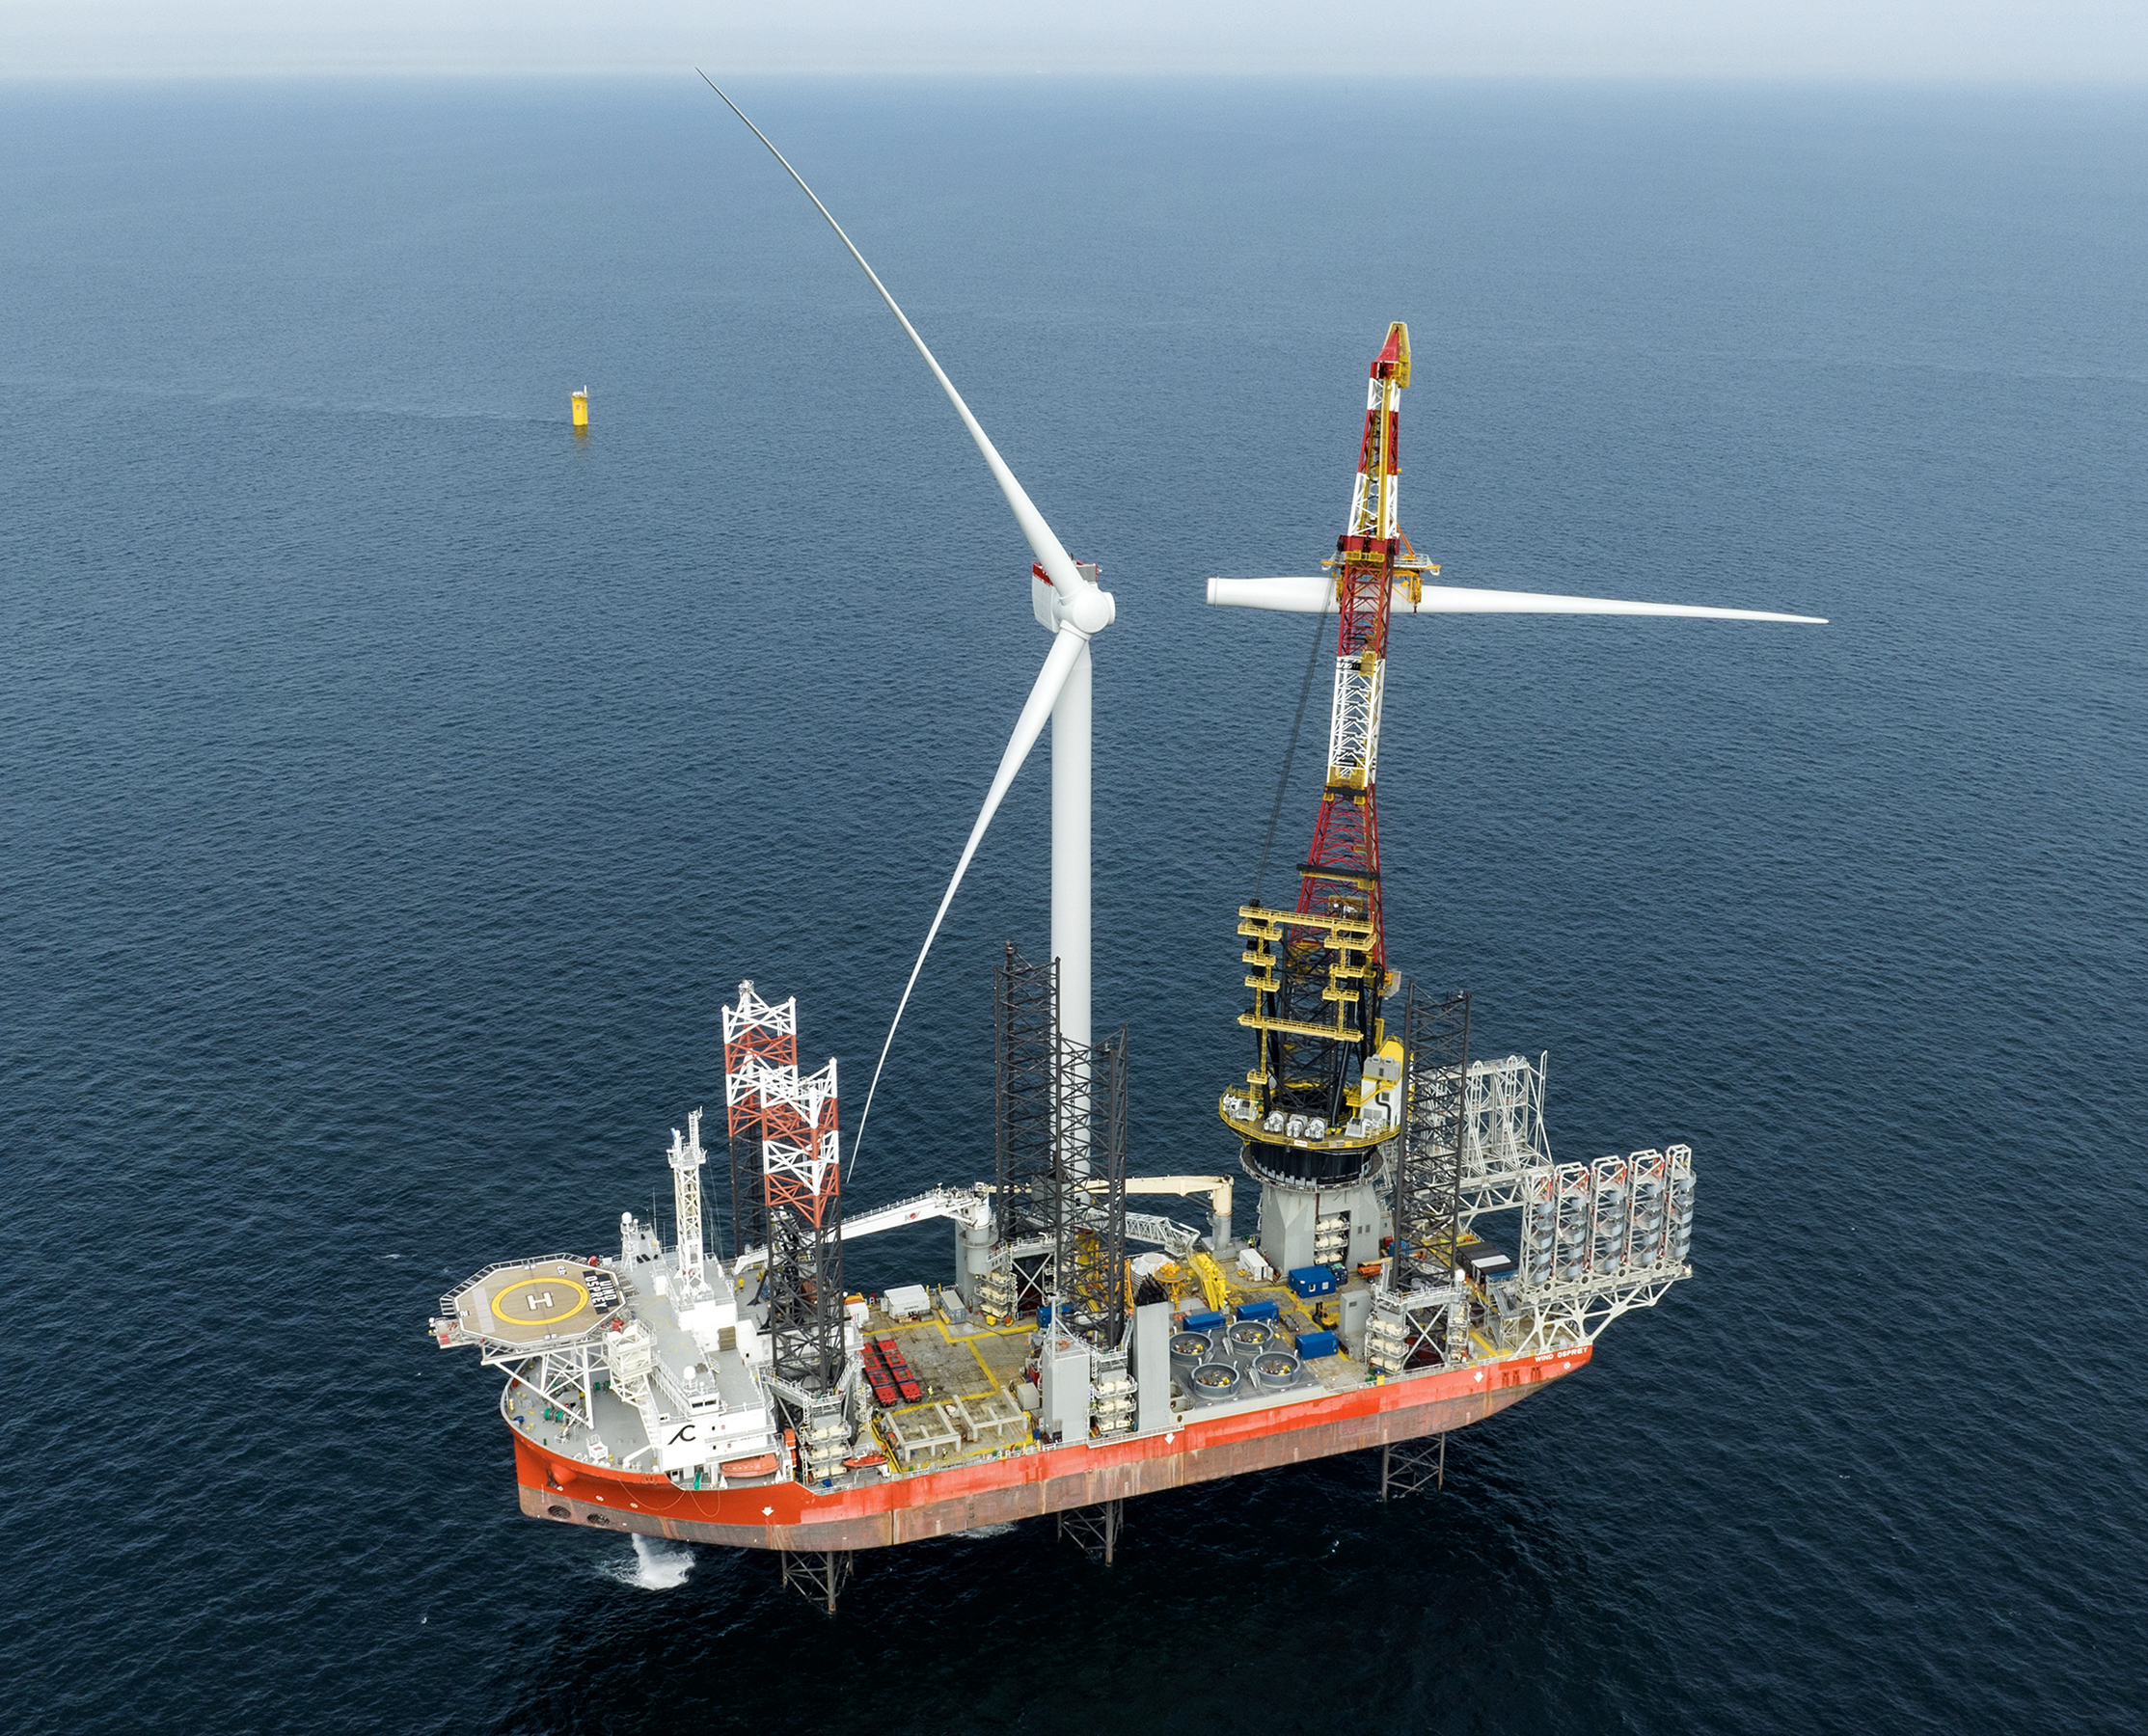
Note 6
Employee Compensation
Continued from previous page
Eneti employees, both onshore and offshore, joined the Group by the end of December 2023. Thus, the
average number of full-time employees as of 2023 reflects the number of employees in Eneti divided by 12
months. Eneti had 99 onshore full time employees and 176 seafarers by the end of 2023.
Labour costs related to certain employees who are working on the management of the newbuilding
process have been capitalised. These capitalised costs amounted to EUR 7.8 million in 2025, EUR 2.7 million
in 2024 and EUR 1.1 million in 2023 and are recognised under assets under construction.
164
Note 7
Long Term Incentive Programmes
The following share-based long-term incentive programmes were in place as of 31 December 2025:
(i) In January 2022, the Executive Management and select employees were granted from 10,393 to 55,430
Restricted Share Units (RSU) which fully vested and were issued in July 2024. The total fair value of the RSU
allocation is calculated based on the Company's closing share price on Nasdaq Copenhagen A/S on the day
of grant, and the value is EUR 394 thousand (EUR3.3 per RSU). As the RSUs fully vested in 2024, there was
no expense recognised in profit and loss in the current year (EUR 53 thousand in 2024; EUR 143 thousand in
2023).
(ii) In January 2022, the Executive Management and select employees were granted from 10,393 to 55,430
Options in Cadeler shares, which fully vested in May 2024 and expire in April 2027. The strike price ranged
from NOK36.02 to NOK38.42, depending on the exercise period. The fair value of these options was EUR
160 thousand (EUR 1.3 per RSU) as determined at grant date using the Black-Scholes model. As these
options fully vested in 2024, there was no expense recognised in profit and loss in the current year (EUR
13 thousand in 2024; EUR 62 thousand in 2023).
(iii) In May 2022, the Executive Management and select employees were granted from 43,420 to 221,719
Options in Cadeler shares, which fully vested in May 2025 and expire in May 2028. The strike price is
NOK40.24 and as of 31 December 2025, no options have been exercised. The fair value of these options was
EUR 761 thousand (EUR 1.3 per RSU) as determined at grant date using the Black-Scholes model. The
expense recognised in profit and loss for the year amounts to EUR 173 thousand (EUR 237 thousand in
2024; EUR 237 thousand in 2023). The average remaining contractual life for the options as per
31 December 2025 is 2.3 years. The annualised volatility of the shares of 42.5% is based on the historical
volatility of the share price, annual risk-free interest rate of 2.8%, dividend yield of zero, expected life until
expiration date and average share price of EUR 3.7.
(iv) In January 2023, the Executive Management and select employees were granted from 19,760 to 130,416
RSUs, which fully vested and were issued in July 2025. The fair value of the RSUs’ are EUR 1.2 million (EUR 3.0
per RSU) as determined at grant date using the Black-Scholes model. The expense recognised in profit and
loss for the year amounts to EUR 234 thousand (EUR 468 thousand in 2024, EUR 498 thousand in 2023).
165
Note 7
Long term incentive programmes
Continued from previous page
(v) In August 2023, the Executive Management and select employees
were granted from 88,920 to 385,320 options in Cadeler shares which
will vest in August 2026 and expire in August 2029. The strike price
will be NOK45.49 and vesting is conditional upon continued
employment at Cadeler. The fair value of these options is
EUR2.2 million (EUR1.8 per option) as determined at grant date using
the Black-Scholes model. The expense recognised in profit and loss
for the year amounts to EUR 500 thousand (EUR419 thousand in
2024; EUR250 thousand in 2023). The average remaining contractual
life of the options as of 31 December 2025 is 3.5 years. The
annualised volatility of the shares of 61.0% is based on the historical
volatility of the share price, an annual risk-free interest rate of 2.68%,
a dividend yield of zero, the expected life until expiration date and
average share price of EUR3.7.
(vi) In May 2024, the Executive Management was granted a total of
193.011 RSUs, which will vest at the end of May 2027. The RSUs’ expire
at the end of May 2030 and are conditional upon continued
employment at Cadeler. The fair value of the RSU’s is EUR 1.1 million
(EUR5.6 per RSU) as determined at grant date using the Black-
Scholes model. The expense recognised in profit and loss for the year
amounts to EUR 350 thousand (EUR 206 thousand in 2024). The
average remaining contractual life as of 31 December 2025 is 4.4
years. The average share price used is NOK64.2.
(vii) In May 2024, the Executive Management and select employees
were granted from 140,372 to 245,651 options in Cadeler shares,
which will vest at the end of May 2027 and expire at the end of May
2030. The strike price will be NOK74.32 and vesting is conditional
upon continued employment at Cadeler. The fair value of these
options is EUR 1.4 million (EUR1.4 per option) as determined at grant
date using the Black-Scholes model. The expense recognised in profit
and loss for the year amounts to EUR 450 thousand (EUR
265 thousand in 2024). The average remaining contractual life of the
options as of 31 December 2025 is 4.4 years. The annualised volatility
of the shares of 31.2% is based on the historical volatility of the share
price, annual risk-free interest rate of 3.63%, dividend yield of zero,
expected life until expiration date, and average share price of
NOK64.2.
(viii) In March 2025, the Executive Management and select employees
were granted from 42,115 to 631,724 options in Cadeler shares, which
will vest in March 2028 and expire in March 2031. The strike price will
be NOK60.2 and vesting is conditional upon continued employment
at Cadeler. The fair value of these options is 2 million (EUR 1.4 per
option) as determined at grant date using the Black-Scholes model.
The expense recognized in profit and loss for the year amounts to
EUR 479 thousand. The average remaining contractual life of the
options as of 31 December 2025 is 5.3 years. The annualised volatility
of the shares is 31.66% based on historical volatility of the share price
price, annual risk-free interest rate of 3.93%, a dividend yield of zero,
an expected life of 4 years from grant date and average share price
of NOK52.
Accounting policies
Share-based payments
Employees (including senior executives) of the Group receive
remuneration in the form of share-based payments, whereby
employees render services as consideration for equity instruments
(equity-settled transactions).
Equity-settled transactions
The cost of equity-settled transactions is determined by the fair value
at the date on which the grant is made using an appropriate
valuation model. That cost is recognised as employee benefits
expenses, together with a corresponding increase in equity (retained
earnings), over the period in which the service and, where applicable,
the performance conditions are fulfilled (the vesting period). The
cumulative expense recognised for equity-settled transactions at each
reporting date until the vesting date reflects both the extent to which
the vesting period has expired and the Group’s best estimate of the
number of equity instruments that will ultimately vest. The expense or
credit in the statement of profit or loss for a period represents the
movement in cumulative expense recognised at the beginning and
end of that period.
166
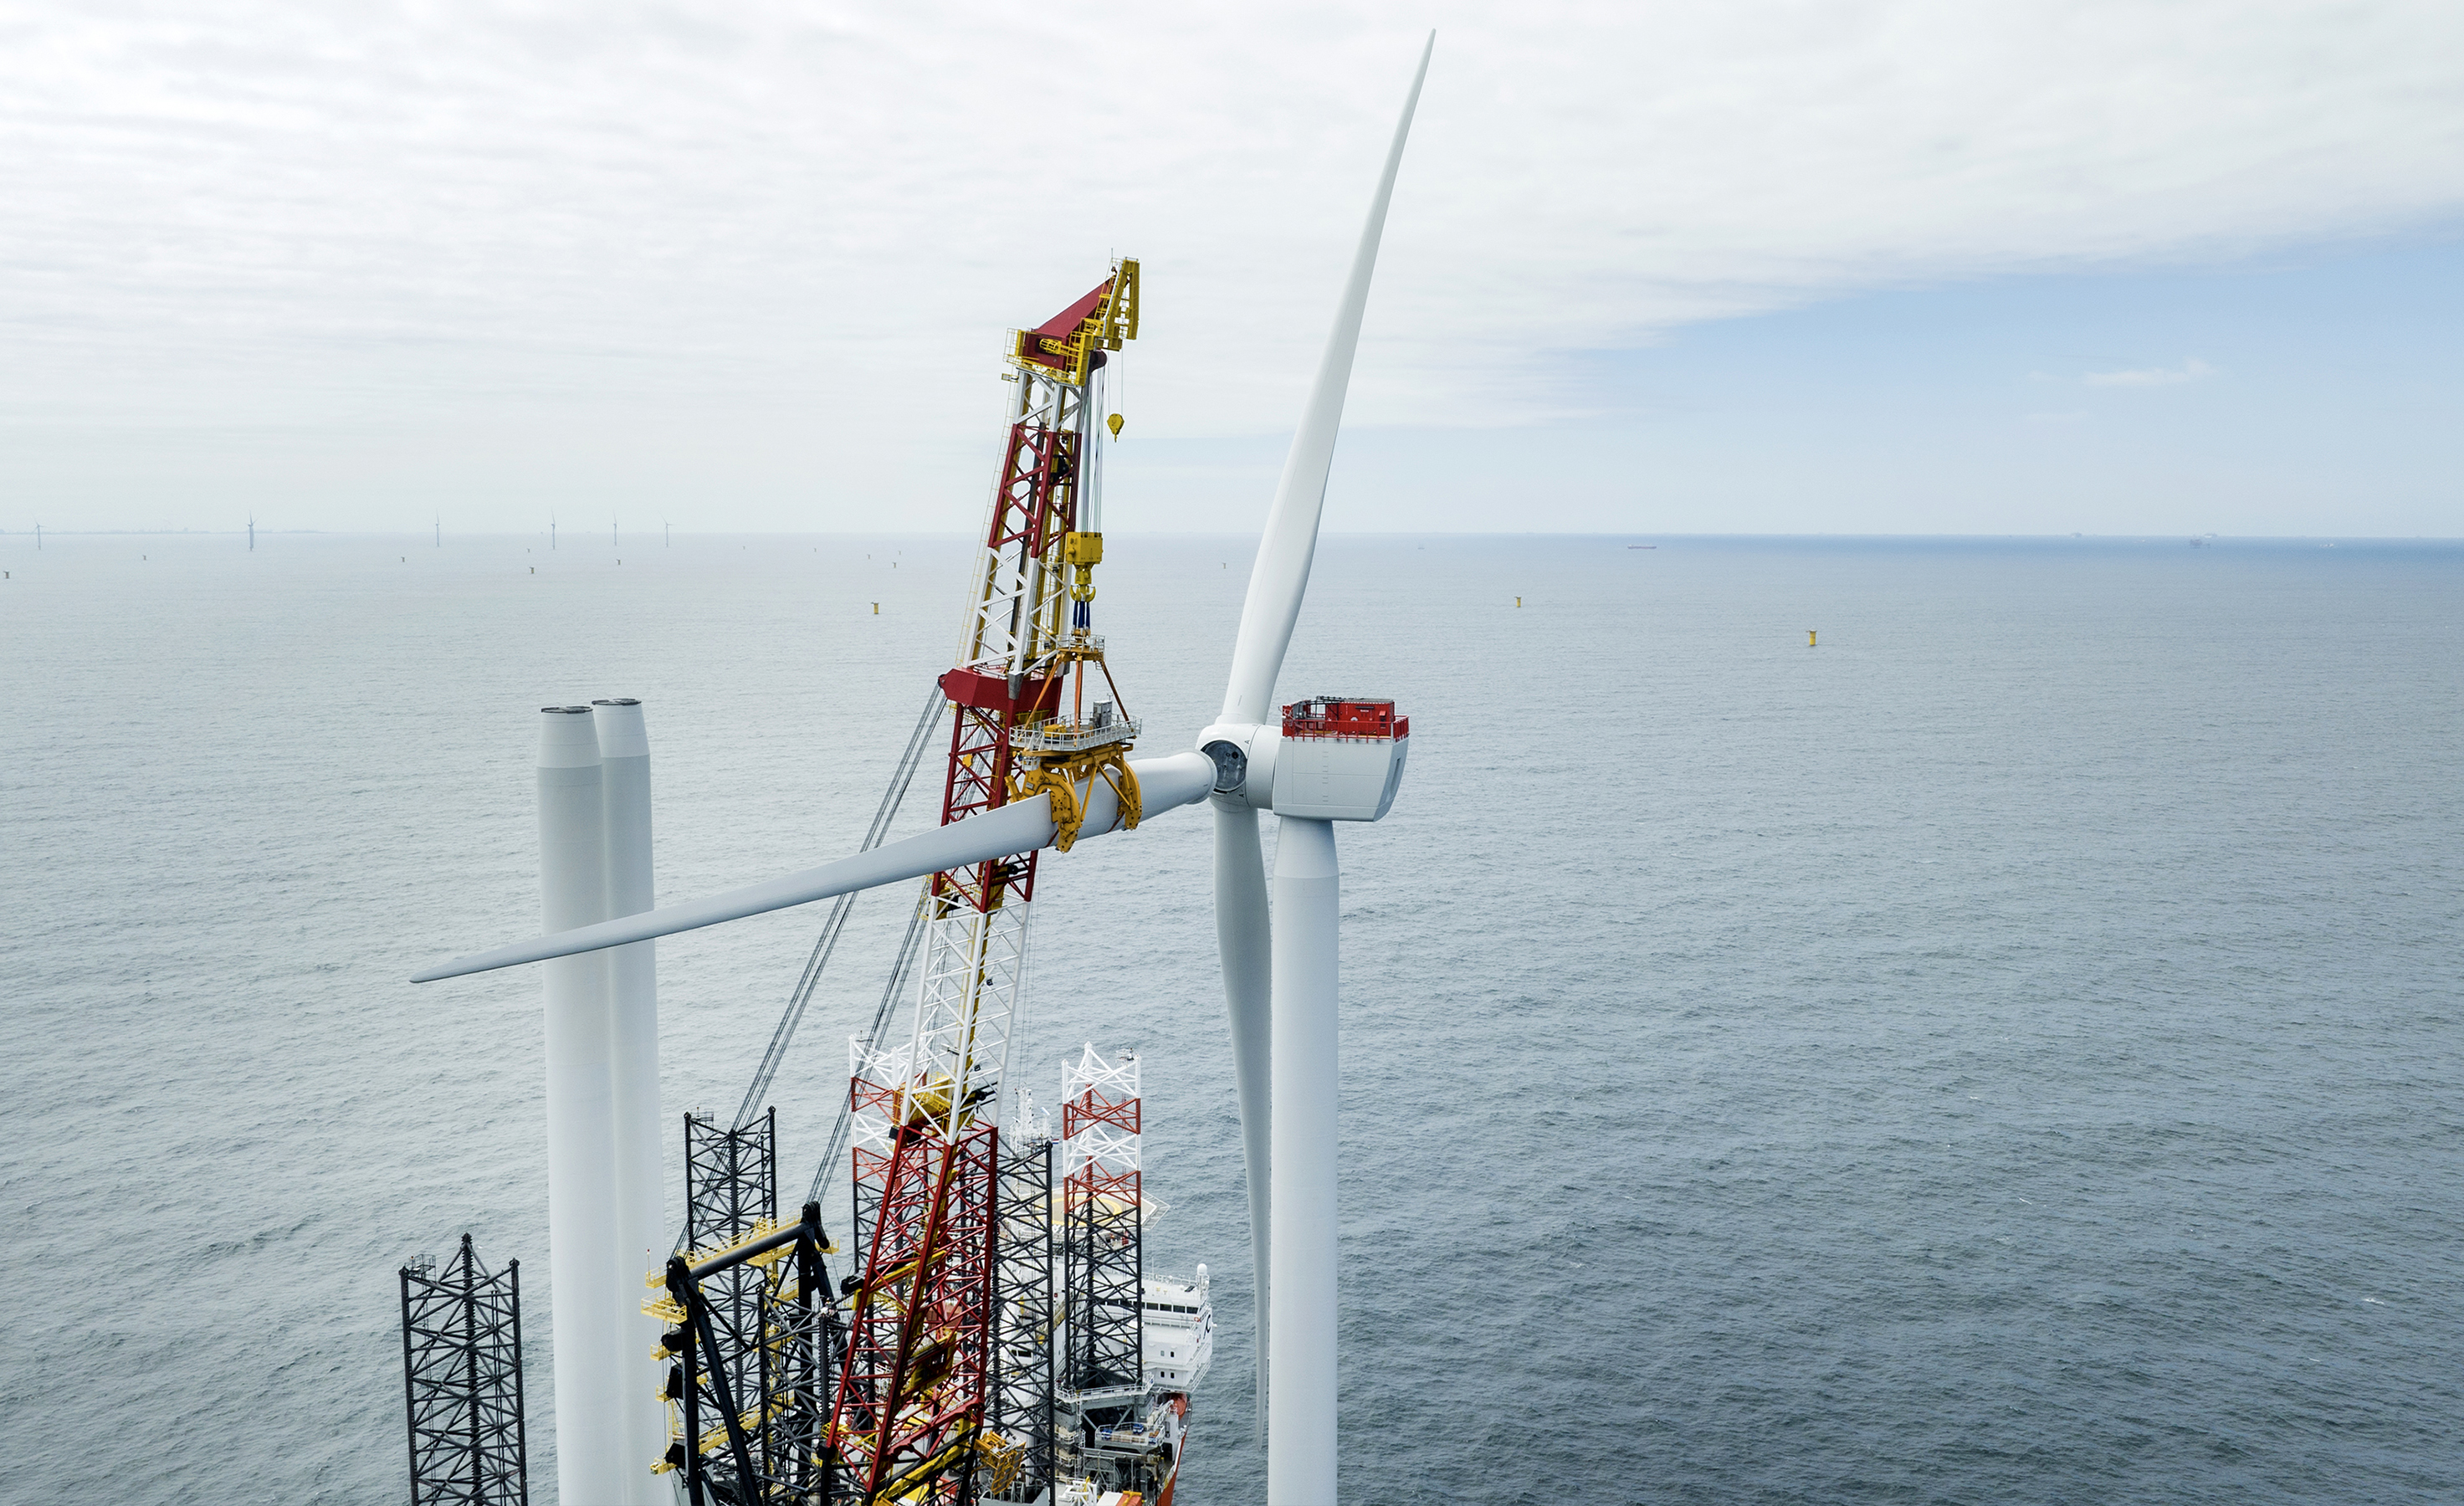
Note 7
Long term incentive programmes
Continued from previous page
Service and non-market performance conditions are not considered
when determining the grant date fair value of awards. Instead, the
likelihood of these conditions being met is assessed as part of the
Group’s best estimate of the number of equity instruments that will
ultimately vest. Market performance conditions are reflected directly
in the grant date fair value.
Any other conditions attached to an award, that do not include an
associated service requirement, are considered to be non-vesting
conditions. Non-vesting conditions are reflected in the fair value of
an award and result in an immediate expensing, unless there are also
service and/or performance conditions.
No expense is recognised for awards that do not ultimately vest as a
result non-market performance and/or service conditions not being
met.
Where awards include a market or non-vesting condition, the
transactions are treated as vested regardless of whether the market
or non-vesting condition is satisfied, provided that all other
performance and/or service conditions are satisfied.
The dilutive effect of outstanding options is reflected as additional
share dilution in the computation of diluted earnings per share in a
loss situation only where the loss per share is reduced.
167
Note 7
Long term incentive programmes
Continued from previous page
2025 | 2024 | 2023 | ||||||||||
Executive management | Other employees | Executive management | Other employees | Executive management | Other employees | |||||||
Outstanding instruments - Options | Number | WAEP1 | Number | WAEP1 | Number | WAEP1 | Number | WAEP1 | Number | WAEP1 | Number | WAEP1 |
Outstanding at 1 January | 1,353,052 | 4.39 | 1,487,689 | 4.76 | 967,029 | 3.47 | 894,123 | 3.46 | 344,589 | 3.16 | 330,963 | 3.15 |
Granted during the year | 912,490 | 5.09 | 491,341 | 5.09 | 386,023 | 6.24 | 631,674 | 6.24 | 622,440 | 3.64 | 563,160 | 3.64 |
Forfeited during the year | — | — | (62,908) | 3.80 | — | — | — | — | — | — | — | — |
Exercised during the year | — | — | — | — | — | 3.03 | (38,108) | — | — | — | — | — |
Expired during the year | — | — | — | — | — | — | — | — | — | — | — | — |
Outstanding at 31 December | 2,265,542 | 4.69 | 1,916,122 | 4.90 | 1,353,052 | 4.39 | 1,487,689 | 4.76 | 967,029 | 3.47 | 894,123 | 3.46 |
2025 | 2024 | 2023 | ||||||||||
Executive management | Other employees | Executive management | Other employees | Executive management | Other employees | |||||||
Outstanding instruments - RSU | Number | WAEP1 | Number | WAEP1 | Number | WAEP1 | Number | WAEP1 | Number | WAEP1 | Number | WAEP1 |
Outstanding at 1 January | 382,707 | — | 205,504 | — | 245,126 | — | 271,327 | — | 55,430 | — | 65,823 | — |
Granted during the year | — | — | — | — | 193,011 | — | — | — | 189,696 | — | 205,504 | — |
Forfeited during the year | — | — | (6,847) | — | — | — | — | — | — | — | — | — |
Exercised during the year | (189,696) | — | (198,657) | — | (55,430) | — | (65,823) | — | — | — | — | — |
Expired during the year | — | — | — | — | — | — | — | — | — | — | — | — |
Outstanding at 31 December | 193,011 | — | — | — | 382,707 | 0 | 205,504 | 0 | 245,126 | 0 | 271,327 | 0 |
168
Note 8
Board of Directors and Executive Management Compensation
2025 | 2024 | 2023 | |||||||
EUR'000 | Board of directors | Executive management | Total | Board of directors | Executive management | Total | Board of directors | Executive management | Total |
Wages, salaries and board fees | 419 | 998 | 1,417 | 334 | 955 | 1,289 | 183 | 821 | 1,004 |
Pension costs - defined contribution plans | — | 100 | 100 | — | 95 | 95 | — | 29 | 29 |
Share based payment | — | 1,249 | 1,249 | — | 957 | 957 | — | 588 | 588 |
Other short-term benefits | — | 35 | 35 | — | 41 | 41 | — | 55 | 55 |
Cash bonus | — | 2,473 | 2,473 | — | 1,197 | 1,197 | — | 1,155 | 1,155 |
Total management compensation | 419 | 4,855 | 5,274 | 334 | 3,245 | 3,579 | 183 | 2,648 | 2,831 |
Executive Management
Executive Management refers to the members of the Executive
Management who are registered with the Danish business authority
and who have the authority and responsibility for the planning,
directing and controlling of the activities of the Company as defined
by IAS 24. As such, Executive Management is considered Chief
Operating Decision Makers (CODM) as defined by IFRS 8.
Board of Directors
Andreas Sohmen-Pao and Andreas Beroutsos are employed by the
BW Group. These board members did not receive remuneration from
Cadeler in 2023, 2024 and 2025. Andreas Beroutsos stepped down
from the Board with effect from 25 April 2023. On the same date,
Andrea Abt joined the Board.
David Peter Cogman is employed by the Swire Group and did not
receive remuneration from Cadeler in 2022 and 2023. David Peter
Cogman stepped down from the Board with effect from 16 June
2023, together with Connie Hedegaard.
On 20 February 2024, Emanuele Lauro and James Nish joined the
Board. Emanuele Lauro is the Director and Chief Executive Officer of
Scorpio Holdings Limited, which is considered a related party (see
Note 27).
On 23 April 2024, Jesper T. Lok left the Board of Directors and
Colette Cohen was elected to serve a two year term through the 2026
AGM.
On 11 November 2024, Thomas Thune Andersen was elected as a
new member of the Board of Directors.
169
Note 9
Financial Income and Expenses
EUR'000 | 2025 | 2024 | 2023 |
Foreign currency gain | 5,784 | 1,511 | 109 |
Fair value change of derivative (ineffectiveness) | — | 428 | — |
Interest income | 1,714 | 3,294 | 1,432 |
Financial income | 7,498 | 5,233 | 1,541 |
EUR'000 | 2025 | 2024 | 2023 |
Interest linked to debt liabilities | 21,209 | 2,368 | 2,851 |
Guarantee charges | 994 | 581 | — |
Fair value change of derivative (ineffectiveness) | 1,577 | — | 765 |
Lease liabilities | 746 | 428 | 25 |
Foreign currency loss | 10,877 | 3,322 | 389 |
Bank fees | 1,974 | 501 | 456 |
Financial expenses | 37,377 | 7,200 | 4,486 |
Total interest paid in 2025 as per Consolidated Statement of Cash Flows amounts to EUR 56 million (2024:
EUR 19.7 million; 2023: EUR 7.1 million) and has primarily been capitalised to Property, Plant and Equipment.
For further information refer to Note 13. Interest linked to debt liabilities include EUR 2.4 million in 2024 and
EUR 1.9 million in 2023 relating to the write off of loan fees associated with previous debt facilities. In
addition, in 2023, EUR 1.0 million relates to the amendment of a prior debt facility in June 2023.
Accounting policies
Finance income and expenses comprise interest income and expenses, as well as realised and unrealised
exchange rate gains and losses on transactions denominated in foreign currencies, together with fair value
adjustments related to the ineffective portion of financial instruments.
Interest income and interest expenses are recognised using the effective interest rate. The effective interest
rate is the discount rate used to discount expected future cash payments or receipts over the expected life
of a financial asset or financial liability to the amortised cost (carrying amount) of such asset or liability.
170
Note 10
Income Taxes
EUR'000 | 2025 | 2024 | 2023 |
Income tax expense | |||
Tax expense attributable to profit is made up of: | |||
Current tax | (6,396) | (1,271) | — |
Movement on deferred tax | (1,284) | (1,137) | — |
Total Income tax expense | (7,680) | (2,408) | — |
Tax expenses comprise the expected income tax charge for the year in accordance with IAS 12.
The tax base of the Group’s vessel assets are held by wholly owned subsidiaries located in Cyprus, UK and
Japan. Besides Japan, vessel owning entities and their corresponding Fleet Manager entities operate within
tonnage tax regimes in Denmark, Cyprus and the United Kingdom, pursuant to which in-scope entities pay a
fixed amount per net ton at their disposal, rather than income being taxed under a conventional corporate
tax regime. Cyprus owned vessels participate in dual tonnage tax schemes, with Denmark as Danish Fleet
Manager and Cyprus as Danish Fleet Owner. From 1st January 2025 UK vessel owning entities and the UK
Fleet Manager entity participate in the UK tonnage tax scheme.
The total recorded tonnage tax expense for 2025 in Denmark, UK and Cyprus amount to EUR 34 thousand,
EUR 48 thousand and EUR 11 thousand respectively (2024 and 2023: EUR 0 thousand in Denmark and EUR
5 thousand in Cyprus, UK tonnage tax effective from 2025).
In addition, certain of Cadeler’s subsidiaries are resident for taxation purposes in the United Kingdom or
other foreign jurisdictions that are outside the scope of the tonnage tax ring-fence. These entities are
subject to their local corporation tax regimes based on their taxable income.
The Group routinely evaluates its exposure to local income taxes (Permanent Establishments) relating to its
foreign operations which can also result in additional current foreign taxes.
The Group continues to assess the potential impact of the Pillar Two rules on future reporting periods. Refer
to Note 2 for further details.
EUR'000 | 2025 | 2024 | 2023 |
Effective tax rate | |||
Profit before income tax | 287,864 | 67,477 | 11,498 |
Tax at Corporate Tax rate (22%) | 63,330 | 14,845 | 2,530 |
Effects of: | |||
Income not taxable/impact of tonnage tax regime | (73,214) | (9,606) | (2,530) |
Amounts not recognised | 9,055 | (6,022) | — |
Deferred tax on consolidation adjustments | 577 | 721 | — |
Adjustment to prior periods - deferred tax | 707 | 416 | — |
Adjustment to prior periods - current tax | 1,855 | 74 | — |
Impact of overseas taxes | 5,370 | 1,980 | — |
Income tax expense, reported | 7,680 | 2,408 | — |
Effective tax rate (%) | 2.7% | 3.6% | —% |
171
Note 10
Income Taxes
Continued from previous page
Accounting policies
Income tax
Current income tax for current and prior periods is recognised at the
amount expected to be paid to or recovered from the tax authorities,
using the tax rates and tax laws that have been enacted or
substantively enacted at the balance sheet date.
Management periodically evaluates positions taken in tax returns in
situations where applicable tax regulation is subject to interpretation.
It establishes provisions, where appropriate, based on amounts
expected to be paid to the tax authorities.
Deferred income tax is recognised for all temporary differences
arising between the tax bases of assets and liabilities and their
carrying amounts in the financial statements. An exception applies
where the deferred tax arises from the initial recognition of an asset
or liability in a transaction that is not a business combination and, at
the time of the transaction, affects neither accounting profit nor
taxable profit or loss and does not give rise to equal taxable and
deductible temporary differences.
Deferred income tax is measured at the tax rates expected to apply
when the related deferred income tax asset is realised or the deferred
income tax liability is settled, based on tax rates and tax laws that
have been enacted or substantively enacted at the balance sheet
date.
Current and deferred income taxes are recognised as income or
expenses in profit or loss, except to the extent that the tax arises from
a transaction that is recognised directly in equity.
Tonnage tax
Under the scheme, ship-owners (or bareboat charterers) pay a fixed
tax amount per net tonne at their disposal rather than paying taxes
based on taxable income, expenses, and depreciation. The Group has
participated in the Danish scheme since 27 November 2020 and
joined the UK tonnage tax scheme, effective January 2025.
As the vessels are owned and registered by subsidiaries in
jurisdictions other than Denmark, the Group is also subject to
tonnage taxation in those jurisdictions. Such tonnage taxation is
calculated based on a fixed tax amount per tonne.
As this scheme is based on a notional income derived from tonnage
capacity and not based on the entities' actual income and expenses,
the Group does not consider the scheme to fall under the scope of
IAS 12. Consequently, tonnage tax expenses are not presented as part
of tax expense in the statement of profit and loss, but are recognised
within costs of sales.
172
Note 11
Earnings Per Share (EPS)
The following table reflects the income and share data used in the basic and diluted EPS calculations:
EUR'000 | 2025 | 2024 | 2023 |
Profit attributable to ordinary equity holders of the parent for basic earnings | 280,184 | 65,069 | 11,498 |
Thousands | 2025 | 2024 | 2023 |
Weighted average number of ordinary shares for basic EPS | 350,508 | 345,979 | 201,362 |
Effect of dilution from share-based payments programme | 4,182 | 980 | 1,861 |
Weighted average number of ordinary shares adjusted for the effect of dilution¹ | 354,690 | 346,959 | 203,223 |
The weighted average number of ordinary shares considers the weighted average effect of treasury shares
during the period.
During 2024, the weighted average number of ordinary shares was also affected by the issuance of shares in
connection with a private placement on 15 February 2024, resulting in the issuance of 39.5 million shares, a
private placement on 26 June 2024, resulting in the issuance of 28 thousand shares and the share buy-back
programme, resulting in the repurchase of 215 thousand shares.
In December 2023, 114 million shares were issued in connection with the business combination with Eneti.
There have been no other transactions involving ordinary shares or potential ordinary shares between the reporting date and the date
of authorisation of these consolidated financial statements.
1The weighted average number of shares considers the weighted average effect of share-based payments during the year.
Accounting policies
The Company calculates Basic EPS by dividing the profit for the year attributable to ordinary equity holders
of the parent by the weighted average number of ordinary shares outstanding during the year.
Diluted EPS is calculated by dividing the profit attributable to ordinary holders of the parent by the weighted
average number of ordinary shares outstanding during the year plus the weighted average number of
ordinary shares that would be issued on conversion of all the dilutive potential ordinary shares into ordinary
shares.
173
Note 12
Intangible Assets
2025 | 2024 | 2023 | |||||||
EUR'000 | Software | Goodwill | Total | Software | Goodwill | Total | Software | Goodwill | Total |
Cost | |||||||||
Beginning of period | 1,069 | 17,763 | 18,832 | 693 | 16,707 | 17,400 | 662 | — | 662 |
Acquisition of businesses | — | — | — | — | — | — | — | 16,919 | 16,919 |
Additions | 1,506 | — | 1,506 | 410 | — | 410 | 31 | — | 31 |
Disposals | — | — | — | (38) | — | (38) | — | — | — |
Exchange differences | — | — | — | 4 | 1,056 | 1,060 | — | (212) | (212) |
31 December | 2,575 | 17,763 | 20,338 | 1,069 | 17,763 | 18,832 | 693 | 16,707 | 17,400 |
Accumulated depreciation | |||||||||
Beginning of period | 642 | — | 642 | 453 | — | 453 | 243 | — | 243 |
Depreciation charge | 264 | — | 264 | 189 | — | 189 | 210 | — | 210 |
31 December | 906 | — | 906 | 642 | — | 642 | 453 | — | 453 |
Net book value | 1,669 | 17,763 | 19,432 | 427 | 17,763 | 18,190 | 240 | 16,707 | 16,947 |
Software additions during 2025, 2024 and 2023 are mainly related to the development of the Company’s software solutions. In 2025, software additions also included the implementation costs related to the Enterprise
Resource Planning (ERP) system.
Goodwill of EUR 16.9 million was recognised on 19 December 2023 in relation to the acquisition of Eneti. The Group has two CGUs consisting of the WTGFIV and the O&M units with specific vessels allocated.
1 31 December 2024 and 2023 the recoverable amount is based on the fair value less cost of disposal of the CGU's (Broker Value).
174
Note 12
Intangible Assets
Continued from previous page
Impairment test
Goodwill arising from the merger with Eneti is allocated to the WTGFIV CGU as the expected synergies will
arise from this CGU. Management has performed an evaluation of impairment indicators for the O&MV
CGU to which no goodwill is allocated. Management concluded that indicators of impairment are present
and has therefore also performed an impairment test for this CGU. The Company has performed an annual
impairment test of the WTGFIV CGU. Neither in 2025, 2024 and nor in 2023 did the test result in any
impairment.
The annual impairment test is an assessment of whether the recoverable amount being the value in use (or
fair value less cost of disposal) of the cash generating unit, will be able to generate sufficient positive future
net cash flows to support the carrying amount of the assets related to the cash generating unit.
EUR m | Recoverable amount | Excess values (recoverable amount less carrying amount) | ||||
CGU | 2025 | 20241 | 2023¹ | 2025 | 2024¹ | 2023¹ |
WTGFIV | 5,099 | 1,103 | 574 | 2,457 | 227 | 58 |
O&MV | 355 | 89 | 95 | 41 | 1 | — |
Total | 5,454 | 1,192 | 669 | 2,498 | 228 | 58 |
Applied assumptions
As of 31 December 2025, the assessment of the recoverable amount of the CGU's is based on the value in
use (VIU). In 2024 and 2023, the impairment test involves estimating both FVLCOD (Fair value less costs of
disposal) and VIU and comparing the higher amount to the asset’s carrying amount. Fair values are
obtained through third-party broker assessment (level 3) of the vessels from at least two independent
brokers.
The discounted cash flow period has been calculated from the remaining useful life of the vessels as this is
deemed most representative for the actual value of the vessels. Accordingly, the calculation has no terminal
value.
The VIU is based on cash flow projections in financial budgets and business plans using a five year period
from 2026-2031 as follows:
•Revenue projection is based on signed contracts and expected revenue for the capacity not signed
yet as well as foundation contracts.
•Cost of sales are based on the business plan which is inflated afterwards, and expected
maintenance based on investment budget.
•Inflation is forecast at 2.5%
The discount rate used in the calculation is based on a Weighted Average Cost of Capital (WACC), reflecting
the cost of equity, cost of debt and capital structure, and is 10.1% after tax, (9.5% after tax in 2024 and 9.5%
after tax in 2023). As Cadeler is subject to the tonnage tax regime, the tax consideration in the WACC
calculation for impairment of a vessel is immaterial, thus the before and after tax WACC remain the same for
impairment testing purposes. Regarding the O&MV CGU, the calculations showed no indication of
impairment, as the future value of cash flows was higher than the carrying amount of the vessel, although
there was limited headroom.
Accounting policies
Goodwill is tested for impairment at least once a year or sooner if an impairment indication arises.
Impairment testing is performed for each CGU to which goodwill is allocated, as determined by
Management.
If the carrying amount of intangible assets exceeds the recoverable amount, an impairment will be
recognised in the statement of profit and loss. Any impairment of goodwill impairment losses cannot be
reversed subsequently.
Intangible assets, such as software, are recognised at cost less accumulated depreciation and accumulated
impairment losses. The cost of an intangible asset initially recognised includes its purchase price and any
directly attributable costs necessary to prepare the asset for its intended use. Depreciation is calculated on a
straight-line basis over the estimated useful life, which is 3 years for software.
175
Note 13
Property, Plant and Equipment
EUR'000 | Vessels | Dry dock | Other fixtures and fittings | Assets under construction | Total |
Cost 2025 | |||||
Beginning of financial year | 1,056,664 | 17,644 | 13,513 | 736,610 | 1,824,431 |
Additions | 71,255 | 843 | 3,661 | 1,254,658 | 1,330,417 |
Transfer from assets under construction | 1,381,140 | 20,423 | (10,371) | (1,391,192) | — |
Disposals | — | — | (124) | — | (124) |
Exchange differences | — | — | — | — | — |
31 December 2025 | 2,509,059 | 38,910 | 6,679 | 600,076 | 3,154,724 |
Accumulated depreciation and impairment | |||||
Beginning of financial year | 104,119 | 6,541 | 1,505 | — | 112,165 |
Depreciation charge | 97,615 | 6,425 | 1,582 | — | 105,622 |
Disposals | — | — | (123) | — | (123) |
Exchange differences | — | — | — | — | — |
31 December 2025 | 201,734 | 12,966 | 2,964 | — | 217,664 |
Net book value | 2,307,325 | 25,944 | 3,715 | 600,076 | 2,937,060 |
Additions during 2025 are mainly driven by newbuild vessels of P-class vessels of EUR 199 million, newbuild
A-class vessels of EUR 385 million, newbuild M-class vessels of EUR 436 million, and vessel upgrades of EUR
48 million. In 2025, Wind Pace, Wind Mover, Wind Maker and Wind Ally vessels were delivered and
transferred from asset under construction to vessels.
Borrowing costs (including cash and non-cash items) for 2025 have been capitalised in a total amount of
EUR 53.9 million (2024: 19.7 million; 2023: EUR 7.1 million). The capitalisation rate used to determine the
amount of borrowing costs to be capitalised is the weighted average interest rate applicable to the
Company’s general borrowings during the reporting period, being 6.05% (2024: 7.6%; 2023: 5.5%).
176
Note 13
Property, Plant and Equipment
Continued from previous page
EUR'000 | Vessels | Dry dock | Other fixtures and fittings | Assets under construction | Total |
Cost 2024 | |||||
Beginning of financial year | 566,360 | 9,135 | 979 | 571,745 | 1,148,219 |
Additions | 8,029 | 4,377 | 12,680 | 624,679 | 649,765 |
Transfer from assets under construction | 468,678 | 4,000 | — | (472,678) | — |
Disposals | (5,146) | — | (306) | — | (5,452) |
Exchange differences | 18,743 | 132 | 160 | 12,864 | 31,899 |
31 December 2024 | 1,056,664 | 17,644 | 13,513 | 736,610 | 1,824,431 |
Accumulated depreciation and impairment | |||||
Beginning of financial year | 58,727 | 3,548 | 312 | — | 62,587 |
Depreciation charge | 50,571 | 3,125 | 1,166 | — | 54,862 |
Disposals | (5,000) | — | (306) | — | (5,306) |
Impairment on disposal | — | — | — | — | — |
Exchange differences | (179) | (132) | 333 | — | 22 |
31 December 2024 | 104,119 | 6,541 | 1,505 | — | 112,165 |
Net book value | 952,545 | 11,103 | 12,008 | 736,610 | 1,712,266 |
Additions during 2024 are mainly driven by newbuild P-class vessels of EUR 290 million, newbuild A-class
vessels of EUR 114 million, newbuild M-class vessels of EUR 103 million, O-class main crane upgrades of EUR
62 million, and vessel upgrades of EUR 54 million. In 2024, Wind Peak vessel was delivered and transferred
from asset under construction to vessels.
Borrowing costs for 2024 have been capitalised for a total of EUR 19.7 million (2023: EUR 7.1 million). The
capitalisation rate used to determine the amount of borrowing costs to be capitalised is the weighted
average interest rate applicable to the Company’s general borrowings during the reporting period, being
7.6% (2023: 5.5%).
177
Note 13
Property, Plant and Equipment
Continued from previous page
EUR'000 | Vessels | Dry dock | Other fixtures and fittings | Assets under construction | Total |
Cost 2023 | |||||
Beginning of financial year | 282,282 | 9,261 | 536 | 356,163 | 648,242 |
Acquisition of businesses | 296,536 | 171 | 599 | 144,219 | 441,525 |
Additions | 227 | — | 3 | 73,169 | 73,399 |
Disposals | (8,002) | (291) | — | — | (8,293) |
Exchange differences | (4,683) | (6) | (159) | (1,806) | (6,654) |
December 31, 2023 | 566,360 | 9,135 | 979 | 571,745 | 1,148,219 |
Accumulated depreciation and impairment | |||||
Beginning of financial year | 39,570 | 2,023 | 445 | — | 42,038 |
Depreciation charge | 20,847 | 1,637 | 19 | — | 22,503 |
Disposals | (5,722) | (108) | — | — | (5,830) |
Impairment on disposal | 5,000 | — | — | — | 5,000 |
Exchange differences | (968) | (4) | (152) | — | (1,124) |
December 31, 2023 | 58,727 | 3,548 | 312 | — | 62,587 |
Net book value | 507,633 | 5,587 | 667 | 571,745 | 1,085,632 |
178
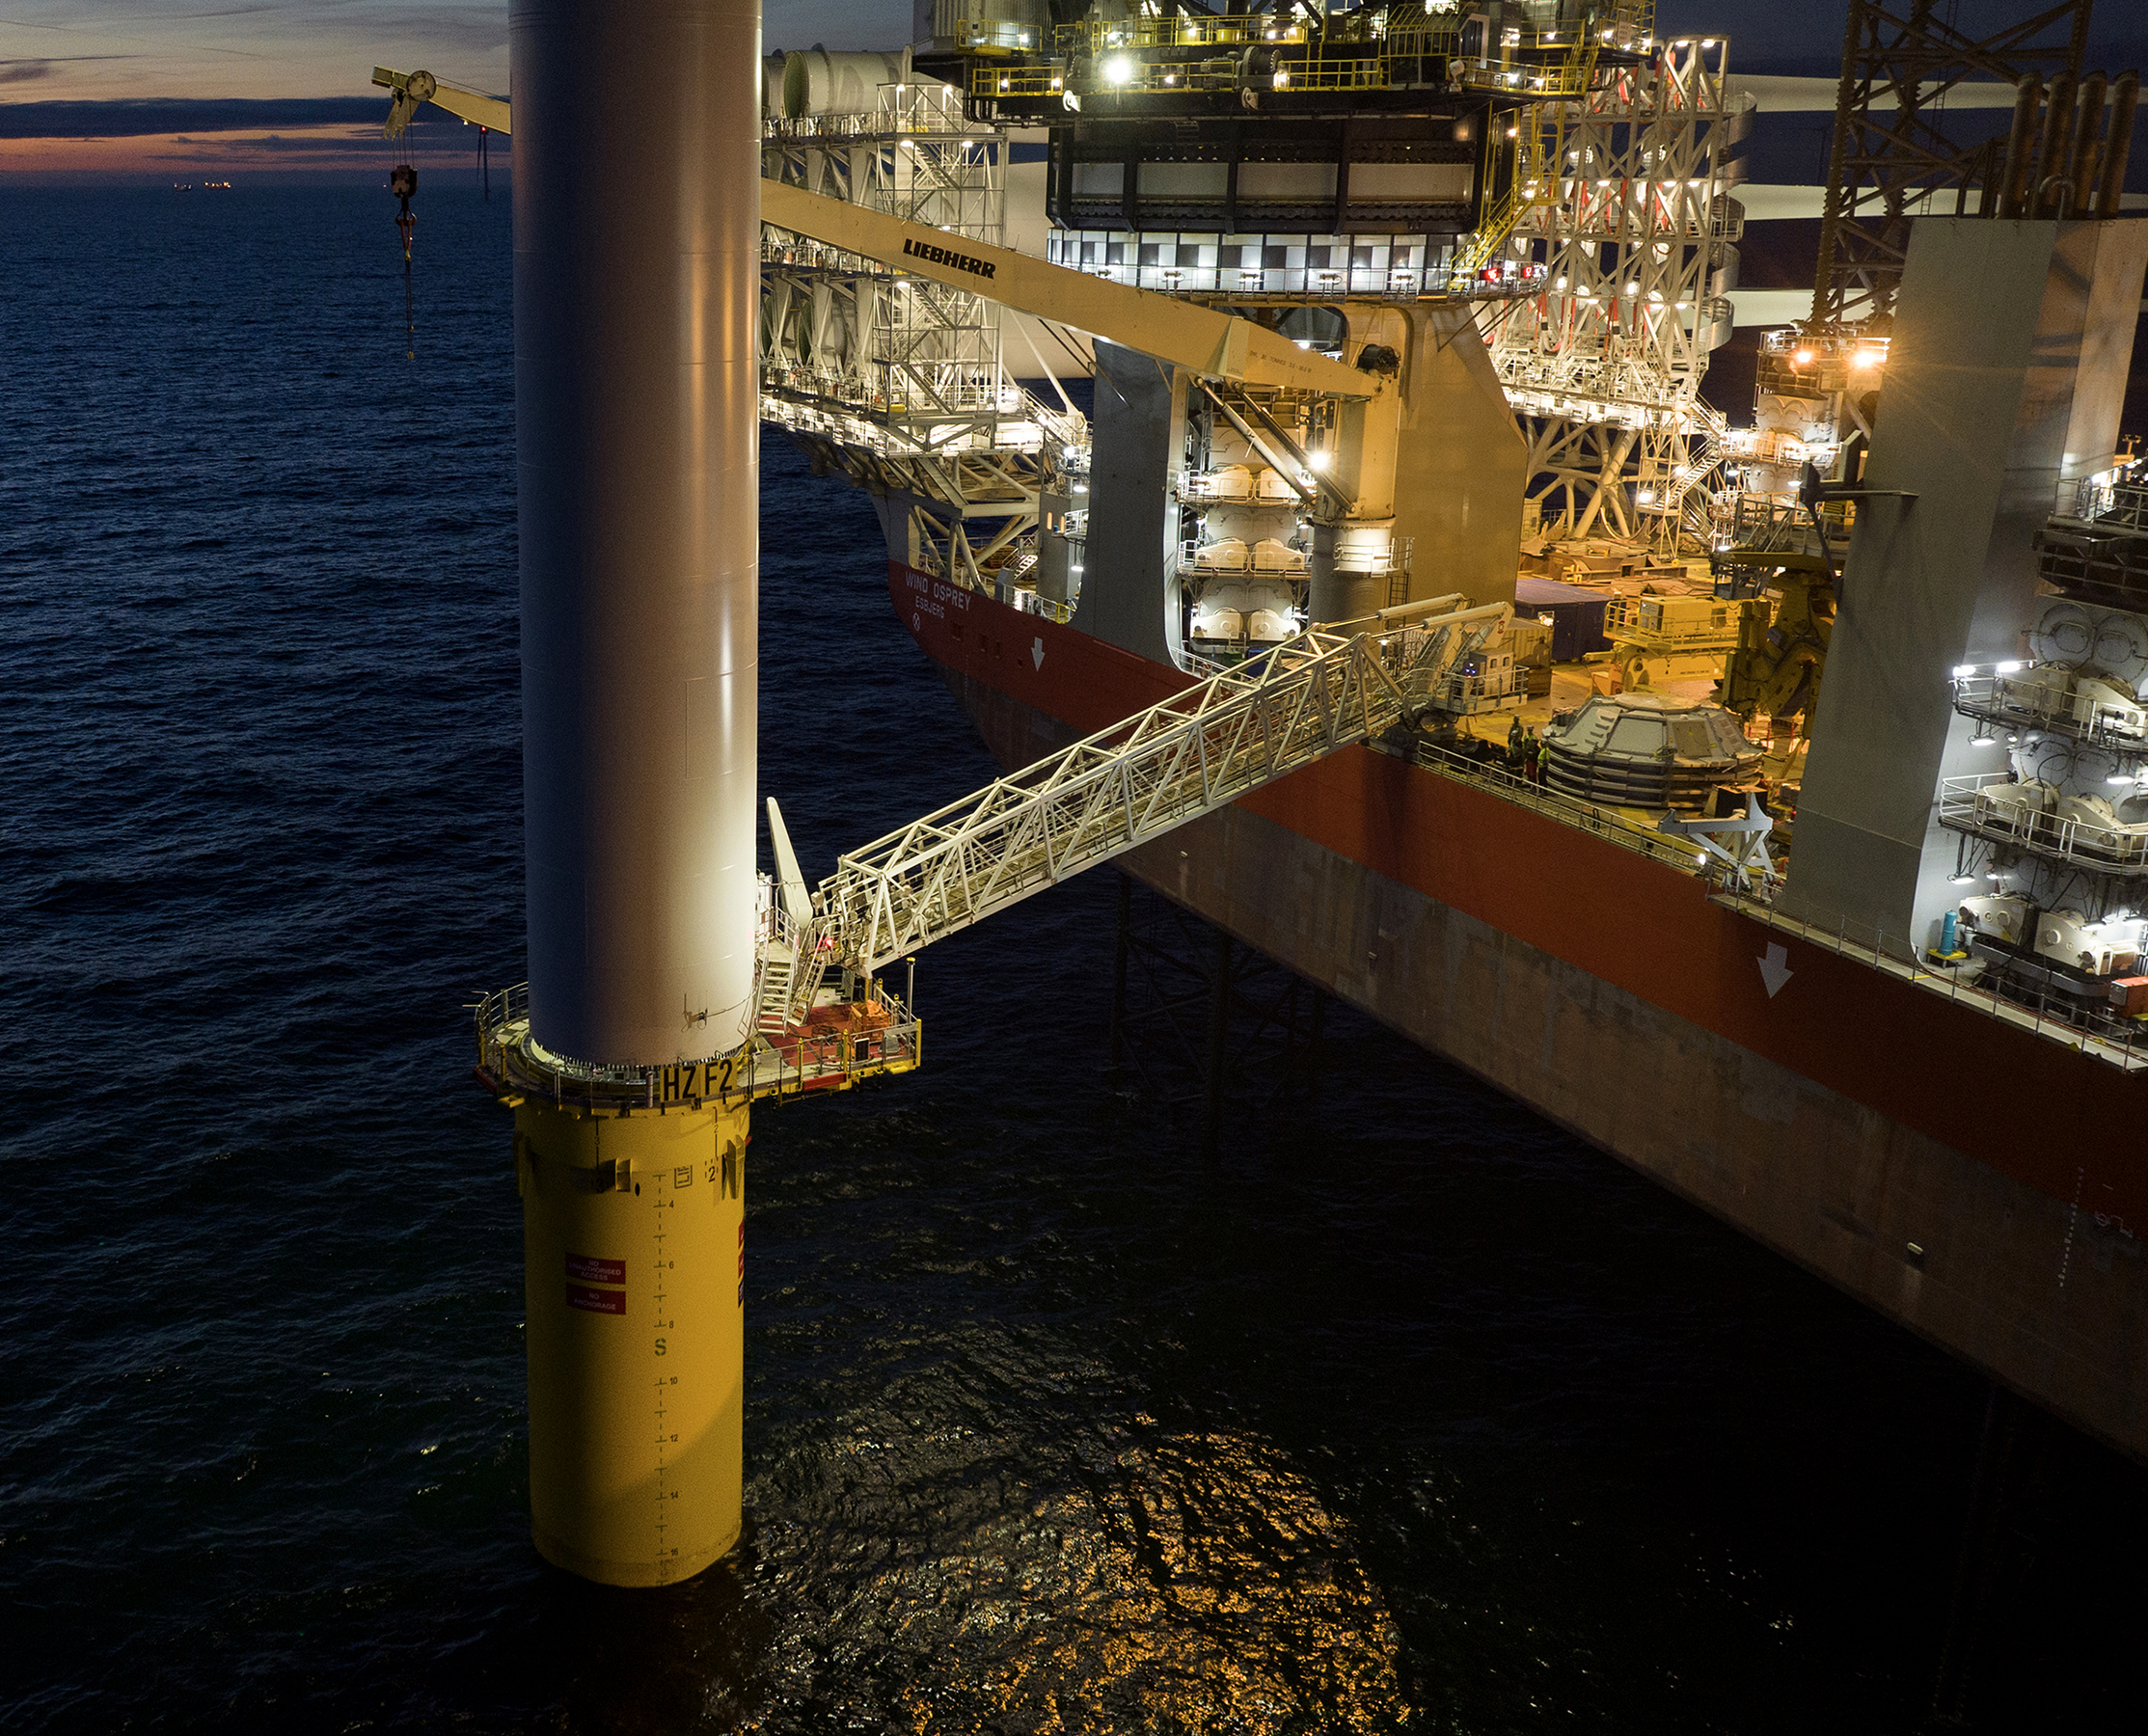
Note 13
Property, Plant and Equipment
Continued from previous page
Due to the business combination with Eneti, the Group’s property, plant, and equipment increased by EUR
441.5 million in 2023. This increase primarily comprised the operating vessels Wind Scylla and Wind Zaratan
(EUR 206 million and EUR 87 million, respectively) as well as the newbuilds under construction, including the
M-class down payments for EUR 144 million.
Additions during 2023 were mainly driven by down payments of EUR 42 million for new P-class installation
vessels (EUR 15.4 million), the new A-class FIVs (foundation installation vessels) (EUR 3.8 million) and
instalments for the main cranes for both Wind Orca (EUR 16.0 million) and Wind Osprey (EUR 6.8 million), as
presented above under assets under construction. In addition, assets under construction include EUR
7.6 million of guarantee fees to BW Group related to the A-class and P-class newbuild vessels as well as EUR
5.7 million of assets related to future projects that have not yet commenced.
Borrowing costs for 2023 were capitalised in a total amount of EUR 7.1 million. The capitalisation rate used
to determine the amount of borrowing costs to be capitalised is the weighted average interest rate
applicable to the Company’s general borrowings during the reporting period, being 5.5%.
Disposals during 2023 were mainly driven by the main cranes upgraded on both O-class vessels, as well as
impairment recognised. For further details, please refer to Note 5.
179
Note 13
Property, Plant and Equipment
Continued from previous page
Accounting policies
Property, plant and equipment are recognised at cost less accumulated depreciation and accumulated
impairment losses.
The cost of an item of property, plant and equipment initially recognised includes its purchase price and any
costs that are directly attributable to bringing the asset to the location and condition necessary for it to be
capable of operating in the manner intended by management.
Subsequent expenditure relating to property, plant and equipment that has already been recognised is
added to the carrying amount of the asset only when it is probable that future economic benefits associated
with the item will flow to the Group and the cost of the item can be measured reliably. All other repair and
maintenance expenses are recognised in profit or loss as incurred.
To maintain operational capability, the vessels are required to undergo dry-docking procedures every five
years. The costs of the dry-docking procedures are capitalised at cost, including any costs that are directly
attributable to bringing the vessels to the location and condition necessary for the dry-docking procedures.
Depreciation is calculated using the straight-line method to allocate their depreciable amounts over the
assets’ estimated useful life. The estimated useful lives are as follows:
Useful life | |
Vessels and furnished equipment | Up to 25 years |
Drydock | 5 years |
Cars | 5 years |
Other fixtures and fittings | 2 to 3 years |
The estimated useful life of the vessels of up to 25 years has been determined by an external consultant
through a fatigue analysis based on the technical specification of the vessels, whereas for Wind Peak, the
estimated useful life has been determined based on an internal technical analysis, validated by an external
expert. The estimated useful life of these vessels depends on the initial delivery date.
Prior to their acquisition, Wind Orca and Wind Osprey, had already been in use for eight years, therefore the
remaining useful life of these vessels is estimated at 17 years for all components except for the jacking
system and the main crane, which have a remaining useful life of three years from the acquisition date. For
Wind Scylla and Wind Zaratan, the remaining useful lives at the acquisition date were assessed to be 17 and
14 years respectively, and all components are assigned the same useful life. Hull and steel components have
a salvage value of up to EUR 15 million per vessel at the end of their useful lives. Both the salvage value and
the residual value are estimated as the lightweight tonnage of each vessel multiplied by the scrap value per
tonne. Depreciation is based on costs less the estimated residual value.
Further information is provided in Note 2.4, Material accounting judgements, estimates and assumptions, in
relation to vessels acquired through the business combination.
The residual value, useful life, and methods of depreciation of property, plant, and equipment are reviewed
at each financial year end and adjusted accordingly, if appropriate.
Borrowing costs
Borrowing costs are capitalised in accordance with IAS 23, where borrowing costs directly attributable to the
construction of assets are capitalised until the asset is substantially ready for its intended use. Borrowing
costs consist of interest and other costs incurred by the Group incurs in connection with the borrowing of
funds, including guarantee fees provided by related parties.
Impairment of non-financial assets
Property, plant and equipment and right-of-use assets are tested for impairment whenever there is
objective evidence or an indication that these assets may be impaired. Refer to note 12 for further
information impairment testing.
180
Note 14
Right-of-Use Assets and Lease Liabilities
Nature of the Group’s leasing activities
Office space
The Group leases office space for the purpose of office operations. In 2025, the company terminated the
lease agreement for its office in Great Yarmouth and entered into a lease contract for a new location in
Norwich, effective March 2025, with a binding period of 10 years. Additionally, the Company entered into 5-
year leases for office premises in Monaco and Taiwan, and a 3-year lease for a new office in Vejle.
Warehouse facilities
The Group leases a warehouse facility located in the UK.
EUR'000 | Leasehold equipment | Warehouse facilities | Office space | Total |
Cost 2025 | ||||
Beginning of financial year | — | — | 13,324 | 13,324 |
Additions | — | — | 4,122 | 4,122 |
Disposals | — | — | (228) | (228) |
Exchange differences | — | — | — | — |
31 December 2025 | — | — | 17,218 | 17,218 |
Accumulated depreciation | ||||
Beginning of financial year | — | — | 2,987 | 2,987 |
Depreciation charge | — | — | 1,861 | 1,861 |
Disposals | — | — | (228) | (228) |
Exchange differences | — | — | — | — |
31 December 2025 | — | — | 4,620 | 4,620 |
Carrying amount | — | — | 12,598 | 12,598 |
181
Note 14
Right-of-Use Assets and Lease Liabilities
Continued from previous page
EUR'000 | Leasehold equipment | Warehouse facilities | Office space | Total |
Cost 2024 | ||||
Beginning of financial year | 464 | 409 | 2,261 | 3,134 |
Acquisition of businesses | — | — | 10,864 | 10,864 |
Disposals | (464) | (429) | — | (893) |
Exchange differences | — | 20 | 199 | 219 |
31 December 2024 | — | — | 13,324 | 13,324 |
Accumulated depreciation | ||||
Beginning of financial year | 464 | 24 | 1,673 | 2,161 |
Depreciation charge | — | 235 | 1,144 | 1,379 |
Disposals | (464) | (265) | — | (729) |
Exchange differences | — | 6 | 170 | 176 |
31 December 2024 | — | — | 2,987 | 2,987 |
Carrying amount | — | — | 10,337 | 10,337 |
EUR'000 | Leasehold equipment | Warehouse facilities | Office space | Total |
Cost 2023 | ||||
Beginning of financial year | 464 | — | 1,681 | 2,145 |
Acquisition of businesses | — | 421 | 612 | 1,033 |
Exchange differences | — | (12) | (32) | (44) |
31 December 2023 | 464 | 409 | 2,261 | 3,134 |
Accumulated depreciation | ||||
Beginning of financial year | 381 | — | 1,477 | 1,858 |
Depreciation charge | 83 | 30 | 221 | 334 |
Exchange differences | — | (6) | (25) | (31) |
31 December 2023 | 464 | 24 | 1,673 | 2,161 |
Carrying amount | — | 385 | 588 | 973 |
182
Note 14
Right-of-Use Assets and Lease Liabilities
Continued from previous page
EUR'000 | 2025 | 2024 | 2023 |
Lease liabilities at 1 January (current and non-current lease) | 10,971 | 993 | 279 |
Acquisition of subsidiaries | — | — | 1,299 |
Additions during the year | 4,640 | 11,909 | — |
Exchange differences | — | 30 | (16) |
Repayment of lease obligations | (2,072) | (1,961) | (569) |
Total lease liabilities at 31 December | 13,539 | 10,971 | 993 |
Current | 1,057 | 1,274 | 601 |
Non-current | 12,482 | 9,697 | 392 |
Leas interest expenses recognised in profit and loss
1.Interest expense
EUR'000 | 2025 | 2024 | 2023 |
Interest expense on lease liabilities (vessels and office) | 746 | 428 | 25 |
1.Lease expense not capitalised in lease liabilities
EUR'000 | 2025 | 2024 | 2023 |
Short-term lease expense | 614 | 477 | 180 |
Total cash outflow for all leases in 2025, 2024 and 2023 were EUR 2,686 thousand, EUR 1,152 thousand and
EUR 283 thousand respectively, excluding variable lease fee (refer to Note 24). Please refer to Note 28 for
disclosure on lease commitments.
Accounting policies
Right-of-Use Assets
The Group recognises a right-of-use asset and lease liability at the date on which the underlying asset is
made available for use. Right-of-use assets are measured at cost, which comprises the initial measurement
of the lease liability using an incremental borrowing rate adjusted for any lease payments made at or before
the commencement date and any lease incentives received. Any initial direct costs that would not have been
incurred if the lease had not been obtained are included in to the carrying amount of the right-of-use
assets.
The right-of-use asset is subsequently measured at cost, less any accumulated depreciation and impairment
losses, and adjusted for any remeasurement of the lease liability.
Right-of-use assets are depreciated on a straight-line basis over the lease term.
Right-of-use assets are tested for impairment whenever there is objective evidence or an indication that
these assets may be impaired. For further information regarding impairment testing. please refer to Note 13.
Lease liabilities
At the inception of a contract, the Group assesses whether the contract contains a lease. A contract contains
a lease if it conveys the right to control the use of an identified asset for a period of time in exchange for
consideration. Reassessment is required only when the terms and conditions of the contract are changed.
183
Note 14
Right-of-Use Assets and Lease Liabilities
Continued from previous page
At the commencement date of the lease, the Group recognises lease liabilities measured at the present
value of lease payments to be made over the lease term. The lease payments include fixed payments
(including in-substance fixed payments) less any lease incentives receivable, variable lease payments that
depend on an index or a rate, and amounts expected to be paid under residual value guarantees.
Variable lease payments that do not depend on an index or a rate are recognised as expenses in the period
in which the event or condition that triggers the payment occurs. Utilisation based lease fees are classified
as variable lease payments.
In calculating the present value of lease payments, the Group uses its incremental borrowing rate at the
lease commencement date, as the interest rate implicit in the lease is not readily determinable. After the
commencement date, the carrying amount of lease liabilities is increased to reflect the accretion of interest
and reduced by lease payments made.
In addition, the carrying amount of lease liabilities is remeasured if there is a modification, a change in the
lease term, a change in the lease payments (e.g., changes to future payments resulting from a change in an
index or rate used to determine such lease payments) or a change in the assessment of an option to
purchase the underlying asset.
Short-term and low-value leases
The Group has elected not to recognise right-of-use assets and lease liabilities for short-term leases with
lease terms of twelve months or less, and for low-value leases. Lease payments relating to these leases are
expensed to profit or loss on a straight-line basis over the lease term. Short-term and low-value leases
include cars, coffee machines, office premises and AV equipment.
Note 15
Inventories
EUR'000 | 2025 | 2024 | 2023 |
Fuel and oil | 3,540 | 1,039 | 1,836 |
As of 31 December 2025, the Company's inventories include fuel and oil totalling EUR 4 million.
As of 31 December 2024, the Company's inventories include fuel and oil totalling EUR 1.0 million, a decrease
from EUR 1.8 million in 2023, primarily because three of the Company’s four operating vessels were off hire
at the end of the reporting period.
Accounting policies
Inventories are carried at the lower of cost and net realisable value. Cost is determined using the first-in,
first-out basis. Net realisable value is the estimated selling price in the ordinary course of business, less
applicable variable selling expenses. Inventories mainly comprise fuel and oil.
184
Note 16
Trade and Other Receivables
EUR'000 | 2025 | 2024 | 2023 |
Trade receivables from non-related parties | 117,734 | 51,467 | 26,802 |
Contract assets | 81,923 | 37,609 | 8,880 |
Receivables from related parties | — | 214 | 592 |
Other receivables | 21,295 | 11,305 | 3,158 |
Total trade receivables and other receivables | 220,952 | 100,595 | 39,432 |
As of 31 December 2025, the Company's receivables include contract assets totalling EUR 81.9 million, a
significant increase from EUR 37.6 million in 2024 (2023: EUR 8.9 million). These contract assets represent
the Company's entitlement to consideration for work performed to date on ongoing projects as of the
balance sheet date. Typically, these contract assets are reclassified to trade receivables when the Company
fulfils its obligations and the right to consideration becomes unconditional.
The balance of other receivables includes contract fulfilment costs amounted to EUR 14 million (EUR
8.5 million in 2024 and nil in 2023). These costs represent expenditures directly incurred in fulfilling contracts
with customers, such as direct labour, materials, and other costs necessary to complete the performance
obligations under the contracts. These costs are recognized as assets as they are expected to be recovered
over the life of the respective contracts. Contract costs are amortised on a systematic basis that is consistent
with the transfer of the related goods or services to the customer. For accounting policies, refer to Note 3.
The table below outlines movements in contract assets during the year:
EUR'000 | 2025 | 2024 | 2023 |
Contract assets at 1 January | 37,609 | 8,880 | 19,999 |
Acquisition of businesses | — | — | 8,266 |
Recognised during the period | 81,923 | 37,710 | 614 |
Transfer to receivables | (37,609) | (8,880) | (19,999) |
Exchange differences | — | (101) | — |
Total contract assets at 31 December | 81,923 | 37,609 | 8,880 |
Current | 81,923 | 37,609 | 8,880 |
Non-current | — | — | — |
185
Note 16
Trade and Other Receivables
Continued from previous page
Expected credit loss on trade receivables
The Group has historically only experienced immaterial credit losses on trade receivables, if any. In addition,
a material part of the cash flows under the Group’s contracts consist of prepayments received up front.
The Group's assessment remains consistent with its historical experiences. Although certain receivables may
become up to 30 days overdue, the Group’s overall credit risk profile remains unchanged. This assessment is
supported by historical loss data, a limited number of reliable counterparties, and the Group’s forward-
looking outlook.
Accounting policies
Financial assets
The classification of financial assets depends on the Group’s business model for managing the financial
assets as well as the contractual terms of the cash flows of the respective financial assets.
(1)At initial recognition: the Group measures a financial asset at fair value, plus, in the case of a
financial asset not measured at fair value through profit or loss, transaction costs that are directly
attributable to the acquisition of the financial assets. Transaction costs of financial assets carried at
fair value through profit or loss are recognised as an expense in profit or loss.
(1i)At subsequent measurement: the Group’s financial assets mainly comprise cash and bank balances,
trade receivables and other current assets.
Interest income from these financial assets is recognised using the effective interest rate method.
The Group assesses on a forward-looking basis the expected credit losses associated with its financial assets
carried at amortised cost. For trade and other receivables, the Group applied the simplified approach
permitted by IFRS 9, which requires lifetime expected losses to be recognised from initial recognition of the
receivables.
EUR'000 | Trade receivables | Contract assets | Expected loss | Total |
31 December 2025 | ||||
Not due | 115,559 | 81,923 | — | 197,482 |
Overdue 1-30 days | 716 | — | — | 716 |
Overdue 31 to 60 days | 1,459 | — | — | 1,459 |
Overdue +61 days | — | — | — | — |
Total | 117,734 | 81,923 | — | 199,657 |
31 December 2024 | ||||
Not due | 49,029 | 37,609 | — | 86,638 |
Overdue 1-30 days | — | — | — | — |
Overdue 31 to 60 days | 2,373 | — | — | 2,373 |
Overdue +61 days | 65 | — | — | 65 |
Total | 51,467 | 37,609 | — | 89,076 |
31 December 2023 | ||||
Not due | 9,639 | 8,880 | — | 18,519 |
Overdue 1-30 days | 14,287 | — | — | 14,287 |
Overdue 31 to 60 days | 603 | — | — | 603 |
Overdue +61 days | 2,273 | — | — | 2,273 |
Total | 26,802 | 8,880 | — | 35,682 |
186
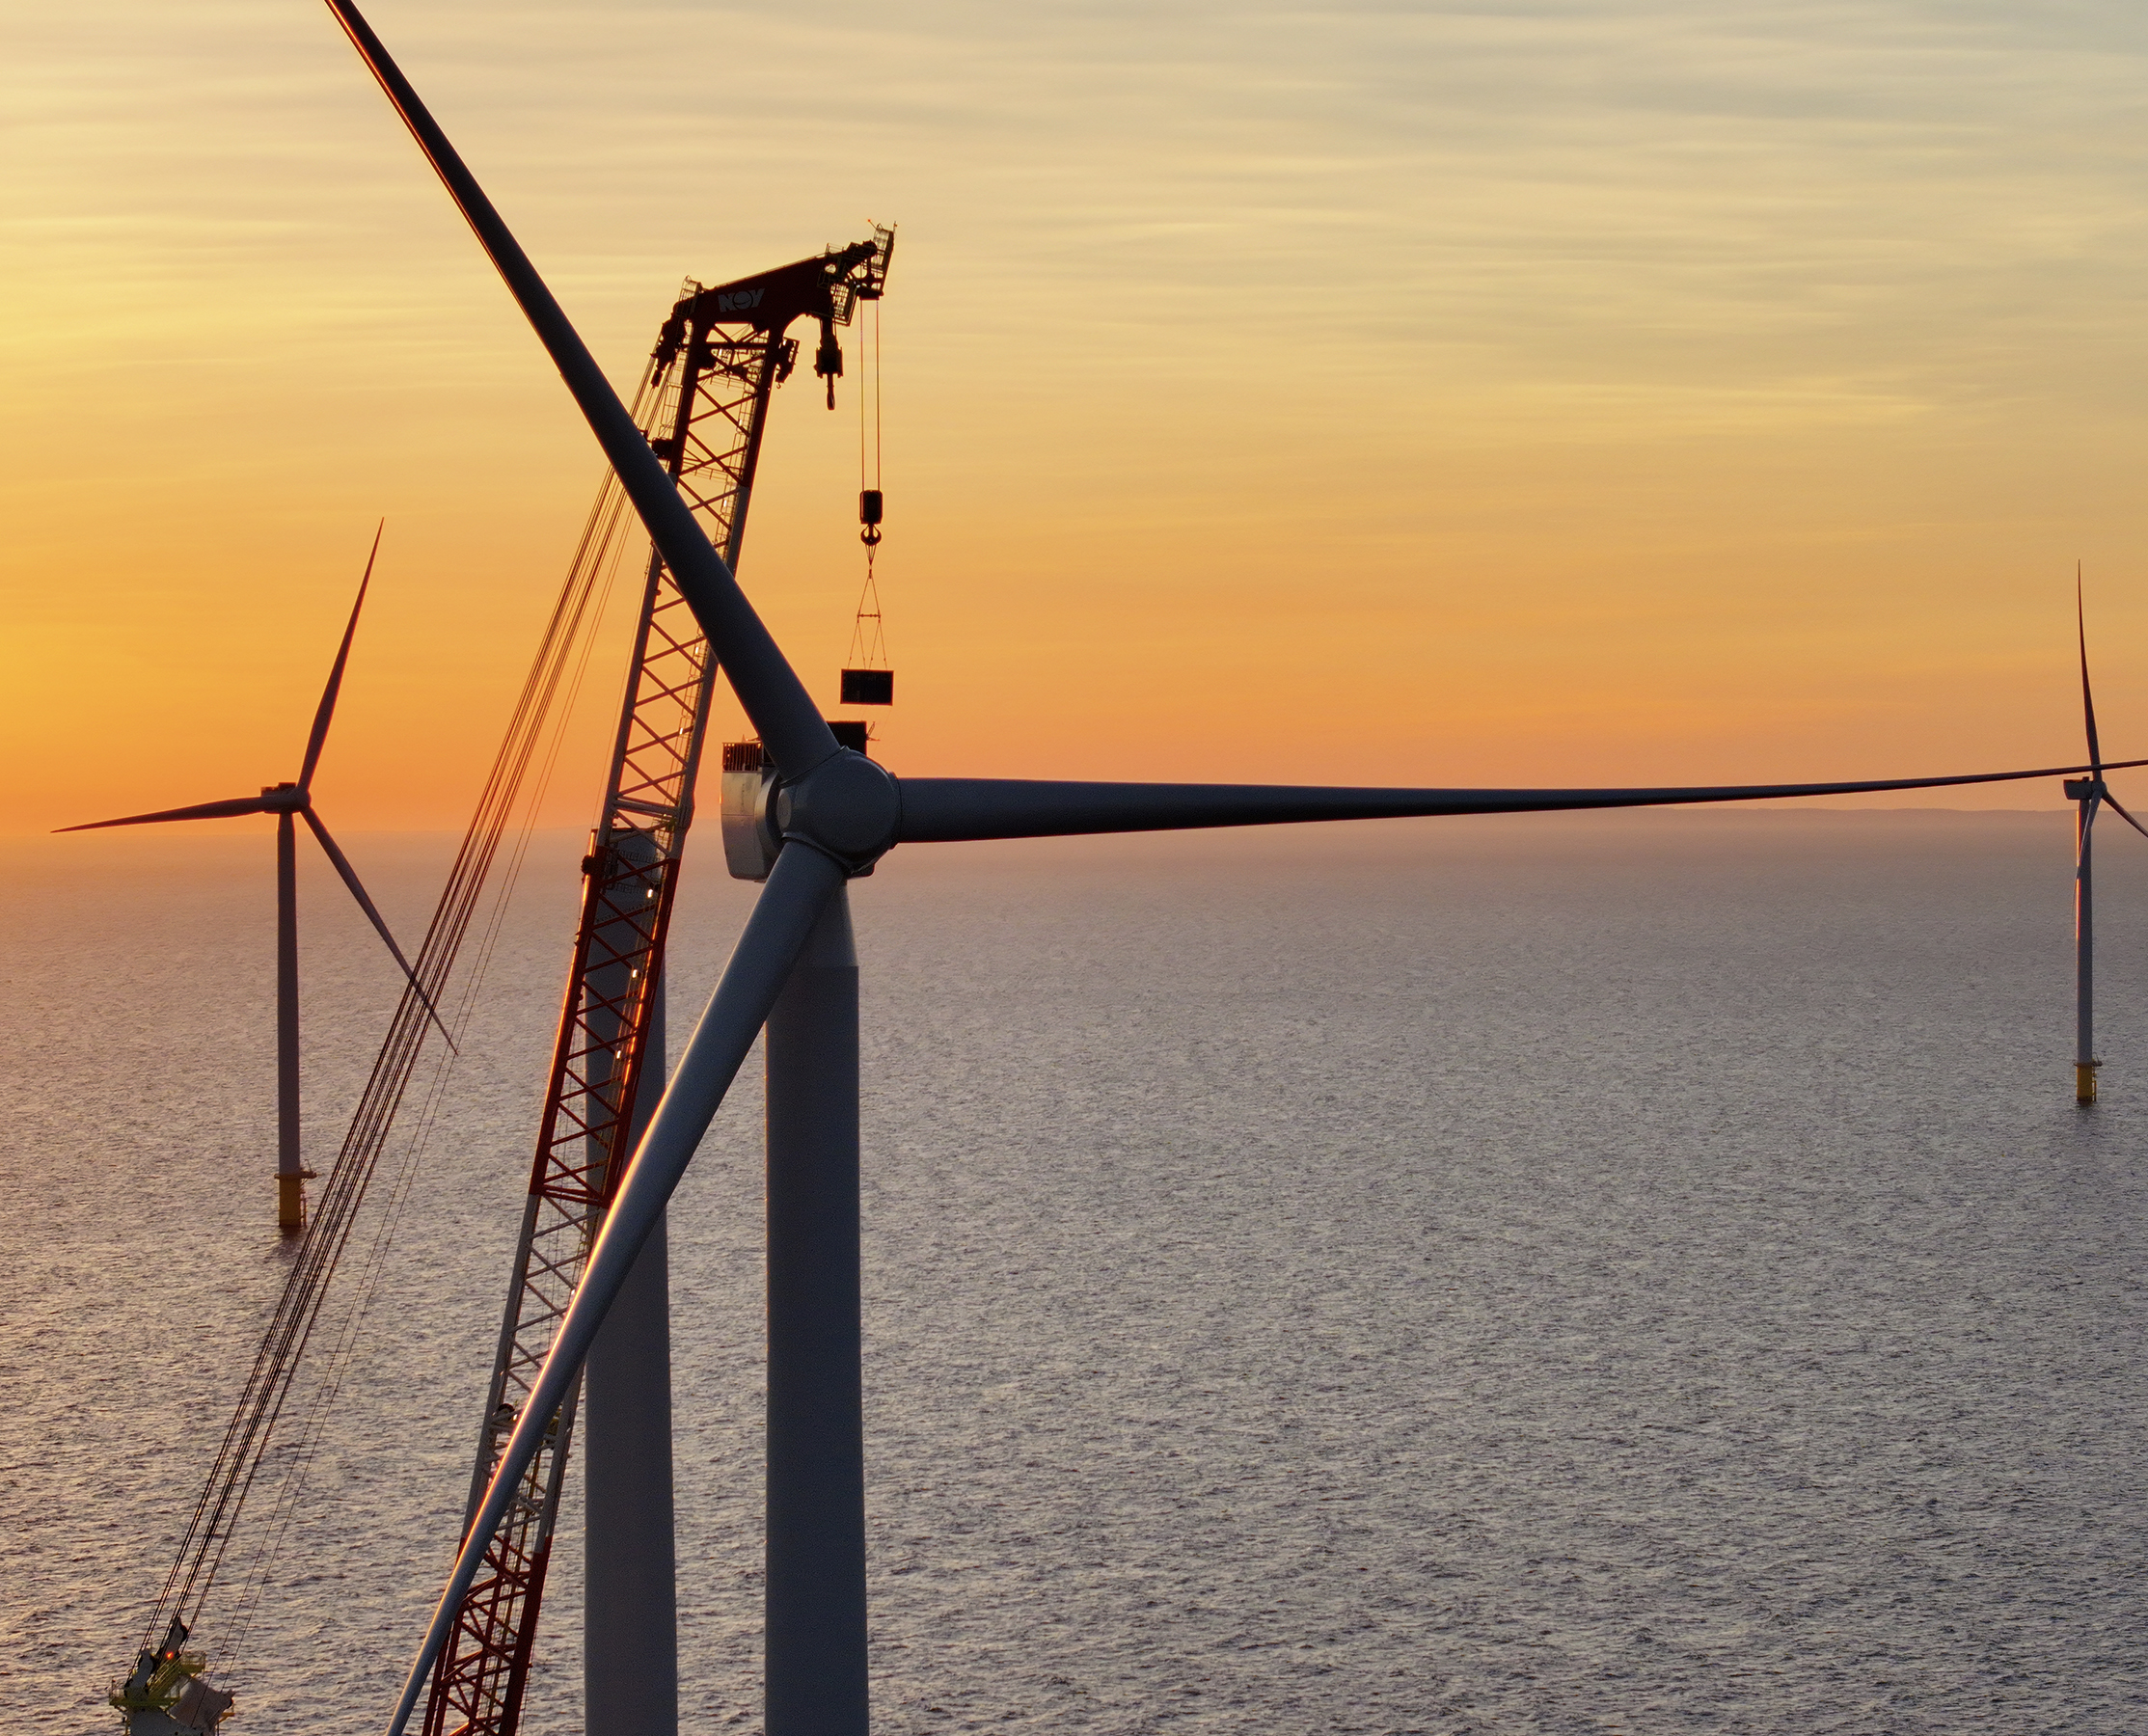
Note 17
Prepayments and other non-current assets
EUR'000 | 2025 | 2024 | 2023 |
Prepayments (Current) | 13,523 | 16,643 | 9,562 |
Prepayments include deferred costs like bank loan fees, commitment fees of uncommitted facilities, annual
insurance premiums and annual software subscriptions.
EUR'000 | 2025 | 2024 | 2023 |
Other non-current assets | 54,069 | 7,211 | — |
Other non-current assets include EUR 20 million primarily relating to certain prepayments.
Cash deposits subject to restrictions, of 34.1 million as at 31 December 2025 (2024: 7.2 million) are included
in the Other non-current assets balance.
Note 18
Cash and Cash Equivalents
EUR'000 | 2025 | 2024 | 2023 |
Cash at bank and on hand | 151,679 | 51,253 | 96,608 |
The Company held cash as of 31 December 2025 with the intention of paying assets under construction-
related instalments in 2026.
Accounting policies
Cash and cash equivalents consist of cash net of short-term bank overdrafts, as these are considered an
integral part of the Group’s cash management. Cash and cash equivalents are measured at amortised cost.
187
Note 19
Statement of Cash Flows Specifications
EUR'000 | Note | 2025 | 2024 | 2023 |
Adjustments of non-cash items | ||||
Depreciation and amortisation | 12 , 13 , 14 | 107,520 | 56,595 | 23,048 |
Impairment of fixed assets | 13 | — | — | 5,000 |
Non-cash disposals of property, plant and equipment and intangible assets | 12 , 13 | 1 | 183 | — |
Other operating income and expenses, net | 5 | — | — | (137) |
Finance income | 9 | (1,714) | (3,294) | — |
Interest expenses | 9 | 15,993 | 428 | 1,898 |
Finance costs | 9 | (725) | 2,589 | — |
Income tax expense | 7,680 | 2,401 | — | |
Fair value change of derivative instruments through profit or loss | 9 | 630 | (427) | 766 |
Items recycled | 25 | 947 | — | — |
Share-based payment expenses | 2,071 | 1,662 | 1,134 | |
Total adjustments of non-cash items | 132,403 | 60,137 | 31,709 |
Changes in working capital | Note | 2025 | 2024 | 2023 |
Inventories | (2,501) | 788 | (1,140) | |
Trade receivables, contract assets, prepayments and other receivables | (133,704) | (62,706) | 28,541 | |
Trade and other payables | 8,126 | 380 | (16,087) | |
Provisions | (841) | (6,059) | — | |
Receivables from related parties | — | 414 | — | |
Payables to related parties | 49 | 51 | 73 | |
Deferred revenue | 112,280 | 33,482 | 8,787 | |
Net change in working capital | (16,591) | (33,650) | 20,174 |
188
Note 20
Provisions, Trade and Other Payables
EUR'000 | 2025 | 2024 | 2023 |
Trade and other payables: | |||
Trade payables | 22,388 | 11,577 | 8,399 |
Other payables | 75,820 | 32,018 | 24,237 |
Total trade and other payables | 98,208 | 43,595 | 32,636 |
The increase in other payables is attributable to year-end activity and the timing of payment processing.
EUR'000 | 2025 | 2024 | 2023 |
Provisions at 1 January: | 841 | 6,899 | — |
Acquisition of businesses | — | — | 6,987 |
Additions during the year | — | — | — |
Utilised during the year | (421) | (4,570) | — |
Reversed during the year | (420) | (1,576) | — |
Exchange differences | — | 88 | (88) |
Total provisions at 31 December | — | 841 | 6,899 |
Current | — | 841 | 2,086 |
Non-current | — | — | 4,813 |
The provisions relate to an onerous contract and were released in 2025 following the settlement of the
related obligations. For further information, please refer to Note 4.
Accounting policies
Trade and other payables represent liabilities for goods and services provided to the Group before the end
of the financial year, that remain unpaid. They are classified as current liabilities if payment is due within one
year or less (within the normal operating cycle of the business, if longer). Otherwise, they are presented as
non-current liabilities. Trade and other payables are initially recognised at fair value, and subsequently
carried at amortised cost, using the effective interest method.
A provision is recognised for certain contracts with customers where the unavoidable costs of meeting the
performance obligations exceed the economic benefits expected to be received. These costs are expected
to be incurred in the following financial year.
189
Note 21
Deferred Income Taxes
Deferred tax charge
Deferred tax is recognised in respect of temporary differences between the carrying amounts of assets and
liabilities for financial reporting purposes and the amounts used for income tax purposes, in accordance
with IAS12. Deferred tax is calculated at the income tax rates expected to apply in the period when the
liability is settled or the asset is realised, based on tax laws that have been enacted or substantively enacted
at the balance sheet date. The deferred tax is recognised in profit or loss, except when it relates to other
items recognised in other comprehensive income.
Deferred tax assets and liabilities
The Group has unrecognised deferred tax assets in Denmark and the UK, amounting to EUR 52 millon
(31 December 2024: EUR 12 million; 31 December 2023: EUR 13 million) and EUR 52 million (31 December
2024: EUR 89 million; 31 December 2023: EUR 124 million), respectively. These deferred tax assets arise from
tax losses and shipping allowances. No deferred tax asset has been recognised as of 31 December 2025, as
they are not expected to be utilised within the foreseeable future three to five). A majority of the Group’s UK
unrecognised deferred asset will be forfeited on 1 January 2025 as a result of the Group’s UK tonnage tax
election.
The Group has a deferred tax liability relating to the ownership of the Wind Zaratan vessel in Japan, arising
from temporary differences between the carrying amount and the tax base of the vessel (2025: EUR
43 million; 2024: EUR 17 million; 2023: 14 million), offset by the tax value of tax losses (2025: EUR 30 million;
2024: EUR 5 million; 2023: 4 million). As of 31 December 2025, deferred tax liabilities amounted to EUR 13
million (2024: EUR 12 million).
For accounting policies on deferred taxes, please refer to Note 10.
EUR'000 | 2025 | 2024 | 2023 |
Reconciliation of deferred tax liabilities, net | |||
1 January | 11,972 | 10,191 | — |
Acquisition of businesses | — | — | 10,321 |
Movements during the year | 1,284 | 1,137 | — |
Exchange differences | — | 644 | (130) |
31 December | 13,256 | 11,972 | 10,191 |
190
Note 22
Issued Share Capital
EUR'000 | No. of shares (in thousands) | Total |
Beginning of financial year 2023 | 197,600 | 26,575 |
First issue for capital increase 2023 | 113,809 | 15,263 |
End of financial year 2023 | 311,409 | 41,838 |
First issue for capital increase 2024 | 39,520 | 5,302 |
Second issue for capital increase 2024 | 28 | 4 |
End of financial year 2024 | 350,957 | 47,144 |
End of financial year 2025 | 350,957 | 47,144 |
As of 31 December 2025, the Group had share capital amounting to DKK 350,958 thousand, equal to EUR
47,144 thousand, consisting of 350,957,583 shares of nominal DKK1 each.
All shares have equal rights.
Treasury shares
On 30 May 2025, the Company completed a share buy-back program to fulfil share-based incentive
obligations resulting in the repurchase of 395,200 shares of a nominal price of DKK 1 each at an average
price of NOK 49.90, corresponding to an aggregate amount of EUR 1.7 million, including commission. As of
31 December 2025, the Company holds 89,992 treasury shares.
Accounting policies
Ordinary shares are classified as equity. When there is a capital increase through the issuance of new shares,
these shares are recorded at their nominal value.
The share premium reserve represents capital contributed by investors in excess of the nominal value of the
shares issued, net of any incremental costs directly attributable to the issuance of new shares.
Own equity instruments that are reacquired (treasury shares) are recognised at cost and deducted from
equity. No gain or loss is recognised in profit or loss on the purchase, sale, issue or cancellation of the
Group’s own equity instruments. Any difference between the carrying amount and the consideration
received, upon reissuance, is recognised in equity.
191
Note 23
Financial Risk Management
Financial risk factors
The Group’s activities expose it to market risk, including currency risk and interest rate risk, as well as credit
risk and liquidity risk.
The financial risk management of the Group is performed by the Management of Cadeler and overseen by
the Board of Directors and Audit Committee. The fair value of the Group's financial assets and liabilities as of
31 December 2025 does not deviate materially from the carrying amounts as of 31 December 2025.
Quantitative and qualitative disclosures about market risk
Currency risk
The Group’s business is exposed to the Danish Kroner (“DKK”), Norwegian Kroner (“NOK”), British Pound
Sterling (“GBP”), United States Dollar (“USD”), New Taiwan Dollar (“TWD”), and Japanese Yen (“JPY”), as
certain operating expenses are denominated in these currencies. The Company seeks to use financial
instruments to reduce currency risk when there is significant exposure to income or liabilities denominated
in currencies other than EUR or DKK, and where a cost-effective solution is available.
The functional currency of Cadeler A/S is EUR, while the largest currency exposure of the Group relates to
future instalments for newbuild vessels, denominated in USD, amounting to USD 496 million. Further details
regarding the instruments currently used to mitigate this currency risk are provided in Note 24. Management
and the Board of Directors evaluate the potential costs and benefits of currency exposure on an ongoing basis.
The Group holds cash balances in USD. If the USD:EUR exchange rate were to deteriorate by 10% the result
before tax would have decreased by EUR 1.6 million (2024: EUR 1.8 million; 2023: EUR 4.6 million), based on
USD cash holdings as of 31 December 2025.
The Group holds cash balances in GBP. If the GBP:EUR exchange rate were to deteriorate by 10% the result
before tax would have decreased by EUR 0.4 million (2024: EUR 0.7 million) based on GBP cash holdings as
of 31 December 2025.
As the DKK is pegged to the EUR, no material currency risk has been identified in relation to the DKK, despite the
Cadeler Group incurring costs denominated in DKK. As of 31 December 2025, the Cadeler Group did not hold any
material cash balances denominated in NOK, JPY, or TWD.
Currency risk associated with other financial instruments denominated in foriegn currencies is limited and
therefore excluded from this analysis.
Interest rate risk
The Group’s current exposure to the risk of changes in market interest rates relates primarily to the Green
Corporate Facility, the P-class Facility, M-class Facility and Holdco Facility. Further details regarding the
hedging instruments used to mitigate this risk are provided in Note 24.
The Green Corporate Facility and Holdco Facility are based on a EURIBOR 3M interest rate plus a margin.
The EURIBOR interest rate has a floor of 0bps and was 2.1%, 2.9% and 3.9% at the end of 2025, 2024 and
2023, respectively.
If the EURIBOR interest rate increased 100bps, and the loans had been provided throughout the entire 2025
reporting period, interest costs would have increased by EUR 15.6 million (2024: EUR 5.9 million; 2023: EUR
2.1 million). Such an increase could potentially qualify as capitalisable borrowing costs, thereby mitigating
the impact on the result before tax. Conversely, if the interest rates were to decrease, the result before tax
would not be materially affected due to the capitalisation of borrowing costs.
Management and the Board of Directors evaluate the potential costs and benefits of fixed interest rate
borrowings on an ongoing basis.
192
Note 23
Financial Risk Management
Continued from previous page
Credit risk
Risk management
Credit risk refers to the risk that a counterparty will default on its contractual obligations resulting in
financial loss to the Group. The Group adopts the following policies to mitigate credit risk.
For banks and financial institutions, the Group mitigates its credit risks by transacting only with
counterparties rated “A” or above by independent rating agencies.
The Group adopts a policy of dealing only with customers with an appropriate credit history and obtaining
sufficient security where appropriate, to mitigate credit risk. The Group applies stringent procedures for
extending credit terms to customers and for the ongoing monitoring of credit risk.
These credit terms are normally contractual, and credit policies clearly define the guidelines for extending
credit to customers, including monitoring processes and reference to relevant industry practices. This
includes the assessment and evaluation of customers’ creditworthiness and periodic reviews of their
financial status to determine the credit limits. Customers are also assessed based on their historical
payment behaviour. Where necessary, customers may be required to provide security or advance payments
before services are rendered.
Related party credit risk is managed by the Executive Management of Cadeler and overseen by the Board
of Directors.
The maximum exposure to credit risk is the carrying amount of trade receivables and other receivables,
receivables from group entities and cash and bank balances presented in the statement of financial
position.
Impairment of financial assets
The Group assesses on a forward-looking basis the expected credit losses (ECLs) associated with its
financial assets which include trade and other receivables, cash and bank balances and contract assets.
Financial assets are written off when there is no reasonable expectation of recovery, such as when a non-
related debtor fails to engage in a repayment plan with the Group.
Where receivables have been written off, the Group continues to pursue enforcement activities in an
attempt to recover amounts due. Where recoveries are made, these are recognised in profit or loss. As of
the reporting date, no receivables have been written off.
The Group has applied the simplified credit loss approach by using a provision matrix to measure the
lifetime expected credit losses for trade receivables from customers. To measure expected credit losses, the
Group groups receivables based on shared credit characteristics and days past due.
Trade receivables from external customers that are neither past due nor impaired are with creditworthy
counterparties. Based on the provision matrix, trade receivables from external customers are subject to
immaterial credit loss. For further analysis, refer to Note 16 for details on expected credit losses on trade
receivables and contract assets.
For cash and bank balances and other receivables measured at amortised cost, the Group considers these
financial assets to have low credit risk. Cash and bank balances mainly comprise deposits with banks that
have high credit ratings, as determined by international credit rating agencies. As of 31 December 2025,
cash and bank balances and other receivables are subject to immaterial credit loss. There is no credit loss
allowance for other financial assets measured at amortised cost as of 31 December 2025, 2024 and 2023.
193
Note 23
Financial Risk Management
Continued from previous page
Liquidity risk
The Group manages liquidity risk by maintaining sufficient cash and access to funding through committed
credit facilities to enabling it to meet its operational requirements and instalments payments for the
contracted newbuild vessels.
The management of the Cadeler Group anticipates seeking additional debt financing in connection with
milestone payments related to the delivery of the third A-class newbuild vessel. For further details, please
refer to Note 25, which provides a detailed disclosure of the Group’s existing credit facilities.
The following maturity table shows the contractual obligation relating to the construction of the newbuilds
vessels.
EUR Millions | Less than 1 year | Between 1 and 2 years | Between 2 and 5 years | Total |
2025 | ||||
Obligation in USD | 301 | 195 | — | 496 |
Obligation in USD (in EUR) | 256 | 166 | — | 422 |
Obligation in EUR | 40 | — | — | 40 |
Total obligations (in EUR) | 296 | 166 | — | 462 |
2024 | ||||
Obligation in USD | 651 | 496 | 195 | 1,342 |
Obligation in USD (in EUR) | 626 | 476 | 188 | 1,290 |
Obligation in EUR | 65 | 40 | — | 105 |
Total obligations (in EUR) | 691 | 516 | 188 | 1,395 |
2023 | ||||
Obligation in USD | 328 | 833 | 180 | 1,341 |
Obligation in USD (in EUR) | 296 | 752 | 163 | 1,211 |
Obligation in EUR | 69 | 99 | 6 | 174 |
Total obligations (in EUR) | 365 | 851 | 169 | 1,385 |
194
Note 23
Financial Risk Management
Continued from previous page
The table below analyses the maturity profile of the Company’s financial liabilities based on contractual-
undiscounted cash flows, excluding payments relating to newbuild vessels.
EUR'000 | Less than 1 year | Between 1 and 2 years | After 2 years | Total |
2025 | ||||
Trade and other payables | 98,208 | — | — | 98,208 |
Payables to related parties | 272 | — | — | 272 |
Lease liabilities | 1,851 | 2,819 | 8,868 | 13,538 |
Debt to credit institutions | 194,548 | 247,706 | 1,607,212 | 2,049,466 |
Derivatives | 3,062 | 1,884 | 8,770 | 13,716 |
297,941 | 252,409 | 1,624,850 | 2,175,200 | |
2024 | ||||
Trade and other payables | 43,595 | — | — | 43,595 |
Payables to related parties | 223 | — | — | 223 |
Lease liabilities | 1,274 | 2,337 | 7,360 | 10,971 |
Debt to credit institutions | 31,163 | 54,339 | 485,515 | 571,017 |
Derivatives | 209 | — | 16,205 | 16,414 |
76,464 | 56,676 | 509,080 | 642,220 | |
2023 | ||||
Trade and other payables | 32,636 | — | — | 32,636 |
Payables to related parties | 162 | — | — | 162 |
Lease liabilities | 601 | 392 | — | 993 |
Debt to credit institutions | 799 | — | 204,773 | 205,572 |
Derivatives | 4,004 | 5,683 | 12,274 | 21,961 |
38,202 | 6,075 | 217,047 | 261,324 |
Change in debts to credit institutions during the year
EUR'000 | 2025 | 2024 | 2023 |
Debt to credit institutions at 1 January | (571,017) | (205,572) | (115,002) |
Loans repayments | 279,281 | 10,630 | 115,000 |
Proceeds from borrowing | (1,337,178) | (385,234) | (211,934) |
New loan fees | 25,193 | 11,100 | 8,262 |
Non-cash movements | (7,033) | (1,941) | — |
Write-off of loan fees | — | — | (1,898) |
Debt to credit institutions at 31 December 2025 | (1,610,754) | (571,017) | (205,572) |
Total Proceeds from borrowing, net of bank fees, in 2025 as per Consolidated Statement of Cash Flows
amounted to EUR 1,309 million, excluding EUR 2.8 of loan fees that have been included in Prepayments.
195
Note 23
Financial Risk Management
Continued from previous page
Capital management
The Company’s objectives when managing capital are to ensure the
Company’s ability to continue as a going concern and to maintain an
optimal capital structure.
In order to achieve this overall objective, the Company’s capital
management aims, among other things, to ensure compliance wth
the financial covenants attached to the interest-bearing loans and
borrowings that define capital structure requirements. A breach of
the financial covenants would permit the bank to immediately call
loans and borrowings. There have been no breaches of the financial
covenants of any interest-bearing loans and borrowing in the current
period.
In order to maintain or adjust the capital structure in the future, the
Group may adjust dividend payments to shareholders, issue new
shares and/or dispose of assets to reduce debt. Pursuant to the
Green Corporate Facility, the Company is not permitted to pay any
dividends or other distributions without the prior written consent of
DNB Bank ASA.
Fair value measurement
The Group measures derivatives at fair value at each balance sheet
date. Fair value is the price that would be received to sell an asset or
paid to transfer a liability in an orderly transaction between market
participants at the balance sheet date.
The principal, or in its absence the most advantageous market must
be accessible by the Group. The fair value of an asset or liability is
measured using the assumptions that market participants would use
when pricing the asset or liability, assuming that market participants
act in their own economic best interest.
In measuring the fair value of unlisted derivative financial instruments
and other financial instruments for which there is no active market,
fair value is determined using generally accepted valuation
techniques. Market-based parameters such as market-based yield
curves and forward exchange rate are used for the valuation.
The Group uses valuation techniques that are appropriate in the
circumstances and for which sufficient data is available to measure
fair value, maximising the use of relevant observable inputs and
minimising the use of unobservable inputs.
Financial instruments for which fair value is measured or disclosed in
the financial statements are categorised within the fair value
hierarchy, as described below:
Level 1: The fair value of financial instruments traded in active markets
(such as publicly traded derivatives, and equity securities) is based on
quoted market prices at the end of the reporting period. The quoted
market price used for financial assets held by the Group is the current
bid price. These instruments are included in level 1.
Level 2: The fair value of financial instruments that are not traded in
an active market (e.g. over-the counter derivatives) is determined
using valuation techniques that maximise the use of observable
market data and rely as little as possible on entity-specific estimates.
The valuation techniques applied are primarily based on marked-
based inputs of the instruments. If all significant inputs required to
measure the fair value of an instrument are observable, the
instrument is included in Level 2.
Level 3: If one or more of the significant inputs is not observable
market data, the instrument is included in Level 3.
The table below shows the fair value measurement of the Group’s
assets and liabilities:
196
Note 23
Financial Risk Management
Continued from previous page
EUR'000 | 2025 | 2024 | 2023 |
Derivative assets measured at fair value | |||
Interest from IRS recycled through OCI | — | 228 | — |
Interest rate swaps | 2,171 | 1,287 | 338 |
FX forward contracts | 511 | 6,849 | — |
FX option collars | — | 4,764 | — |
Time value of FX option collars through OCI | — | 5,340 | — |
Total derivative assets | 2,682 | 18,468 | 338 |
Derivative liabilities measured at fair value | |||
Interest rate swap | 10,499 | 16,231 | 11,789 |
FX forward contracts | — | — | 5,338 |
Interest recycled through OCI | 525 | — | 810 |
Time value of FX option collars through OCI | 576 | 209 | 3,621 |
Derivatives ineffective hedges | 2,116 | (26) | 403 |
Total derivative liabilities | 13,716 | 16,414 | 21,961 |
As of 31 December 2025, the fair value of the derivative assets amounted to EUR 2,682 thousand (2024: EUR
18,468 thousand; 2023: EUR 338 thousand) and derivative liabilities amounted to 13,716 thousand (2024: EUR
16,414 thousand; 2023: EUR 21,961 thousand). The variation primarily reflects the execution of certain
financial instruments, together with changes in interest rate expectations in 2025 compared to 2024. These
expectations were driven by more persistent inflation and continued economic resilience, resulting in higher
interest rates and a stronger USD.
As of 31 December 2025, derivatives measured at fair value through profit or loss amounted to a gain of
EUR 2,116 thousand gain (2024: EUR 26 thousand loss; 2023: EUR 403 thousand gain).
The fair value hierarchy for the above derivative financial instruments is Level 2.
197
Note 24
Derivative Financial Instruments
Hedge accounting
The Group uses forward exchange contracts, including options (collars), and interest rate swap contracts to
hedge currency and interest rate risks related to highly probable future cash flows, and designates these
instruments as cash flow hedges, subject to meeting the criteria for the application of cash flow hedge
accounting.
The hedging ratios are determined as the notional value of the hedging instrument divided by the notional
value of the hedged item. The Group seeks to establish hedge relationships with a hedging ratio of 1:1. Due
to the nature of the hedged item’s risk, this is achieved by either designating a proportion of the hedging
instrument or by insuring that the hedge notional value is equal to or lower than the notional value of the
hedged item. The primary source of hedge ineffectiveness arises from the timing of vessel deliveries. The
delivery of the vessel exposes the Group to multiple market risks, primarily foreign currency risks and
interest rate risk. The fair value changes of the hedging instruments are recognised in other comprehensive
income until the hedged items are recognised or realised.
The table below shows the movement in the reserve for cash flow for hedging, listed by the hedged risk.
EUR'000 | 2025 | 2024 | 2023 |
Fair Value change of Cash flow hedges | |||
Cumulative fair value change at 1 January | 1,799 | (21,559) | 1,343 |
Fair value adjustment at year-end, net | (5,003) | 13,079 | (18,505) |
Items recycled at year-end, net | (2,582) | 1,527 | (776) |
Transfer of cash flow hedge reserve to property, plant and equipment | 2,536 | — | — |
Time value adjustment at year-end, net | (5,708) | 8,752 | (3,621) |
Cumulative fair value change at 31 December | (8,958) | 1,799 | (21,559) |
The fair value of cash flow hedges at 31 December can be specified as follows: | |||
Interest rate risk hedging | (9,839) | (14,945) | (11,790) |
Foreign currency risk hedging | 1,457 | 11,612 | (6,148) |
Foreign currency risk hedging - time value | (576) | 5,132 | (3,621) |
Cumulative fair value change at 31 December | (8,958) | 1,799 | (21,559) |
198
Note 24
Derivative Financial Instruments
Continued from previous page
Interest rate risk
The Group entered interest rate swap contracts with its main bank and designated these in relation to the
Green Corporate Facility, P-class Facility and future loans to finance the purchase of the newbuild vessels.
Further details regarding the Group’s current debt facilities related to interest rate swaps are provided in
Note 25.
The interest rate risk arising from the loans has been partially hedged by swapping exposure from 3M
EURIBOR to a fixed interest rate. The credit facilities continue to expose the Group to changes in the 3M
EURIBOR rate.
The average fixed rate of the swaps is 2.83% (2024: 2.78%; 2023: 2.81%).
A further portion of the exposure has been hedged through interest rate swap contracts with caps and
floors. The average fixed rate of the cap/floor swaps falls between 2.1% and 1.1%.
The economic relationship is established through a match of critical terms between the hedged item and
the hedging instrument. The Group has assessed the following terms when entering into the hedge
relationship:
◦Instalments on the facilities.
◦Payment date of interest and instalment.
◦Timing difference in the maturity of the hedge item and hedge instrument.
The expected causes of hedge ineffectiveness relate to:
◦Changes to the expected date of delivery of the vessels.
◦3M EURIBOR rate falling below 0%.
The table below shows the nominal amounts and the fair values of the interest rate swaps.
Fair Value EUR'000 | ||||||
Notional amount EUR'000 | Less than 1 year | Between 1 and 2 years | Between 2 and 5 years | More than 5 years | Asset | Liability |
2025 | ||||||
IRS – EURIBOR 3M | — | 150,000 | 576,703 | 141,875 | 2,172 | (10,499) |
2024 | ||||||
IRS – EURIBOR 3M | — | — | 355,117 | 455,625 | 1,286 | (16,231) |
2023 | ||||||
IRS – EURIBOR 3M | — | — | 555,000 | — | — | (11,790) |
EUR'000 | 2025 | 2024 | 2023 | |||
Movements in the hedging reserve | ||||||
Beginning of year | (14,945) | (11,790) | 3,163 | |||
Fair value adjustment for the year | 5,864 | (3,265) | (14,177) | |||
Ineffectiveness | (1,511) | — | — | |||
Items recycled for the year | 753 | 110 | (776) | |||
End of year | (9,839) | (14,945) | (11,790) | |||
199
Note 24
Derivative Financial Instruments
Continued from previous page
Foreign currency risk hedging
As a result of the contracts signed with COSCO and Hanwha for the construction of the newbuild vessels,
the Group is exposed to foreign exchange risk, as instalment payments are denominated in USD, while the
functional currency is EUR. The final instalments are payable upon delivery of the vessels.
The currency exposure arising from these contracts has been swapped into EUR at an average USD:EUR rate
of 0.8586 (0.9107 for 2024 and 0.9187 for 2023).
A further portion of the exposure to fluctuations in future exchange rates has been hedged through zero-
cost collar contracts, securing an average USD:EUR rate ranging between 0.8607 and 0.9092. As of
31 December 2025, the total coverage effectively mitigates approximately 42% on average of the Group’s
foreign exchange risk related to future USD denominated instalments under the A-class vessel contracts.
The economic relationship is established through a match of critical terms between the hedge item and
hedge instrument. The Group has assessed the following terms when entering into the hedge relationship:
◦Payment dates of instalments in foreign currency.
◦Maturity of the hedged item and hedged instruments (forward contract and option
collars).
The expected causes of hedging ineffectiveness primarily relate to changes in the expected delivery dates of
the vessel. The table below presents the nominal amounts and fair values of the foreign currency forward
contracts and option collars.
Fair Value EUR'000 | |||||
Notational amount USD'000 | Less than 1 year | Between 1 and 2 years | Between 2 and 5 years | Asset | Liability |
2025 | |||||
FX forward contracts | 162,295 | 48,800 | — | 511 | — |
Option collars | 159,875 | 48,800 | — | — | (576) |
2024 | |||||
FX forward contracts | 104,545 | 55,398 | — | 6,849 | — |
Option collars | 300,000 | 100,000 | — | 10,104 | (209) |
2023 | |||||
FX forward contracts | 150,000 | 50,000 | — | — | (5,338) |
Option collars | — | 250,000 | 50,000 | — | (4,431) |
EUR'000 | 2025 | 2024 | 2023 | ||
Movements in the hedging reserve | |||||
Beginning of year | 16,744 | (9,769) | (1,820) | ||
Fair value adjustment for the year - FX forward contracts | (6,103) | 10,771 | (3,518) | ||
Fair value adjustment for the year - Option collars | (4,764) | 5,573 | (810) | ||
Transfer of cash flow hedge reserve to property, plant and equipment | 2,536 | — | — | ||
Items recycled for the year | (1,824) | 1,417 | — | ||
Time value adjustment for the year | (5,708) | 8,752 | (3,621) | ||
End of year | 881 | 16,744 | (9,769) | ||
200
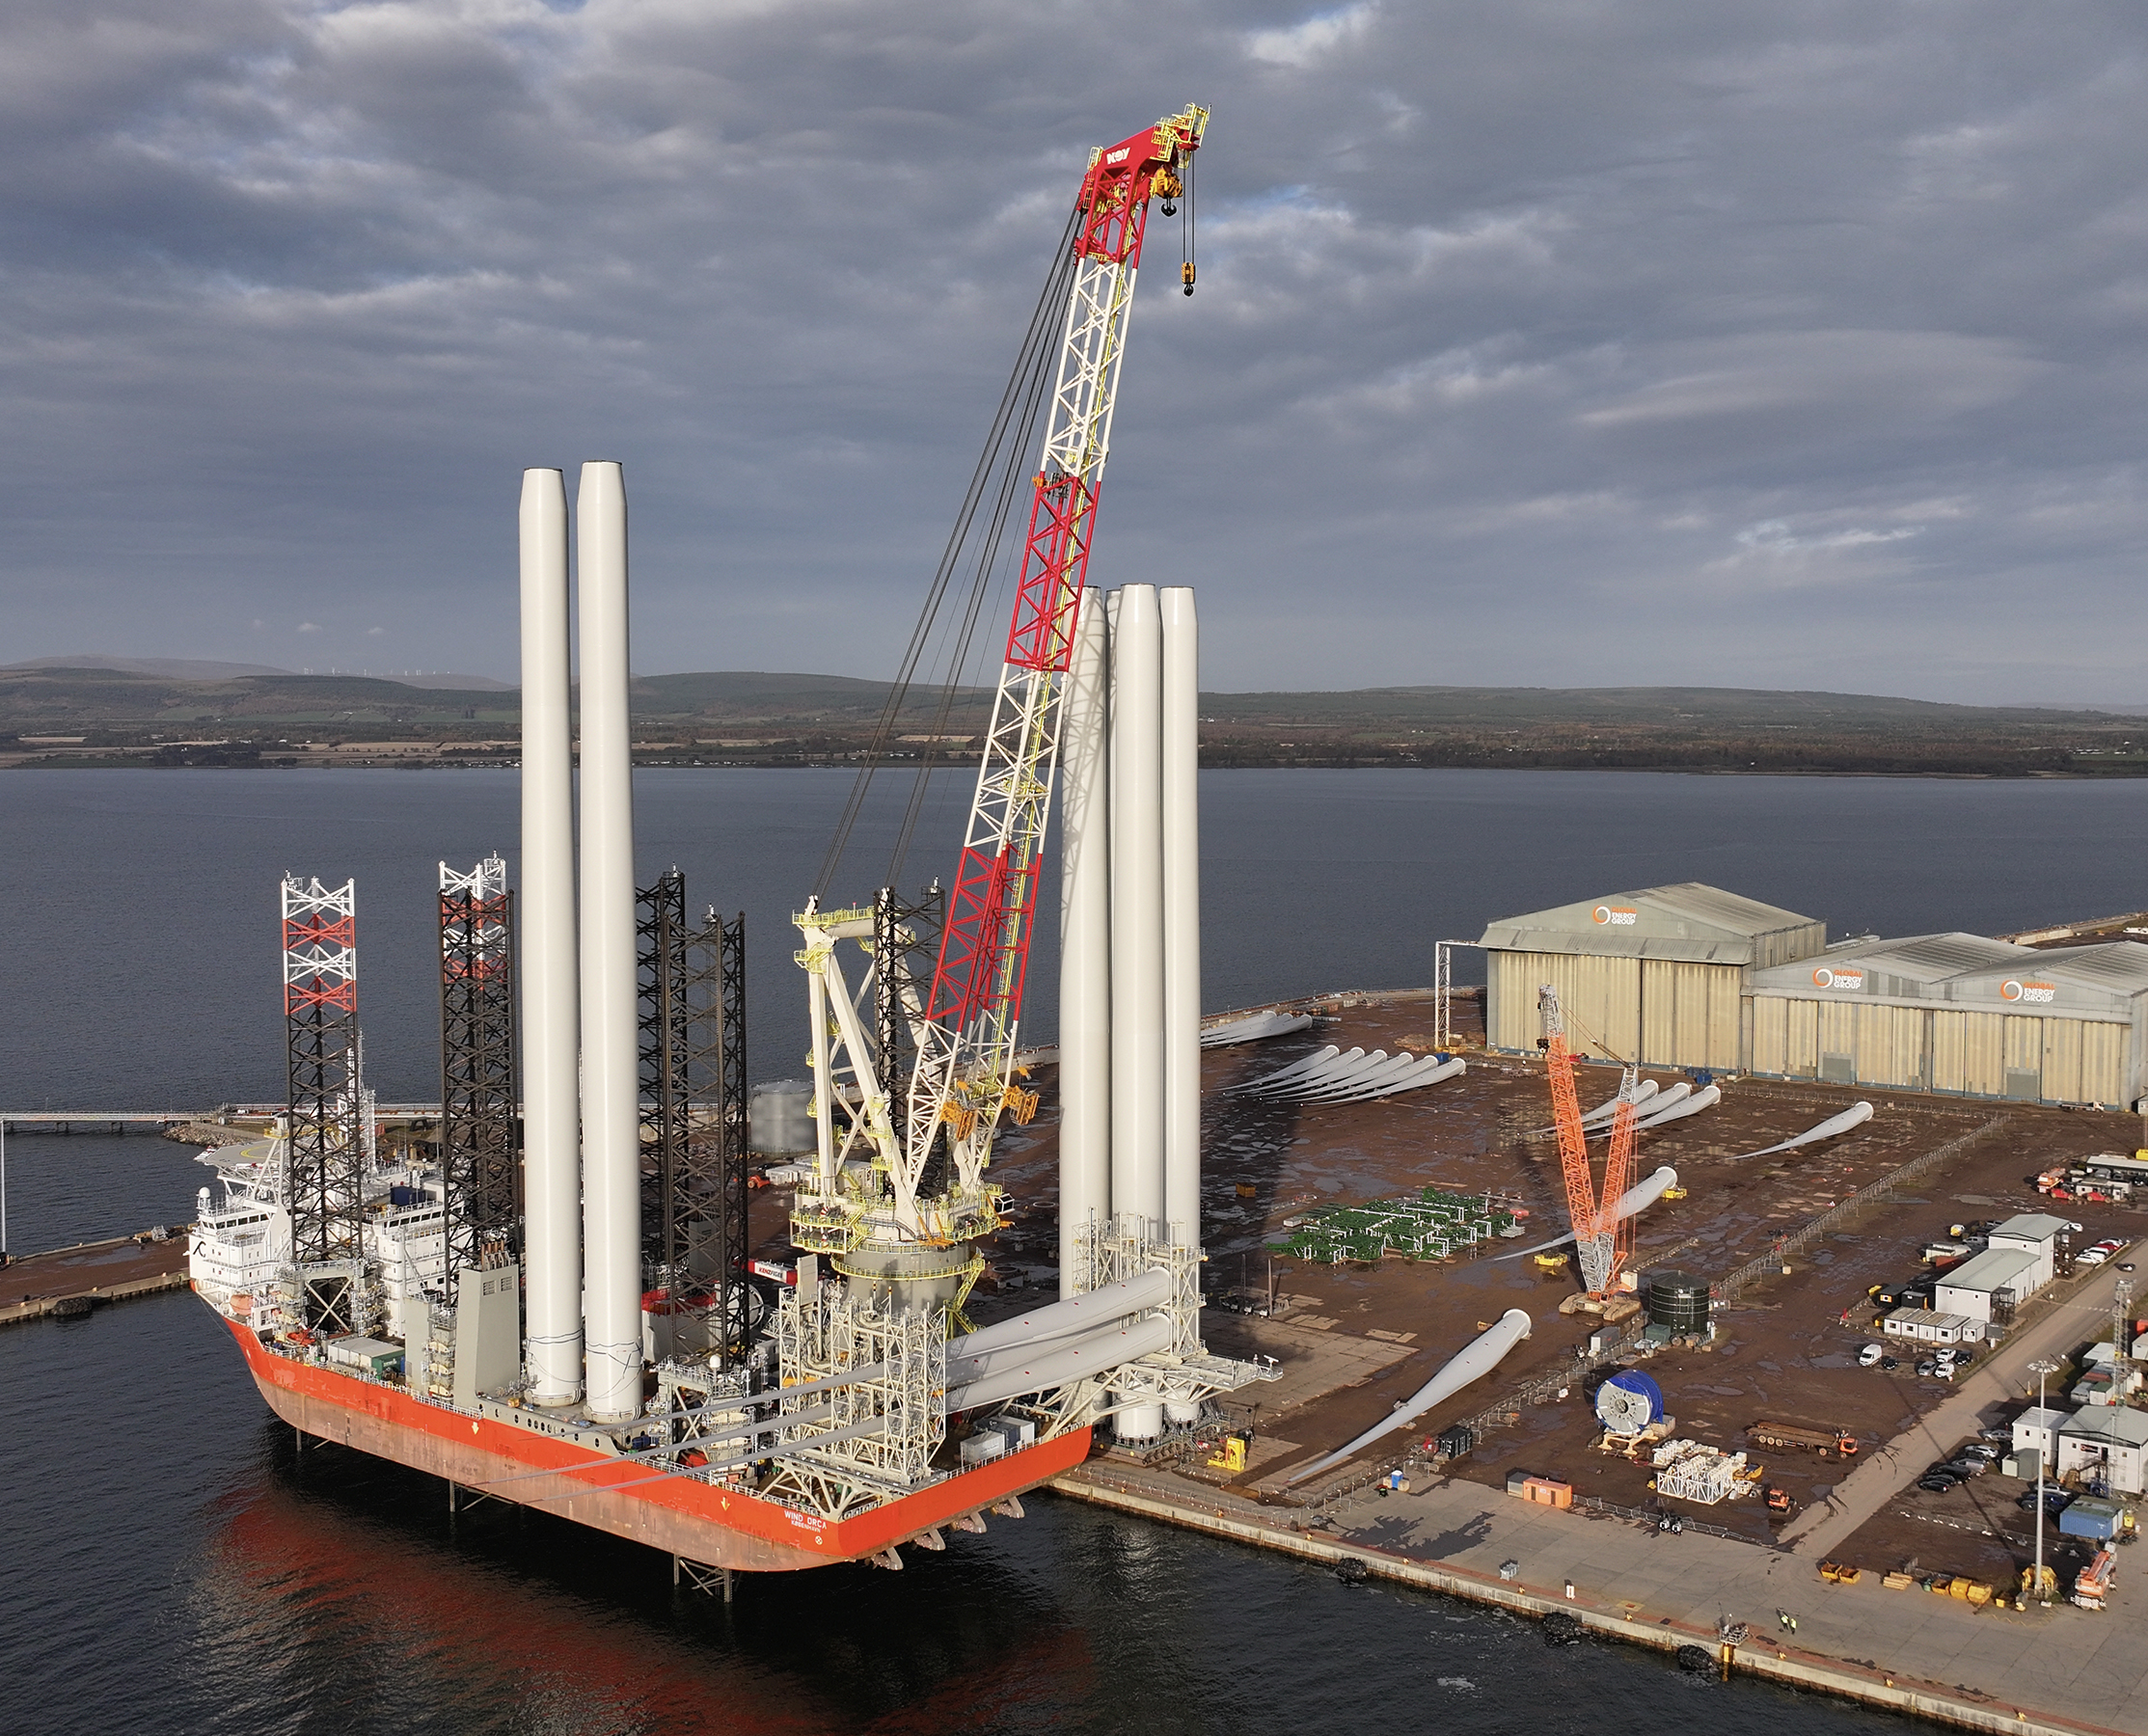
Note 24
Derivative Financial Instruments
Continued from previous page
Accounting policies
Derivative financial instruments are initially recognised at fair value on the date the derivative contract is
entered into and are subsequently remeasured at fair value through profit and loss. Derivatives are carried
as financial assets, presented as derivative assets, when the fair value is positive and as financial liabilities,
presented as derivative liabilities, when the fair value is negative.
At the inception of a hedge relationship, the Group formally designates and documents the hedge
relationship, including the risk management objective and strategy for undertaking the hedge.
Changes in the fair value of derivative financial instruments designated as cash flow hedges are recognised
in other comprehensive income and presented under “Hedging reserves” (equity). Where the expected
future transactions result in the acquisition of non-financial assets, amounts deferred in equity are
transferred from equity and included in the cost of the asset. Where expected future transactions result in
income or expenses, amounts deferred under in equity are transferred from equity to the statement of
profit and loss, in the same item as the hedged transaction, as a reclassification adjustment. In addition, the
entity may transfer the cumulative fair value changes recognised in equity upon derecognition of the
hedged item.
Changes in the fair value of derivative financial instruments not designated as hedges are recognised in the
statement of profit and loss. Certain borrowing facilities when undrawn do not qualify for hedge
accounting. Changes in the fair value of these derivative financial instruments are therefore recognised in
the statement of profit and loss under “Financial income” or “Financial expenses” for interest rate swaps.
The amount included in the hedging reserve is the lower, in absolute terms, of the cumulative fair value
adjustment of the hedging instrument and the hedged item. Hedge ineffectiveness is recognised in the
consolidated statement of profit and loss. Cost of hedging reserves include the time value of options.
These costs are recognised separately in Other Comprehensive Income (OCI) and are amortised over the
life of the hedging instrument, in accordance with the specific hedging relationship. If the hedge is
discontinued, any unamortised cost of hedging is recognised immediately in profit or loss.
201
Note 25
Financial Liabilities: Interest-bearing Loans and Borrowings
As of 31 December 2025 | Committed (EUR millions) | Related derivatives contracts | ||||||
EUR Millions | Interest rate | Maturity | Covenants | Utilised | Accumulated repayments | Unutilised | Average IRS rate | IRS nominal (EUR millions) |
Secured | ||||||||
Green Corporate Facility (RCF + term loan) | 3 months EURIBOR + 2% - 2.75% | 2032 | Yes - refer to page 203 | 283 | (87) | 148 | 2.7% | 247 |
Green Corporate Facility - Guarantee | 0.8% - 1.2% | 2026 | Yes - refer to page 203 | 157 | — | 43 | ||
Total Green Corporate Facility | 440 | (87) | 191 | |||||
P-Class Facility¹ | 3 months EURIBOR + 1.6% | 2037 | Yes - refer to page 203 | 421 | (35) | — | 3.0% | 105.1 |
A-Class Facility I & II | 3 months EURIBOR + 1.6% | 2037 | Yes - refer to page 203 | 262 | (5) | 263 | ||
Wind Keeper Facility | 3 months EURIBOR + 2.1% | 2030 | Yes - refer to page 203 | 125 | — | — | ||
M-Class Facility I & II | 3 months EURIBOR + 2.5% | 2037 | Yes - refer to page 203 | 420 | (13) | — | ||
Unsecured | ||||||||
HoldCo Facility | 3 months EURIBOR + 4% | 2028 | Yes - refer to page 203 | 125 | — | — | ||
HoldCo Facility II | 3 months EURIBOR + 4% | 2030 | Yes - refer to page 203 | 60 | — | — | ||
Unsecured guarantee facility | Yes - refer to page 203 | 96 | — | 7 | ||||
Total (excluding Guarantee facility) | 1,696² | (140) | 411 | |||||
1 For the P-class Facility, up to EUR 425 million, EUR 214million was available for Wind Peak of which EUR 421 million has been utilised and the remaining EUR 4 million lapsed. 2 The difference between EUR 1,696 million and the carrying amount of EUR 1,611 million is mainly related to interest and fees. |
202
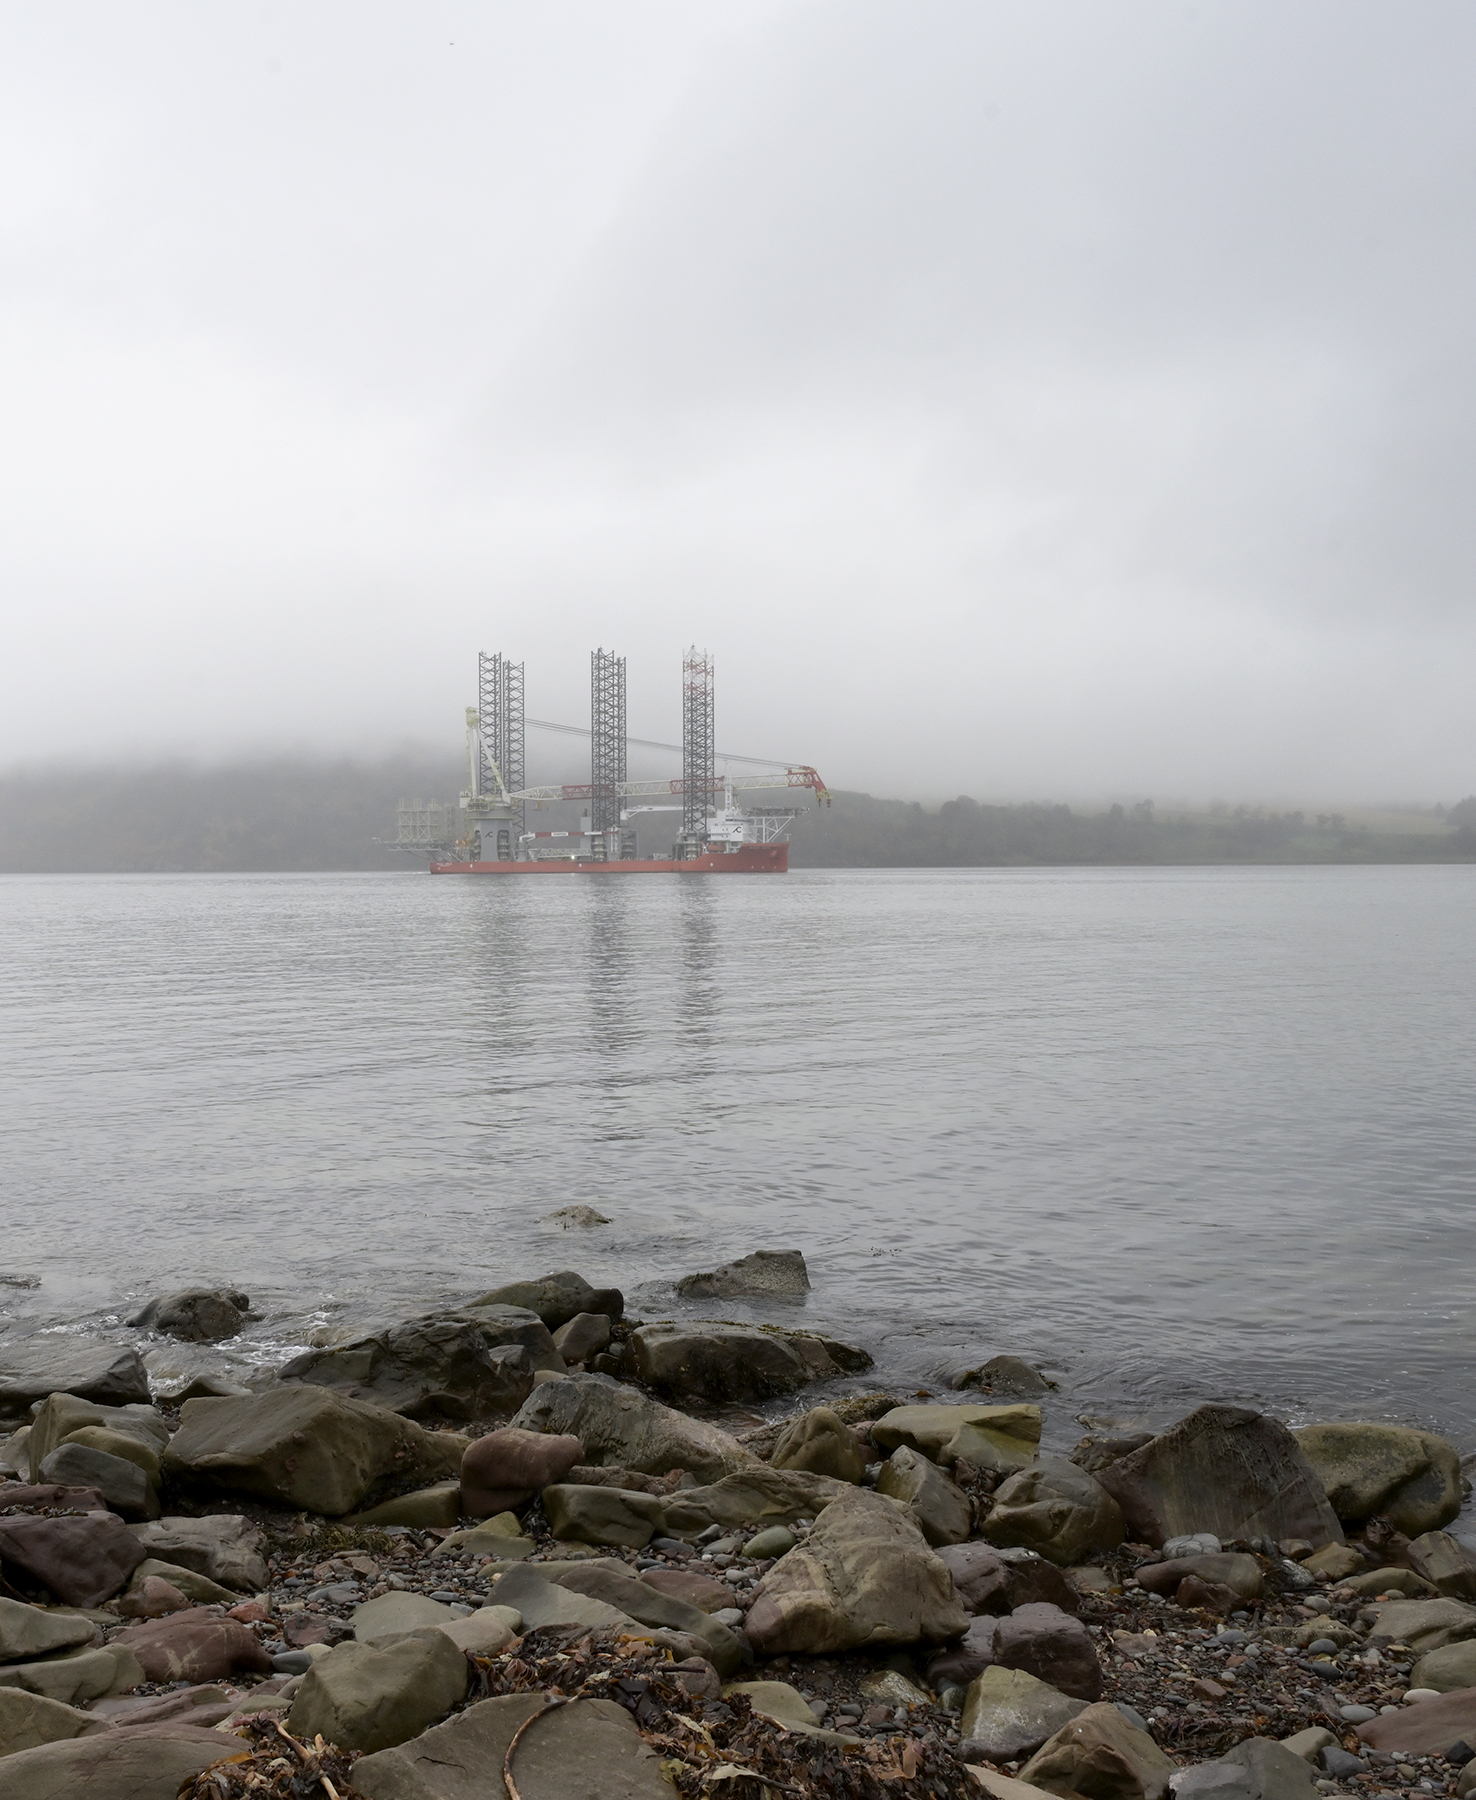
Note 25
Financial Liabilities: Interest-bearing Loans and Borrowings
Continued from previous page
Company Financing
Green Corporate Facility (formerly referred to as “New
debt Facility”)
In December 2023, Cadeler announced the signing of a EUR
550 million Senior Secured Green Facilities, the “Green Corporate
Facility”, with a group of banks led by DNB and supported by
Rabobank, Credit Agricole, Danske Bank, Oversea-Chinese Banking
Corporation (“OCBC”), Standard Chartered Bank and Société
Générale.
The main objective of the Green Corporate Facility is to refinance
and fund upgrades to existing vessels, as well as to provide funding
for general corporate and working capital purposes.
The Green Corporate Facility comprises two RCFs amounting to EUR
350 million, a EUR 100 million term loan guaranteed by The Danish
Export and Investment Fund of Denmark (EIFO) and a EUR
200 million uncommitted Guarantee facility.
Holdco Facility
In November 2023, Cadeler entered into a bilateral unsecured
Green Loan Facility with HSBC of EUR 80 million, which was upsized
to EUR 125 million during 2024. The main purpose of the facility has
been to pre-finance the construction of the P-class and A-class
newbuild vessels in addition to the upgrade of the existing O-class
vessels.
In November 2025, Cadeler entered into a second unsecured Green
Loan Facility with HSBC and Clifford Capital of EUR 60 million with a
non-committed accordion option of up to EUR 80 million.
As of 31 December 2025, both unsecured facilities are fully utilised.
Project Financing
P-class Facility
In December 2023, Cadeler announced the signing of a Sinosure-
backed Senior Secured Green Term Loan Facility of up to
EUR425 million. The purpose of the P-class Facility is to finance
Cadeler’s two newbuild vessels, Wind Peak and Wind Pace, which
were delivered on August 2024 and March 2025, respectively.
M-class Facility I & II
In August 2024, Cadeler successfully refinanced the USD 436 million
Senior Secured Green Term Loan Facility (M-class Facility) to two
individual M-class facilities (M-class Facility I and M-class Facility II).
Both facilities are backed by Danmarks Eksport og Investeringsfond
(EIFO) and Export Finance Norway (Eksfin), and provide an
aggregate of up to EUR420 million in post-delivery financing. The
two newbuild vessels, Wind Maker and Wind Mover, were delivered
on January 2025 and November 2025, respectively.
A-class Facility
In March 2025, Cadeler entered into a EUR 525m Green Term Loan
Pre-Delivery and Post-Delivery Facility secured by Sinosure and
Eksfin. The purpose of the facility is to finance Cadeler’s two
newbuild vessels, Wind Ally and Wind Ace. Wind Ally has been
successful delivered ahead of schedule in September 2025 and
Wind Ace is expected to be delivered in Q1 2026.
Keeper Facility
In May 2025, Cadeler entered into a bridge facility of up to EUR
150 million for the acquisition of Wind Keeper. This facility was
subsequently refinanced by a EUR 125 million Green Term Loan,
which was fully drawn in October 2025.
203
Note 25
Financial Liabilities: Interest-bearing Loans and Borrowings
Continued from previous page
Covenants
The Group debt facilities include the following covenants:
All debt facilities
•Minimum Free Liquidity: Freely available cash and cash
equivalents of i) the higher of EUR 35 million or 5% of gross
interest-bearing debt, where the ratio of forward-looking
contract cash flow to net interest-bearing debt exceeds 50%
or ii) EUR 50 million or an amount equal to 7.5% of gross
interest-bearing debt at all other times.
•Equity Ratio: The ratio of book equity to total assets must at
all times be a minimum 35%.
•Working capital: The working capital shall be higher than
zero (0).
•Minimum security value (loan-to-value for individual debt
facilities).
Additional items included in Green Corporate Facility
•If, in any reported quarter, the aggregated loan balance
exceeds 80% of the forward-looking expected cash
revenues from legally binding contracts (the Contracted
Cash Flows), the Borrower shall prepay the excess amount
of the loans within five business days.
Additional items included in Holdco Facility
•The Group is subject to a debt service coverage ratio where
cash flow available for debt service (including available
liquidity comprising cash, cash equivalents and undrawn
Green Corporate Facility) at the Parent Company must be at
leaast two times the debt service cash flow relating to the
Holdco Facility (2:1).
Additional items included in M-Class Facility I & II
•The Group is required to maintain a specified number of
employees in Denmark.
All covenants are tested semi-annually, at 30 June and 31 December.
The Group is in compliance with all covenants.
As of the reporting date, M-class Facilities I and II remain unutilised.
Due to the non-utilisation of these facilities, no assessment of
compliance with associated covenants has been required to date.
These covenants, once applicable, will require assessment upon
utilisation of the facilities and include customary financial and other
covenants, including certain change of control provisions, similar to
those disclosed for the utilised facilities.
In addition, the Group is in compliance with the following
requirements:
Restriction on dividends: The Company is not permitted to pay any
dividends or other distributions without lender’s written consent.
Across the Group’s Debt Facilities, dividends and distributions must
not exceed 50% of the consolidated net profit for the respective year
and the net interest bearing debt to EBITDA ratio should not be lower
than 2.75:1. Furthermore, under the Holdco Facility, the Company is
not permitted to make any distributions prior to the delivery of the P-
Class, the first two A-Class and M-Class vessels.
Change of control: If any person or group of persons (other than
Swire Pacific, Scorpio Group or the BW Group) acting in concert
directly or indirectly gains control of 25% or more of the voting and/
or ordinary shares of the Borrower, the Agent (acting on the
instructions of the majority lenders) may, by written notice of 60 days
cancel the total commitments and demand prepayment of all
amounts outstanding under the facilities.
204
Note 25
Financial Liabilities: Interest-
bearing Loans and Borrowings
Continued from previous page
Accounting policies
Debt to credit institutions etc. is recognised at the time of borrowing
at fair value after deduction of directly attributable transaction costs.
Subsequently, the financial liabilities are measured at amortised cost
using the "effective interest method", whereby the difference
between the proceeds and the nominal value is recognised in the
statement of profit and loss under financial expenses over the loan
period.
A financial liability is derecognised when the obligation under the
liability is discharged, cancelled or expires.
When an existing financial liability is replaced by another from the
same lender on substantially different terms, or when the terms of an
existing liability are substantially modified, such an exchange or
modification is treated as the derecognition of the original liability
and the recognition of a new liability.
The difference in the respective carrying amounts of the original and
the new financial liability is recognised in the statement of profit and
loss.
Note 26
Business Combination
On 19 December 2023, the Group completed the acquisition of Eneti.
The fair value of the identified net assets acquired and goodwill
recognised in the Eneti acquisition comprises as follows:
EUR'000 | 19 December 2023 |
Vessels including dry docks | 296,707 |
Vessel under construction | 144,219 |
Other fixtures & fittings | 598 |
Right-of-use assets | 1,033 |
Trade and other receivables | 29,408 |
Inventories | 147 |
Prepayments | 3,821 |
Cash and cash equivalents | 106,056 |
Total assets | 581,989 |
EUR'000 | 19 December 2023 |
Provisions | 6,987 |
Deferred tax liabilities | 10,315 |
Trade and other payables | 40,271 |
Lease liabilities | 1,300 |
Deferred charter hire income | 1,937 |
Current income tax liabilities | 1,217 |
Total liabilities | 62,027 |
Total identifiable net assets at fair value | 519,962 |
Goodwill arising on acquisition | 16,919 |
Purchase price transferred | 536,881 |
Cash and cash equivalents acquired | 106,056 |
Consideration paid in shares | 441,228 |
Net cash purchase price | (10,403) |
205
Note 27
Related Party Transactions
The following significant transactions took place between the Company and related parties within the BW
Group, Scorpio Holdings and Swire Pacific Offshore Holdings Group at terms agreed between the parties:
EUR'000 | 2025 | 2024 | 2023 |
Purchases of services from related parties | (5,732) | (8,260) | (9,216) |
BW Group Limited (including subsidiaries) | (5,455) | (7,121) | (9,199) |
Scorpio Holdings Limited (including subsidiaries) | (277) | (1,139) | (17) |
Receivables from related parties at reported period | — | 214 | 592 |
Scorpio Holdings Limited (including subsidiaries) | — | 214 | 592 |
Payables to related parties at reported period | 382 | 223 | 162 |
BW Group Limited (including subsidiaries) | 306 | 181 | 10 |
Scorpio Holdings Limited (including subsidiaries) | 76 | 42 | 152 |
Related party transactions during the reporting period are primarily related to guarantee fees charged by
BW Group Limited, bunker supply provided by Hafnia Pools (a member of the BW Group), training-related
costs charged by BW Maritime, and administrative expenses charged by Scorpio Services Holding.
As at 31 December 2025, approximately EUR 3 million recognised within prepayments relates to legal and
advisory costs incurred by the Company on behalf of a special purpose vehicle incorporated by BW Altor
Pte. Ltd. in connection with the Cadeler Group’s proposed re-domiciliation to the United Kingdom, as first
disclosed on 28 June 2024. It is anticipated that these costs will be reimbursed by the special purposes
vehicle (which is today a related party) immediately following the contemplated transaction, which the
Company expects to complete in 2026.
In addition, Cadeler has not entered into any significant transactions with members of the Cadeler Board of
Directors or Executive Management, other than remuneration and reimbursement of expenses. Cadeler has
not provided or granted any loans or guarantees to its directors or Executive Management. For information
on remuneration paid to members of the Cadeler Board and Executive Management, refer to Note 8.
Group’s Related Party Transactions
Members of Cadeler’s Executive Management and its Board of Directors, as well as their respective close
family members and entities controlled by them or over which they exercise significant influence are
considered related parties of Cadeler. BW Altor Pte. Ltd. (“BW Altor”) and Scorpio Holdings Limited (“Scorpio
Holdings”), together with certain of their respective affiliates are considered related parties as they are
deemed to be controlled by, or under the significant influence of, Andreas Sohmen-Pao and Emanuele
Lauro (each a member of Cadeler’s Board of Directors), respectively. For the financial year 2022, Swire
Pacific Limited (“Swire Pacific”) was considered a related party of Cadeler due to its significant ownership
stake and the fact that one of its employees served as a director on the Cadeler Board of Directors.
However, with effect from 1 January 2023, Cadeler ceased to consider Swire Pacific to be a related party due
to its reduced ownership percentage and the fact that it was no longer represented on Cadeler’s Board of
Directors.
For the financial years ended 31 December 2025, 2024 and 2023, there were no material transactions
between Cadeler or any entity within the Cadeler Group and BW Altor, Scorpio Holdings and/or Swire
Pacific (or their respective affiliates) other than the transactions described below.
206
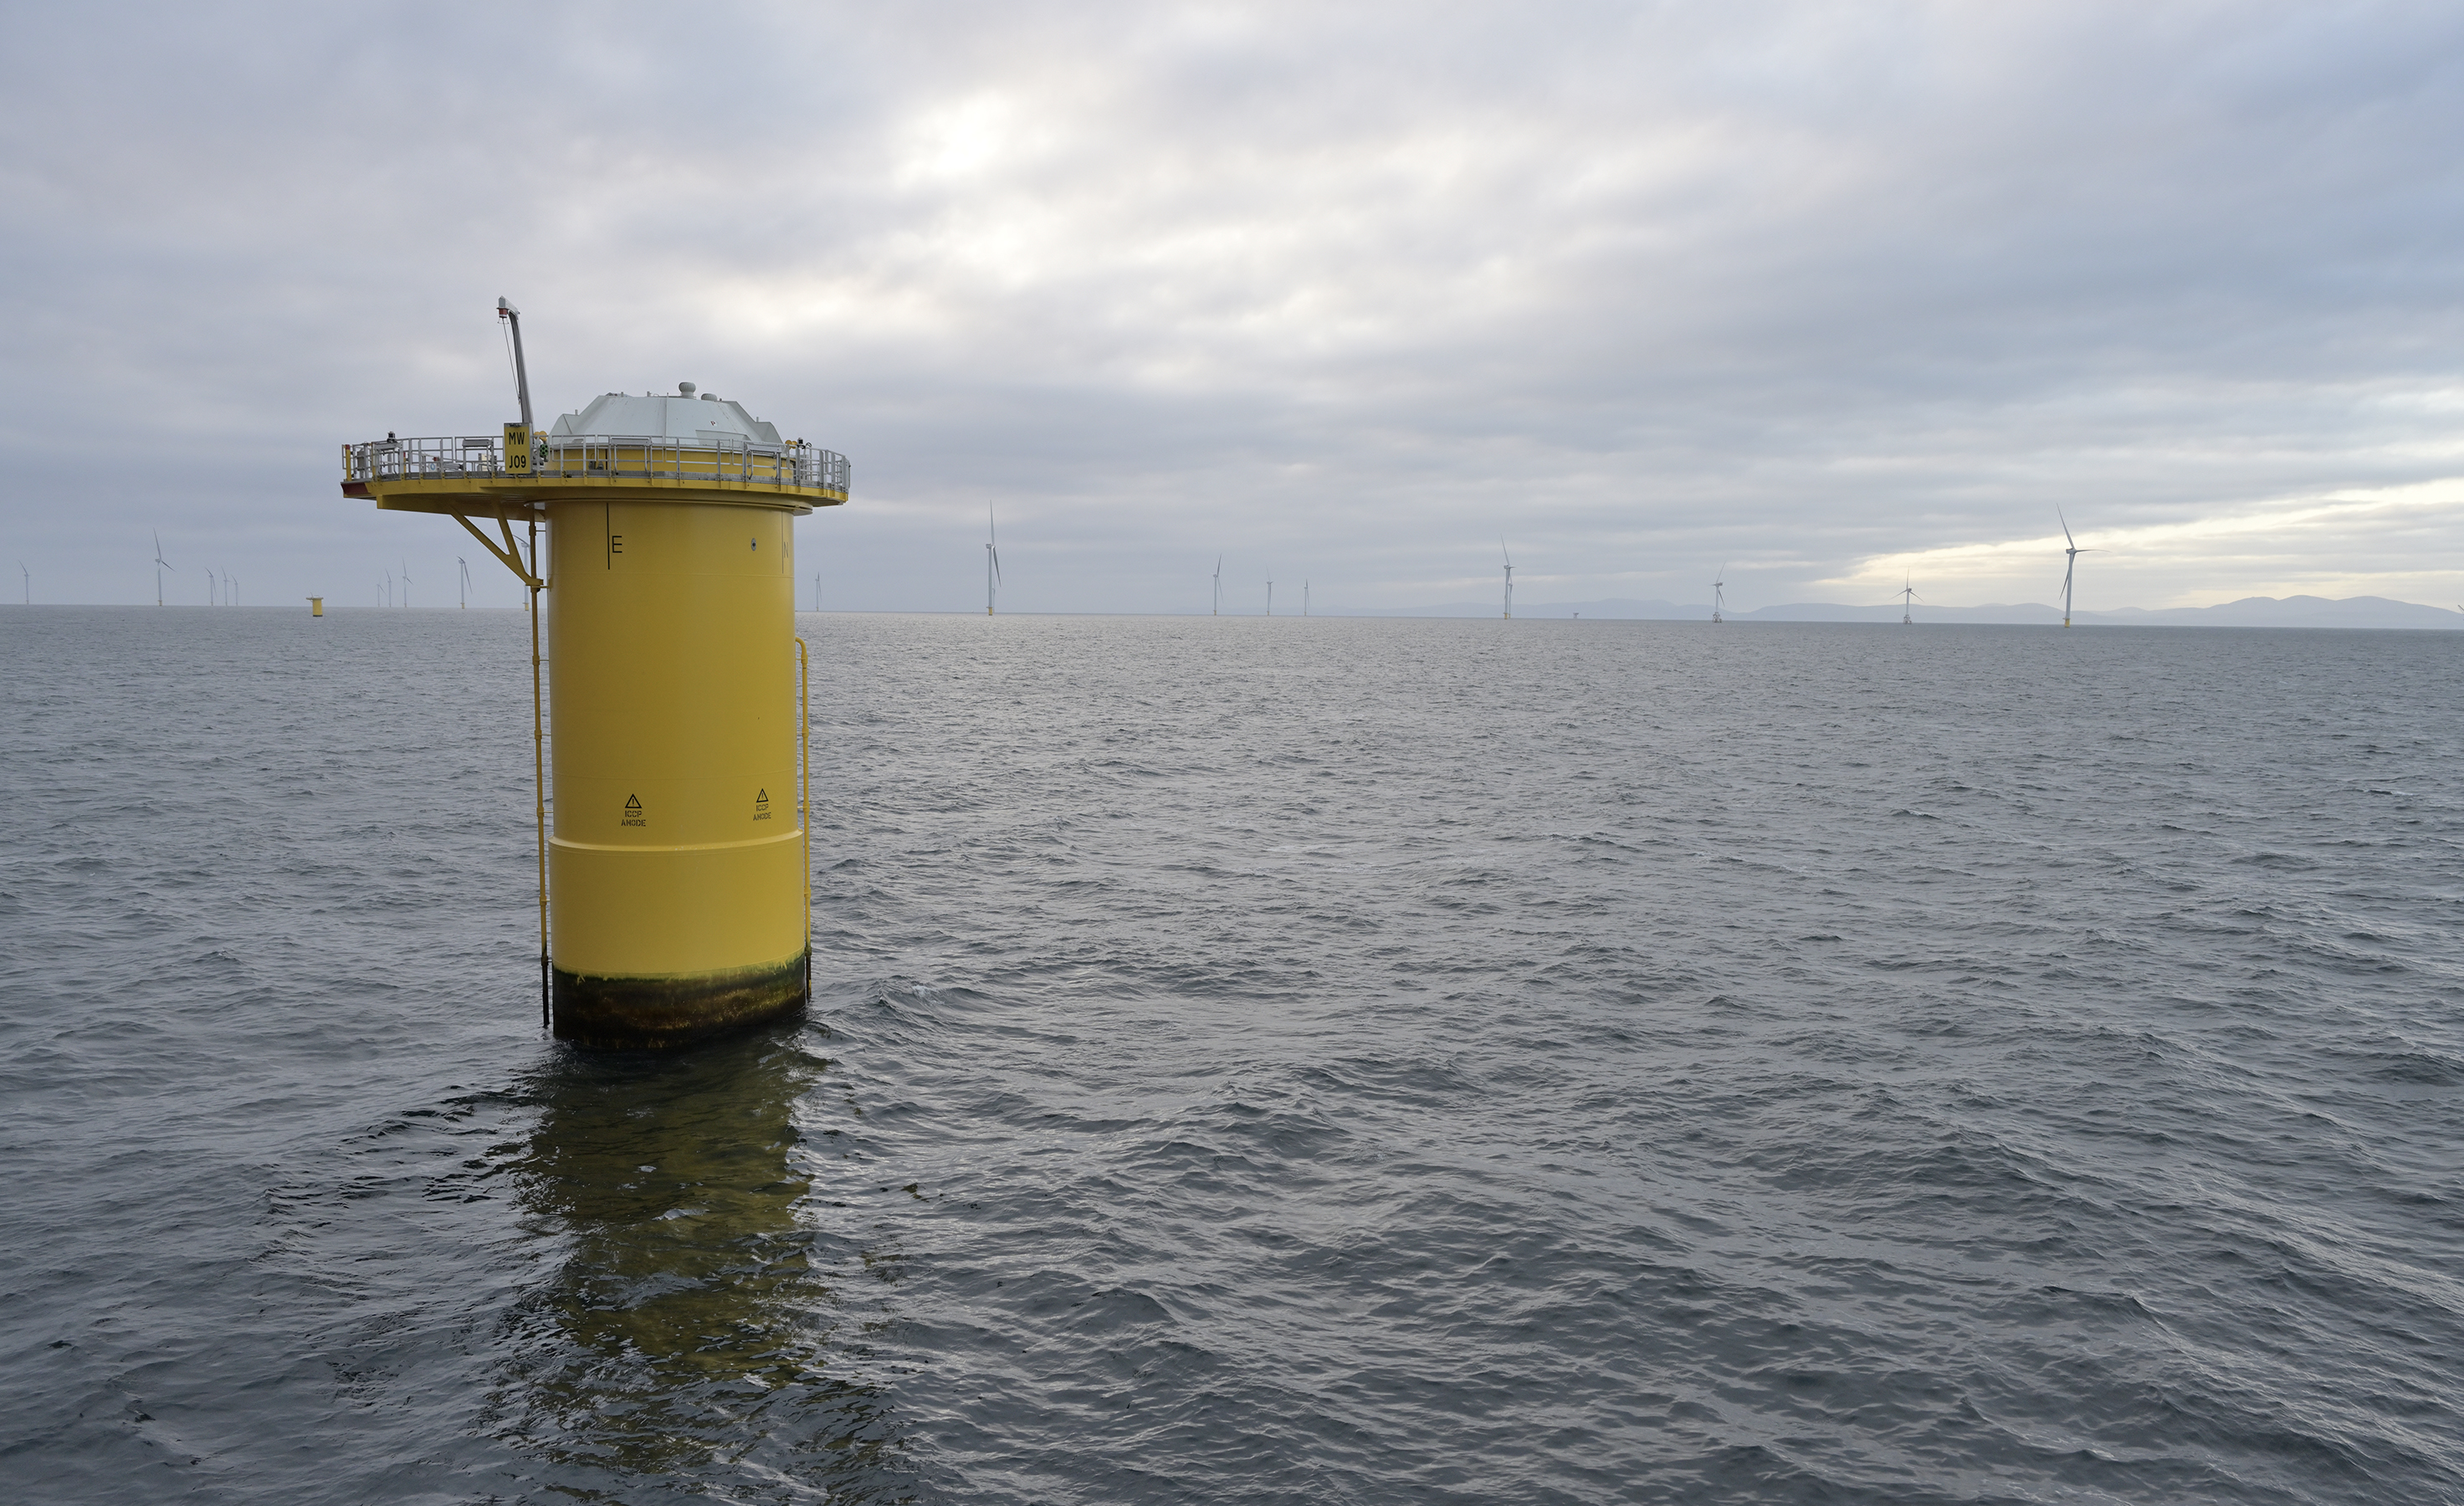
Note 27
Related Party Transactions
Continued from previous page
Guarantees provided by BW Group
BW Group has provided COSCO with four guarantees in respect of
the sums payable by Cadeler in accordance with the contracts for the
construction of certain P-class and A-class WTIVs in 2021, 2022 and
2023. Under this guarantee arrangement, certain fees are payable by
the Group to BW Group until the guarantees are discharged in full.
On 27 May 2024, additional guarantees were provided in respect of
the sums owed by Cadeler pursuant to the ordered third A-class
vessel.
Training courses provided by BW Maritime
BW Maritime has provided training courses for Cadeler’s onshore
staff as well as reimbursement of travelling costs for board members.
Administrative support provided by Scorpio Services
Holding
The Group, due to the business combination with Eneti, holds an
agreement with Scorpio Services Holding (“SSH”) for the provision of
administrative staff, office space and accounting, legal compliance,
financial and information technology services for which it is required
to reimburse to SSH for the direct and indirect expenses incurred in
providing such services.
Ultramax and Kamsarmax pools
Through the business combination the Company acquired
receivables positions from Eneti related to transactions to Scorpio
Group related parties for commercial management services. These
services involved securing employment for Eneti’s drybulk vessels in
the spot market or on time charters. The pools are owned by Scorpio
Holdings which is considered a related party.
207
Note 28
Commitments and Pledges
Lease commitments
The future minimum lease payables under non-cancellable low value and short-term leases contracted for
at the balance sheet date but not recognised as liabilities are as follows:
EUR'000 | 2025 | 2024 | 2023 |
Not later than one year | 16,483 | 117 | 1,090 |
Between one and five years | 229 | 219 | 4,984 |
16,712 | 336 | 6,074 |
As of 31 December 2025, the Company’s lease commitments included the lease of third-party vessels
related to T&I activities.
As of 31 December 2023, the Company’s lease commitments included the tenure of the new headquarters.
These commitments were reflected on the balance sheet starting in Q1 2024 as 'Right-of-Use Assets' and
'Lease Liabilities' in accordance with IFRS 16.
The Group has issued performance and payment guarantees through its banking partners in favour of
customers and suppliers in connection with offshore wind installation projects. At 31 December 2025,
outstanding guarantees totalled EUR 253 million. The guarantees relate to the Group’s contractual
performance and payment obligations. No provision has been recognised, as management assesses that an
outflow of resources is not probable. The Group would be required to reimburse the issuing bank should
any guarantee be called.
Pledge of Fixed Assets
The Green Corporate Facility detailed in Note 25 is secured by, inter alia, a first priority mortgage over the
Wind Orca, Wind Osprey, Wind Scylla and Wind Zaratan Vessels (EUR 603 million carrying amount, see Note
13). In addition, the facility is secured by a first priority assignment of the earnings of the vessel-owning
entities, including certain change of control provisions which are similar to those included in the P-class
Facility.
The P-class Facility, detailed in Note 25, is secured by a first priority mortgage over the P-class newbuild
vessels, first priority assignments of the insurances and earnings of the P-class newbuilds by Cadeler and the
two borrowers and contain customary financial and other covenants, including certain change of control
provisions. A change of control under the P-class Facility if any person or group of persons acting in concert
(other than Swire Pacific and the BW Group) legally and beneficially holds more than 25% of both the issued
and outstanding share capital and/or the issued and outstanding voting share capital of Cadeler A/S. In
addition, certain changes to the ownership structure further down in the Group will also trigger a change of
control, including, among others, circumstances in which Wind Pace Ltd (formerly referred as to N1064 Ltd)
or Wind Peak Ltd (formerly referred as to N1063 Ltd) ceases to be a wholly owned (direct or indirect)
subsidiary of Cadeler.
208
Note 28
Commitments and Pledges
Contractual amounts, newbuilds vessels:
Millions | P-Class | M-Class | A-Class | Total |
Contract amount in EUR | 220 | — | 299 | 519 |
Contract amount in USD | 390 | 655 | 794 | 1,839 |
Total Contract amount translated to EUR | 573 | 600 | 981 | 2,154 |
Remaining commitments, newbuilds vessels: | ||||
Commitment amount in EUR | — | — | 40 | 40 |
Commitment amount in USD | — | — | 496 | 496 |
Remaining commitment translated to EUR at 31 December 2025 | — | — | 462 | 462 |
Commitment amount in EUR | — | — | 105 | 105 |
Commitment amount in USD | 193 | 425 | 724 | 1,342 |
Remaining commitment translated to EUR at 31 December 2024 | 185 | 409 | 801 | 1,395 |
Commitment amount in EUR | 69 | — | 105 | 174 |
Commitment amount in USD | 390 | 524 | 426 | 1,340 |
Remaining commitment translated to EUR at 31 December 2023 | 421 | 474 | 490 | 1,385 |
Maturity of total payments are disclosed in Note 23.
P-Class vessels
Since 30 June 2021, the Company had a contract with COSCO to build two new P-class WTIVs. On 14 August
2024, Wind Peak was delivered and the final instalments were paid upon delivery. On 26 March 2025, Wind
Pace was delivered with the final instalments also paid upon delivery.
A-class vessels
On 9 May 2022 and 22 November 2022, the Company entered into contracts with COSCO to build a total of
two new A-class FIVs. In May 2024, the Company entered into an additional contract with COSCO to build
the third A-class FIV. On 29 September 2025, Wind Ally was delivered, with the final instalments paid upon
delivery.
The remaining amounts are due in 2026 and 2027 with expected deliveries in Q3 2026 and Q2 2027,
respectively.
M-Class vessels
As a result of the business combination with Eneti, the Company had a contract with Hanwha for the
construction of two next-generation offshore WTIVs.
On 31 January 2025, Wind Maker was delivered and the final instalments were paid upon delivery. On 28
November 2025, Wind Mover was delivered with the final instalments also paid upon delivery.
209
Note 29
Group Information
The consolidated financial statements of the Group include the following subsidiaries, which are all wholly
owned by the Parent Company:
Entities | Country |
Vessel owning entities | |
Wind Orca Ltd | Cyprus |
Wind Osprey Ltd | Cyprus |
Wind Peak Ltd (formerly referred as to N1063 Ltd) | Cyprus |
Wind Pace Ltd (formerly referred as to N1064 Ltd) | Cyprus |
Wind Ally Ltd. | Cyprus |
Wind Ace Ltd. | Cyprus |
Wind Maker Ltd (formerly referred to as Seajacks 1 Ltd) | UK |
Wind Mover Ltd (formerly referred to as Seajacks 5 Ltd) | UK |
Wind Scylla Ltd (formerly referred to as Seajacks 5 Ltd) | UK |
Wind Keeper Ltd (formerly referred to as Seajacks 7 Ltd) | UK |
Seajacks 3 Japan LLC | Japan |
Trading and Operations | |
Cadeler UK Ltd (formerly referred to as Seajacks UK Ltd) | UK |
Cadeler UK Ltd Taiwan Branch (formerly referred as to Seajacks UK Ltd Taiwan Branch) | Taiwan |
Seajacks US Inc. | USA |
Seajacks Merman Marine Ltd | Bermuda |
Cadeler Crewing Services Ltd (formerly referred to as Seajacks Crewing Services Ltd) | UK |
Cadeler Management Services SARL | Monaco |
Seajacks Japan LLC | Japan |
Investment holding entities | |
Wind MI Ltd | Marshall Islands |
Cadeler Holdings Ltd (formerly referred to as Atlantis Investorco Ltd) | Bermuda |
Atlantis Investorco Ltd | UK |
Entities | Country |
Investment holding entities (continuation) | |
Cadeler International Ltd (formerly referred to as Seajacks International Ltd) | UK |
Dormant entities | |
SBI Chartering and Trading Ltd | Marshall Islands |
SBI Macarena Shipping Company Ltd | Marshall Islands |
SBI Taurus Shipping Company Ltd | Marshall Islands |
During 2025, several entities were dissolved:
Entities | Country |
Investment holding entities | |
Atlantis Equityco Ltd | UK |
Atlantis Midco Ltd | UK |
Dormant entities | |
SBI Parapara Shipping Company Ltd | Marshall Islands |
SBI Pegasus Shipping Company Ltd | Marshall Islands |
SBI Perseus Shipping Company Ltd | Marshall Islands |
Eneti (Bermuda) Ltd | Bermuda |
Seajacks 2 Ltd | UK |
Seajacks 3 Ltd | UK |
Seajacks 8 Limited | UK |
210
Note 30
Events After Reporting Period
Management has evaluated events and transactions occurring after
the balance sheet date through the date the financial statements
were available to be issued. Based on this evaluation, there were no
subsequent events identified that require adjustment to or disclosure
in the accompanying financial statements.
Note 31
Authorisation of Financial
Statements
These financial statements were authorised for issue by a resolution
of the Board of Directors and Executive Management of Cadeler A/S
on 24 March 2026 and will be submitted for approval to the
shareholders of the Company at the annual general meeting to be
held on 21 April 2026.
211
Parent Company
Financial
Statements
212
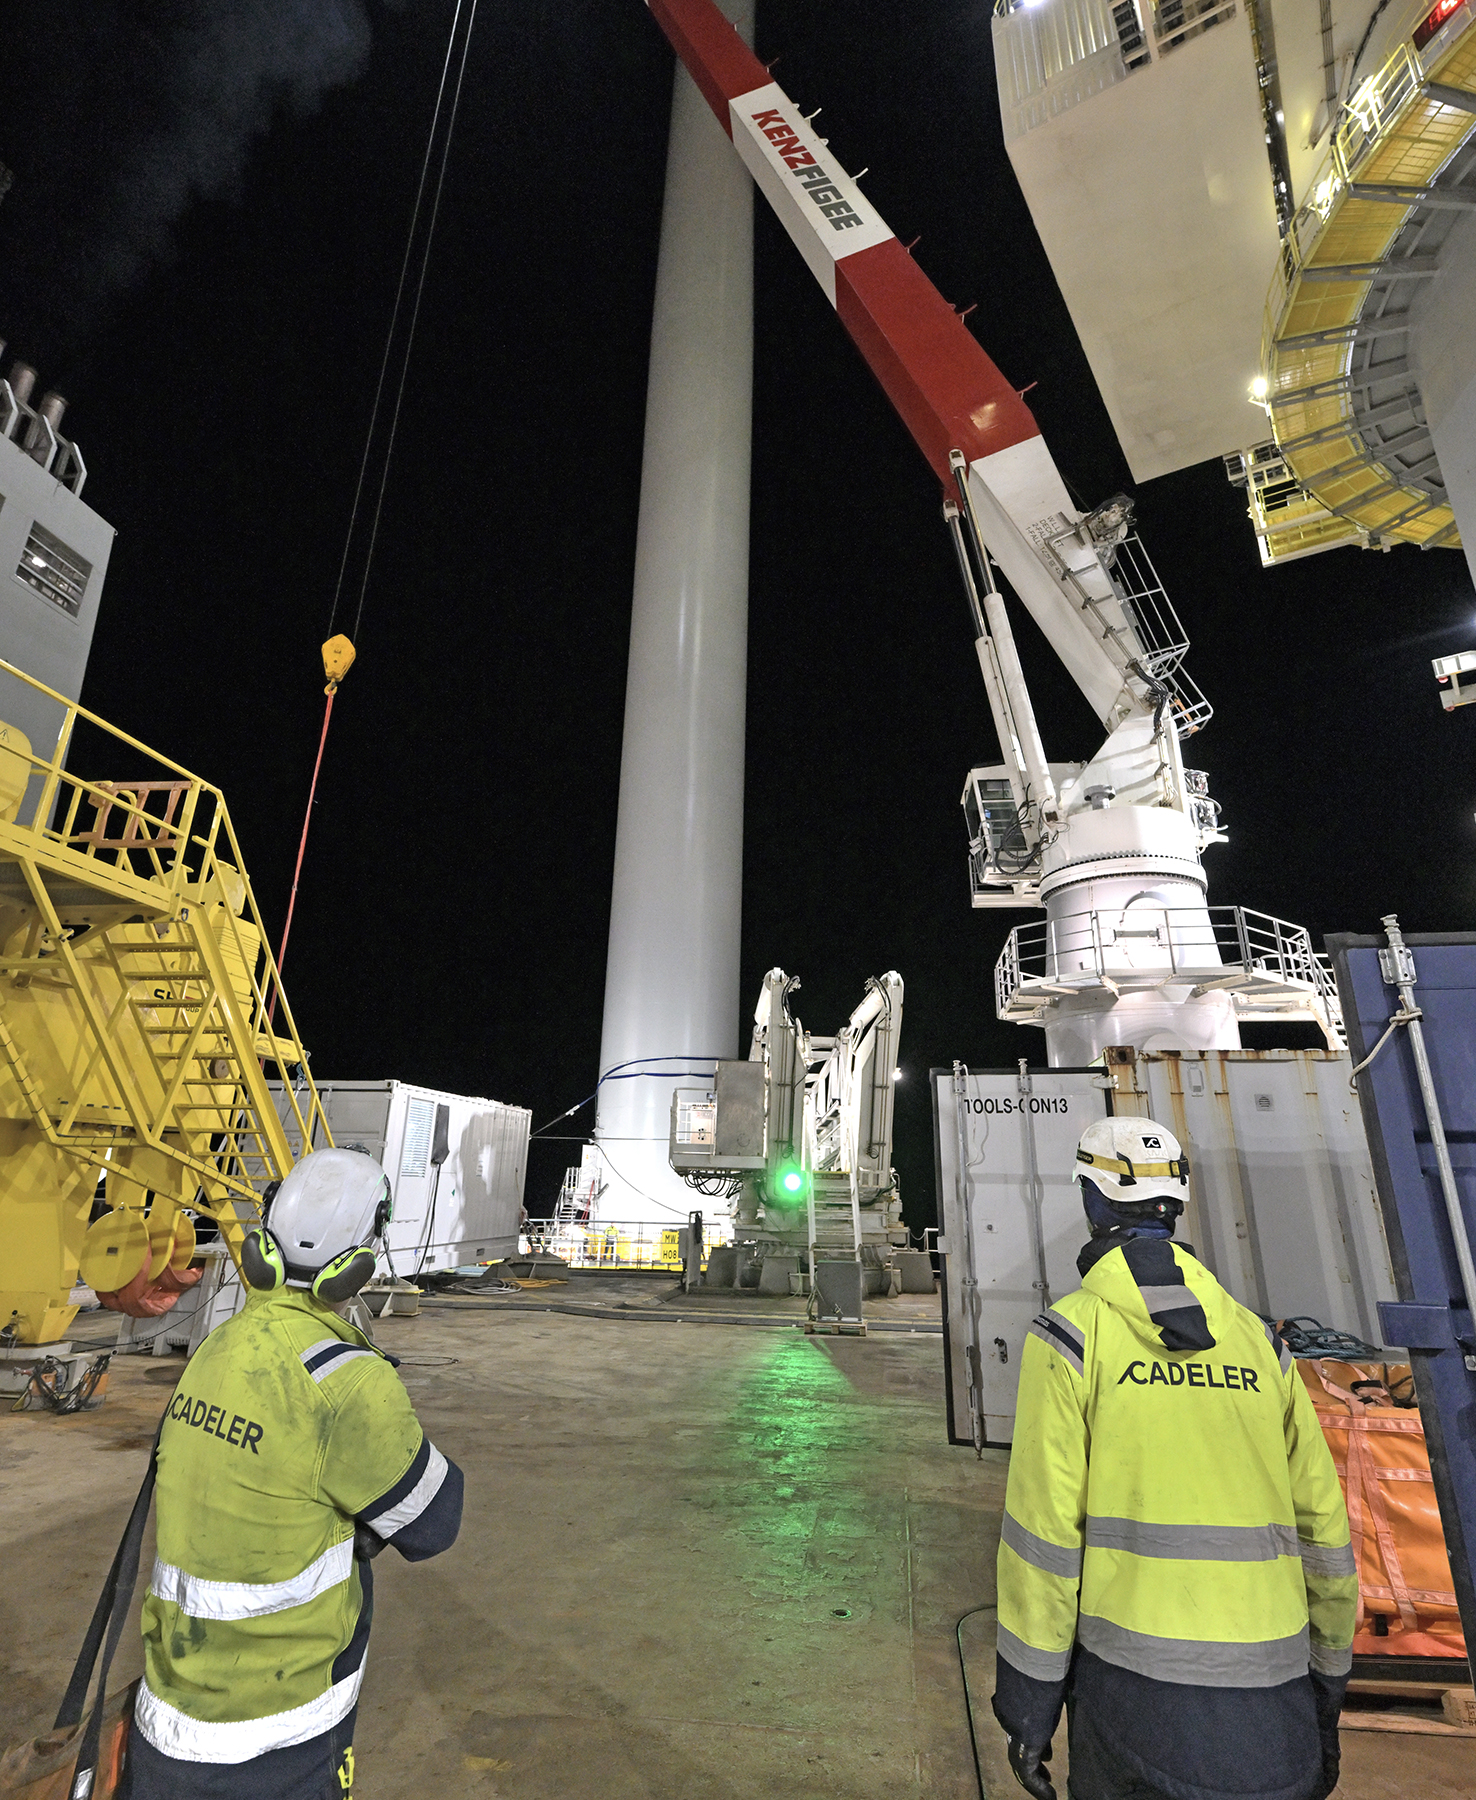
Parent Company Statement of Profit and Loss
EUR'000 | Note | 2025 | 2024 | 2023 |
Revenue | 2 | 422,004 | 126,680 | 108,810 |
Cost of sales | 3 | (221,318) | (77,283) | (57,077) |
Gross profit | 200,686 | 49,397 | 51,733 | |
Administrative expenses | 3 | (55,217) | (38,347) | (33,666) |
Operating profit | 145,469 | 11,050 | 18,067 | |
Finance income | 1,312 | 11,258 | 1,362 | |
Finance costs | (31,283) | (2,496) | (8,081) | |
Profit before income tax | 115,498 | 19,812 | 11,348 | |
Income tax credit/expense | 5 | (1,359) | — | — |
Profit for the year | 114,139 | 19,812 | 11,348 |
213
Parent Company Balance Sheet
EUR'000 | Note | 2025 | 2024 | 2023 |
Assets | ||||
Non-current assets | ||||
Intangible assets | 7 | 1,000 | 312 | 240 |
Property, plant and equipment | 8 | 361,248 | 475,632 | 369,154 |
Other non-current assets | 20,000 | — | — | |
Financial assets | ||||
Investments in subsidiaries | 9 | 1,105,545 | 745,499 | 745,489 |
Leasehold deposits | 1,141 | 1,014 | 1,220 | |
Derivatives | 11 | 540 | 1,915 | 338 |
Total financial assets | 1,107,226 | 748,428 | 747,047 | |
Total non-current assets | 1,489,474 | 1,224,372 | 1,116,441 | |
Current assets | ||||
Inventories | 2,377 | 848 | 1,836 | |
Receivables | ||||
Trade receivables | 168,506 | 47,958 | 35,227 | |
Receivables from subsidiaries | 15 | 173,243 | 424,506 | 91,510 |
Current Income tax receivable | — | — | 12 | |
Other current assets | 6,940 | 11,140 | 5,212 | |
Total receivables | 348,689 | 483,604 | 131,961 | |
Derivatives | 11 | — | 7,742 | — |
Cash and bank balances | 41,311 | 16,727 | 59,436 | |
Total current assets | 392,377 | 508,921 | 193,233 | |
Total assets | 1,881,851 | 1,733,293 | 1,309,674 |
EUR'000 | Note | 2025 | 2024 | 2023 |
Equity | ||||
Share capital | 14 | 47,144 | 47,144 | 41,839 |
Share premium | 1,099,495 | 1,099,495 | 952,858 | |
Treasury shares | (2,999) | (1,283) | — | |
Reserves | (3,116) | (8,365) | (17,938) | |
(Accumulated losses)/retained earnings | 113,716 | (2,494) | (23,968) | |
Total equity | 1,254,240 | 1,134,497 | 952,791 | |
Liabilities | ||||
Non-current liabilities | ||||
Debt to credit institutions | 12 | 439,575 | 358,395 | 204,773 |
Deferred revenue | 2 | 27,759 | 942 | 1,778 |
Derivatives | 11 | 5,331 | 12,906 | 17,957 |
Total non-current liabilities | 472,665 | 372,243 | 224,508 | |
Current liabilities | ||||
Debt to credit institutions | 12 | 15,463 | 13,056 | 799 |
Deferred revenue | 2 | 107,662 | 31,641 | 10,190 |
Trade and other payables | 31,078 | 29,344 | 16,437 | |
Payables to related parties | 306 | 181 | 10 | |
Payables to subsidiaries | 15 | 5 | 152,317 | 100,922 |
Current income tax liabilities | 432 | 14 | 13 | |
Derivatives | 11 | — | — | 4,004 |
Total current Liabilities | 154,946 | 226,553 | 132,375 | |
Total liabilities | 627,611 | 598,796 | 356,883 | |
Total equity and liabilities | 1,881,851 | 1,733,293 | 1,309,674 |
214
Parent Company Statement of Changes in Equity
EUR'000 | Note | Share capital | Share premium | Treasury shares | Hedging reserves | (Accumulated losses)/ retained earnings | Total |
2025 | |||||||
Beginning of financial year | 47,144 | 1,099,495 | (1,283) | (8,365) | (2,494) | 1,134,497 | |
Profit for the year | — | — | — | — | 114,139 | 114,139 | |
Value adjustments of hedging instruments | — | — | — | 5,249 | — | 5,249 | |
Treasury shares | — | — | (1,716) | — | — | (1,716) | |
Share-based payments | — | — | — | — | 2,071 | 2,071 | |
End of financial year | 47,144 | 1,099,495 | (2,999) | (3,116) | 113,716 | 1,254,240 | |
2024 | |||||||
Beginning of financial year | 41,839 | 952,858 | — | (17,938) | (23,968) | 952,791 | |
Profit for the year | — | — | — | — | 19,812 | 19,812 | |
Value adjustments of hedging instruments | — | — | — | 9,573 | — | 9,573 | |
Capital increase February 2024 | 9 | 5,301 | 149,567 | — | — | — | 154,868 |
Costs incurred in connection with February 2024 capital increase | — | (3,014) | — | — | — | (3,014) | |
Capital increase June 2024 | 4 | 84 | — | — | — | 88 | |
Treasury shares | — | — | (1,283) | — | — | (1,283) | |
Share-based payments | — | — | — | — | 1,662 | 1,662 | |
End of financial year | 47,144 | 1,099,495 | (1,283) | (8,365) | (2,494) | 1,134,497 |
215
Parent Company Statement of Changes in Equity
Continued from previous page
EUR'000 | Note | Share capital | Share premium | Treasury shares | Hedging reserves | (Accumulated losses)/ retained earnings | Total |
2023 | |||||||
Beginning of financial year | 26,575 | 509,542 | — | 1,343 | (12,831) | 524,629 | |
Profit for the year | — | — | — | — | 11,348 | 11,348 | |
Value adjustments of hedging instruments | — | — | — | (19,281) | (19,281) | ||
Registration of new shares in connection with December 2023 business combination | 15,264 | 450,271 | — | — | — | 465,535 | |
Costs incurred in connection with listing | (6,955) | — | — | — | (6,955) | ||
Changes from business combination | — | — | — | — | (23,619) | (23,619) | |
Share-based payments | — | — | — | — | 1,134 | 1,134 | |
End of financial year | 41,839 | 952,858 | — | (17,938) | (23,968) | 952,791 |
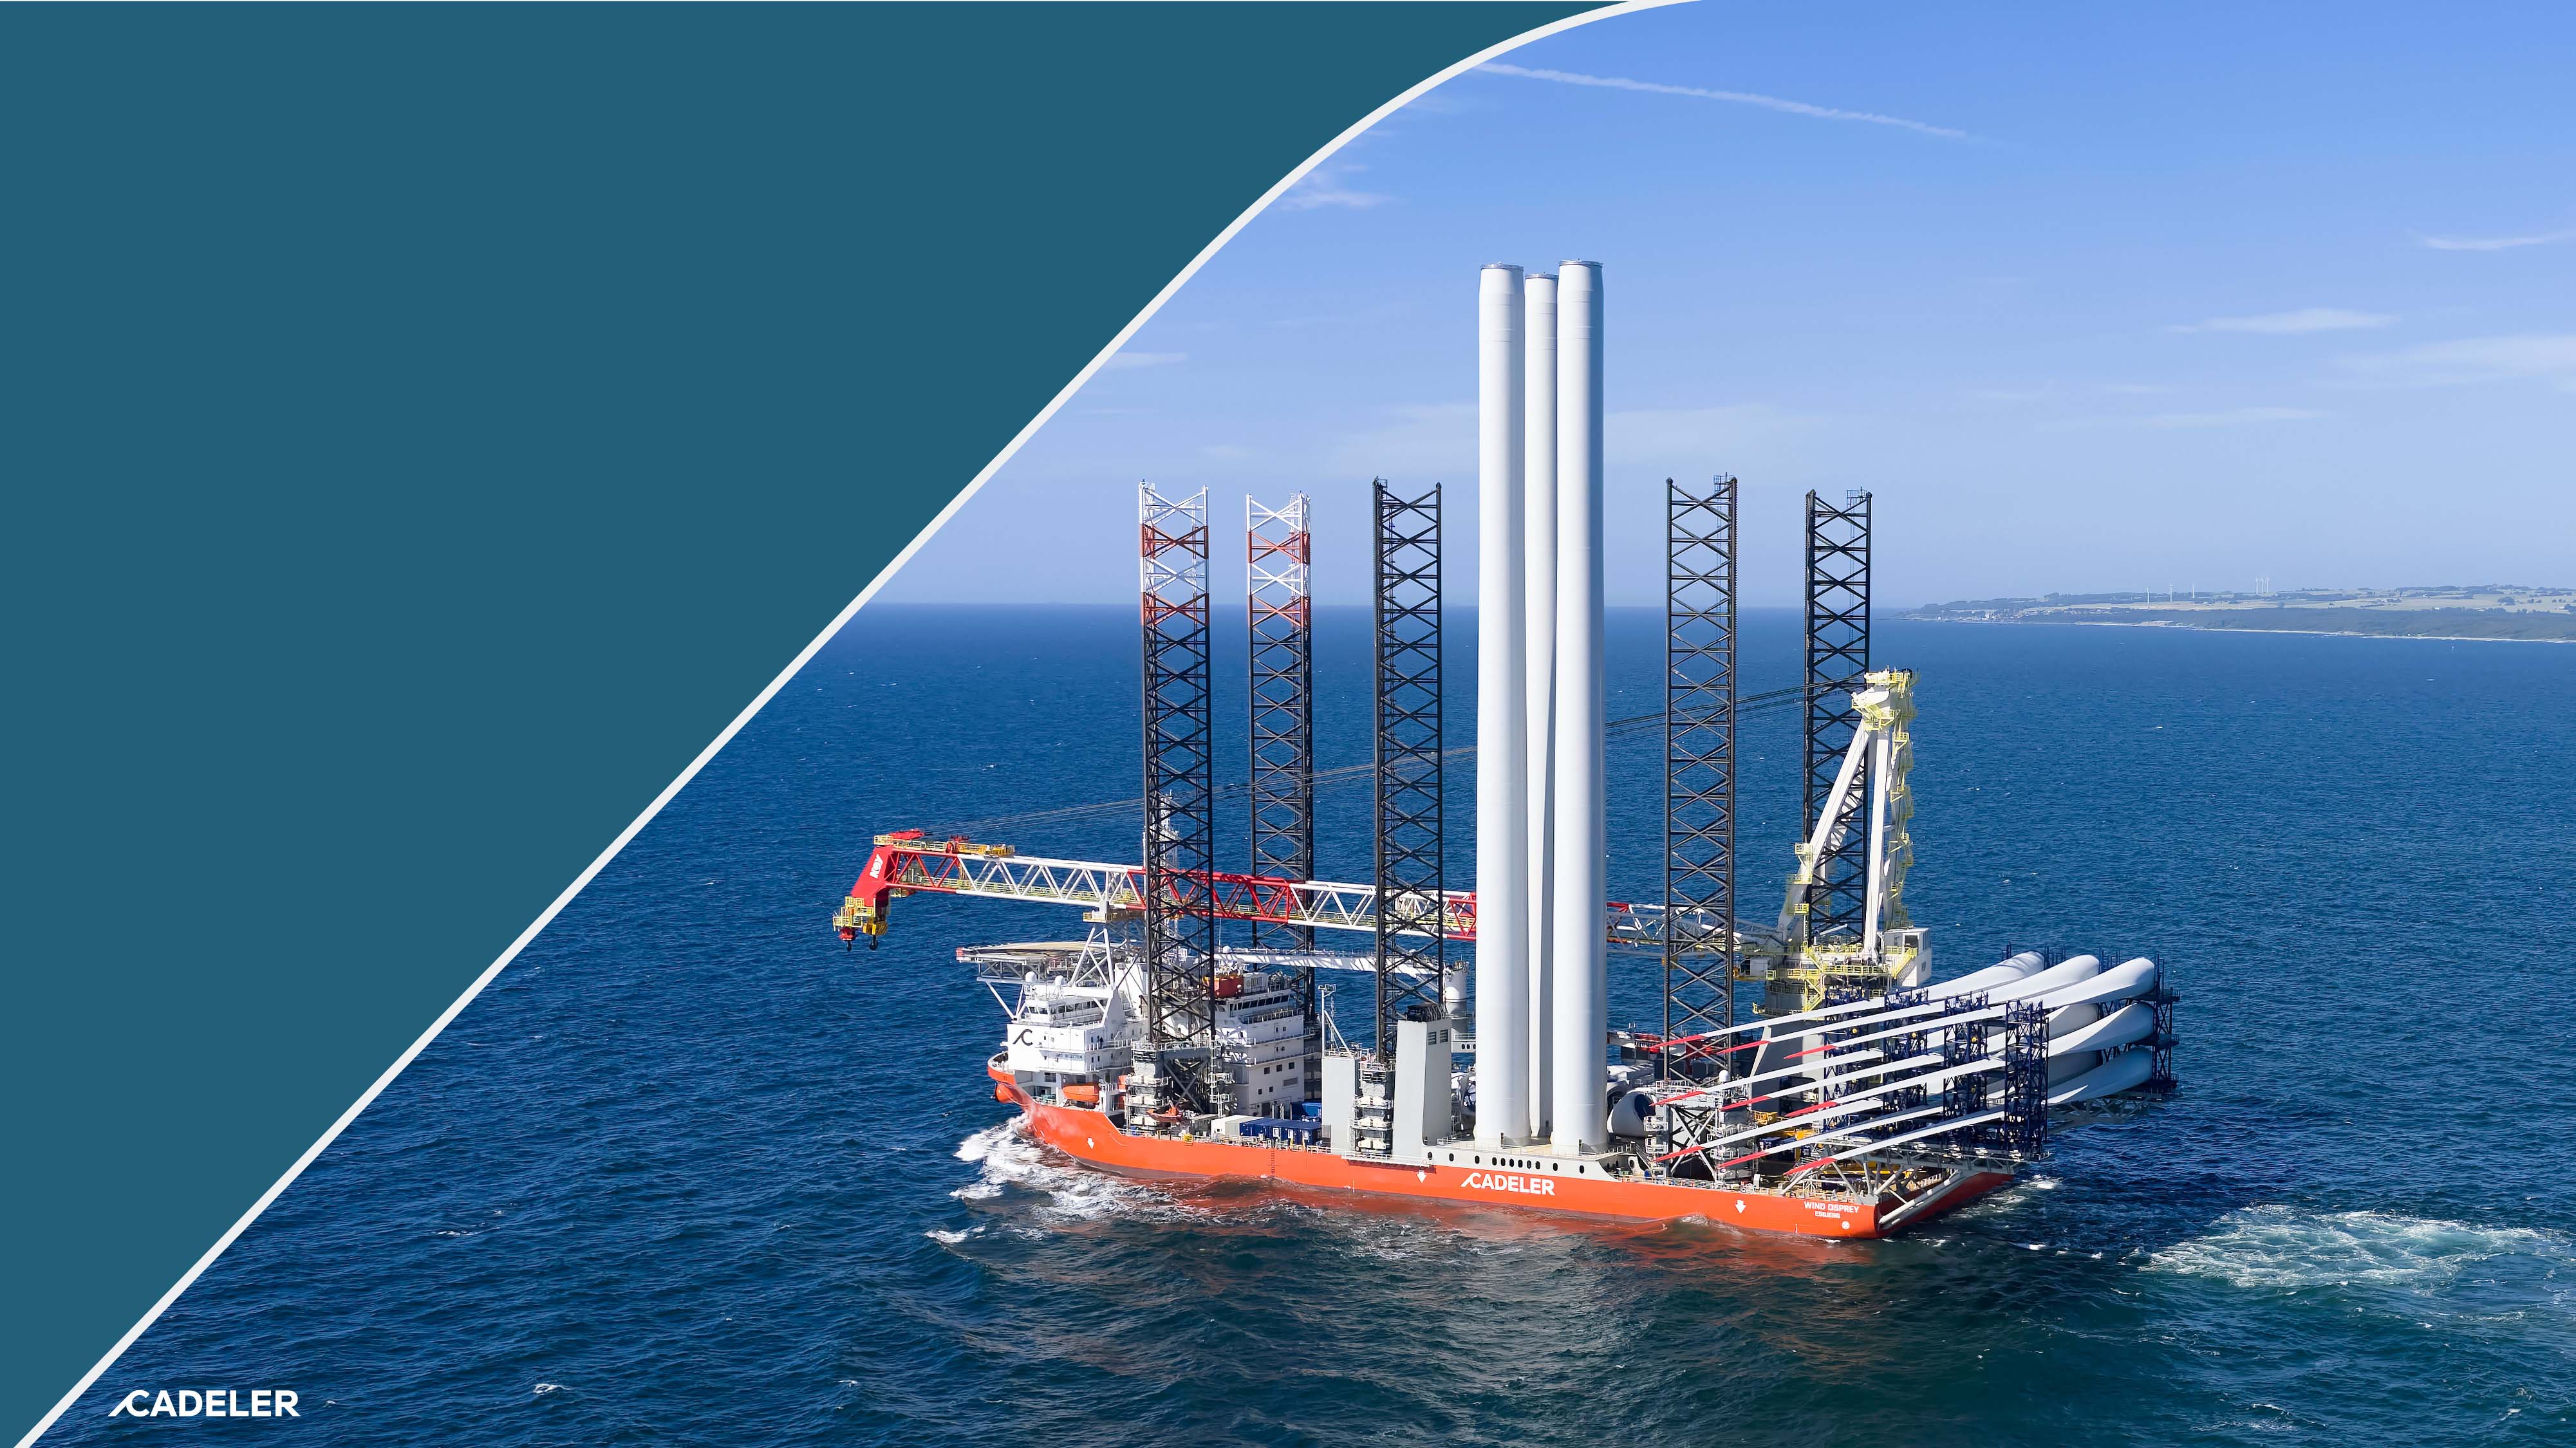
216
Notes to the Parent
Company Financial
Statements
217
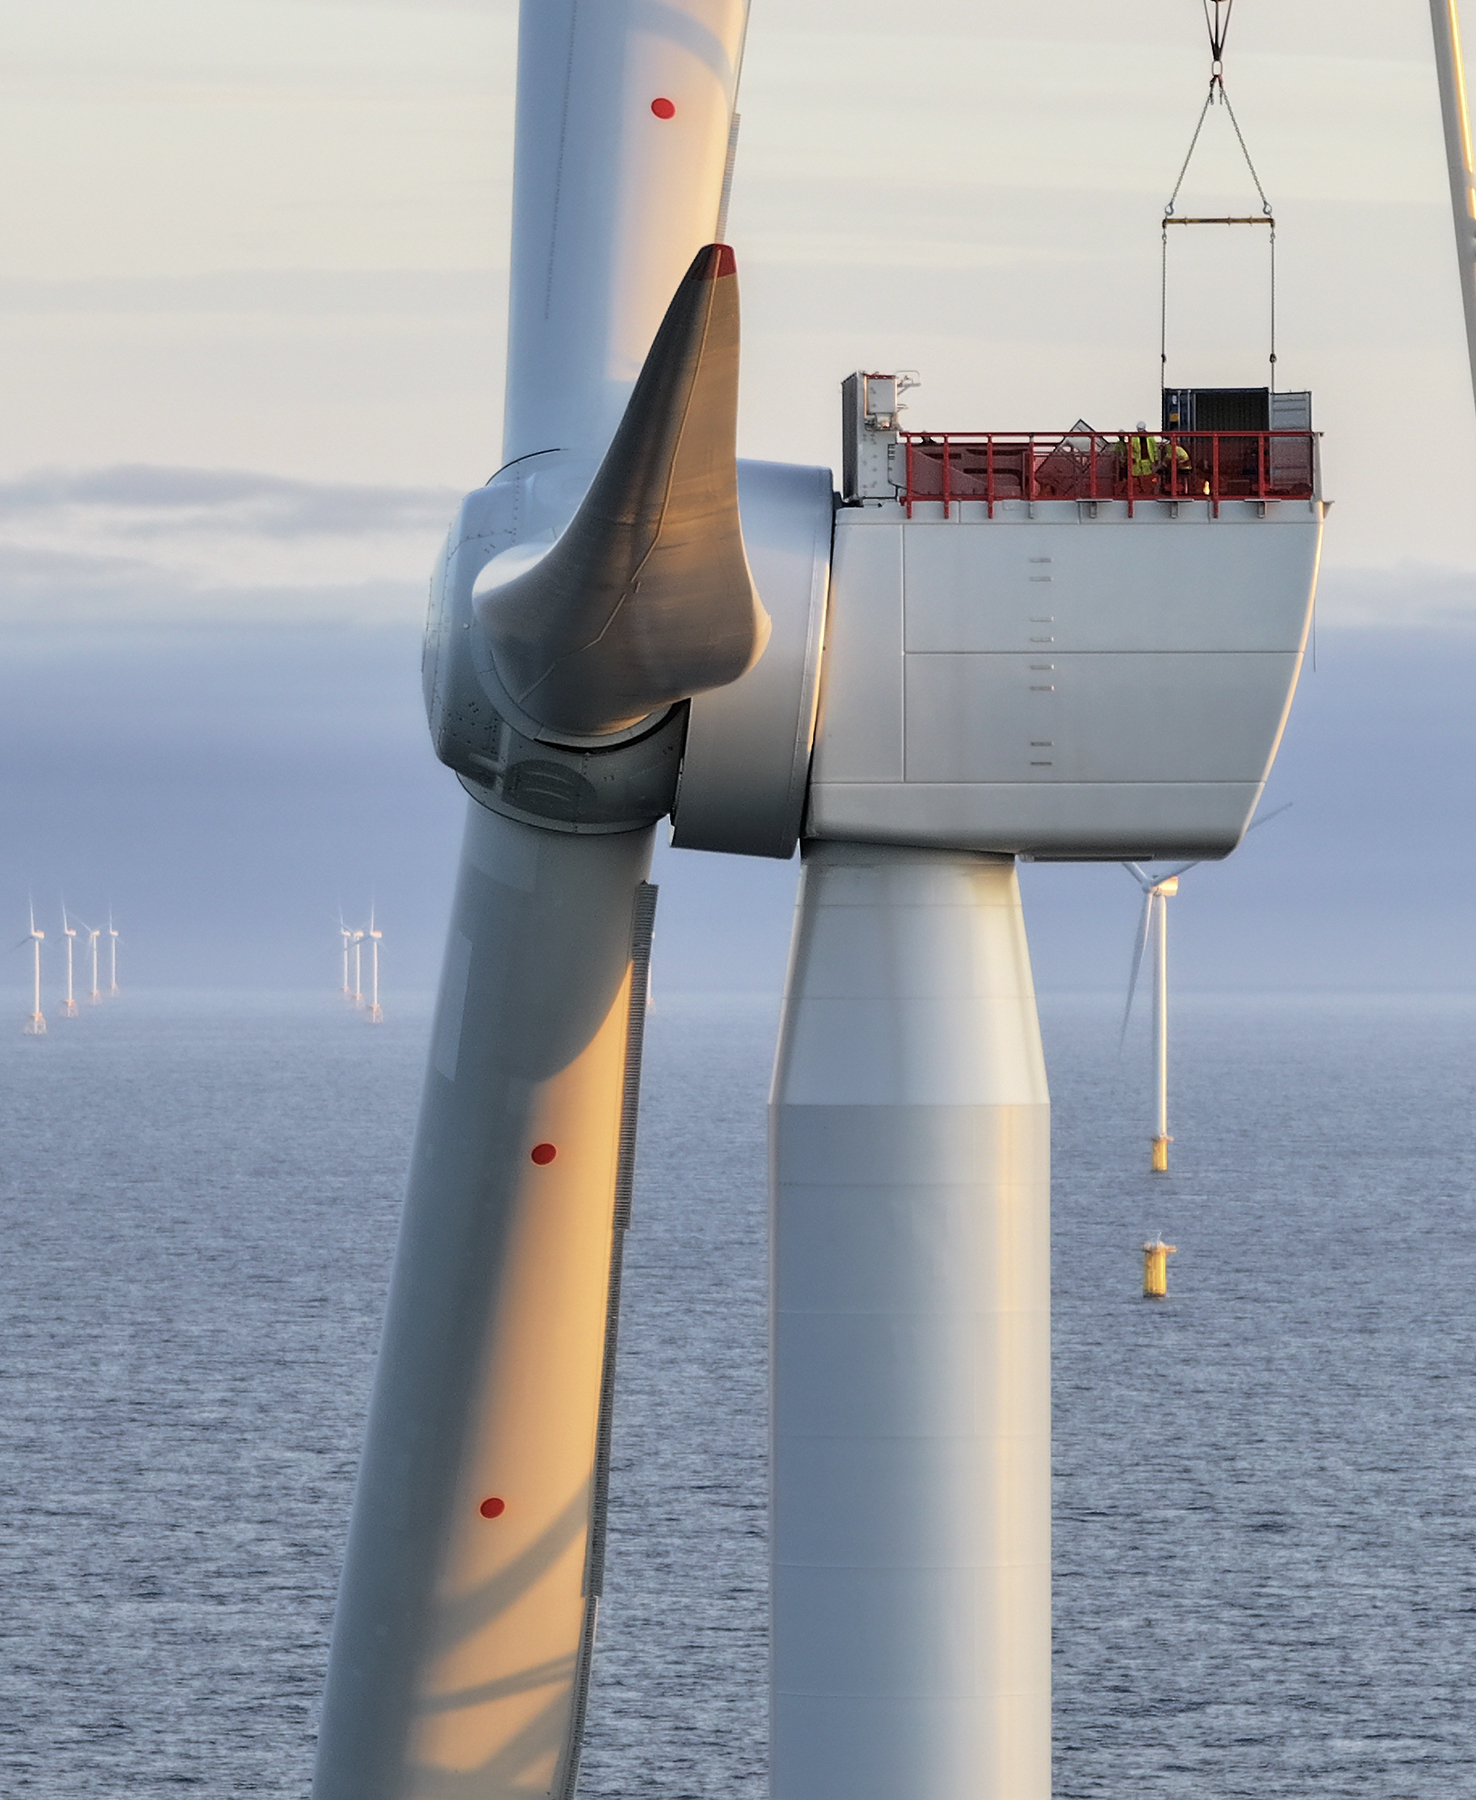
Note 1
Accounting Policies
The Parent Company financial statements of Cadeler A/S for 2025
have been prepared in accordance with the provisions of the Danish
Financial Statements Act applicable to reporting class D entities.
The Parent Company’s accounting policies on recognition and
measurement are generally consistent with those of the Group. Any
differences between the Parent Company’s accounting policies and
the Group’s accounting policies are described below.
Changes in accounting policies
The Parent Company financial statements have been prepared using
the same accounting policies as in the prior years.
Omission of a cash flow statement
With reference to Section 86(4) of the Danish Financial Statements
Act, no cash flow statement has been prepared. The Company's cash
flows are included in the consolidated cash flow statement of Cadeler
A/S.
Dividends from subsidiaries
Dividends from subsidiaries are recognised in the statement of profit
and loss to the extent that the dividend does not exceed the
accumulated earnings of the subsidiary during the period of
ownership.
Receivables
Receivables are measured at amortised cost.
The Company has chosen IAS 39 as the basis for impairment of
financial receivables.
An impairment loss is recognised if there is objective evidence that a
receivable or a group of receivables is impaired. If there is objective
evidence that an individual receivable has been impaired, an
impairment loss is recognised on an individual basis.
Revenue
The Company has chosen IFRS 15 under Danish GAAP as the basis for
revenue recognition. For further information on accounting policies
refer to Note 3 in the consolidated financial statements.
The Company’s revenue includes intercompany transactions with
Wind Orca, Wind Osprey, Wind Peak, and Wind Pace, which are
governed by ship management agreements. The Company
recognises revenue from the Wind entities during off-hire periods
(off-hire ship management costs).
Investments in subsidiaries
Investments in subsidiaries are initially measured at cost less
impairment. Dividends received that exceed the accumulated
earnings of the subsidiary during the period of ownership are treated
as a reduction of the investment cost. Costs incurred in connection
with the purchase of subsidiaries are included in the cost of the
investment. Where the carrying amount exceeds the recoverable
amount, an impairment loss is recognised, reducing the carrying
amount to the recoverable amount.
The carrying amount of investments in subsidiaries is tested for
impairment when an indication of impairment arises.
218
Note 1
Accounting Policies
Continued from previous page
Derivatives and hedge accounting
Derivative financial instruments are initially recognised at fair value on
the date on which a derivative contract is entered into and
subsequently remeasured at fair value through profit and loss.
Derivatives are carried as financial assets, presented under derivatives
assets, when the fair value is positive and as financial liabilities,
presented under derivatives liabilities, when the fair value is negative.
For further details on the accounting policies, refer to Note 23 in the
Consolidated Financial Statements, with the exception that cost of
hedging is not permitted under Danish GAAP.
Property, plant and equipment
Property, plant and equipment are recognised at cost less
accumulated depreciation and accumulated impairment losses.
Depreciation is calculated using the straight-line method to allocate
their depreciable amounts over the assets’ estimated useful lives. The
estimated useful lives are as follows:
Useful lives | |
Other fixtures and fittings | Two to three years |
Share capital
Ordinary shares are classified as equity. When there is a capital
increase through the issuance of new shares, these shares are
recorded at their nominal value.
Share premium reserve and treasury shares
The share premium reserve represents the capital contributed by
investors exceeding the nominal value of the shares issued, net of any
incremental costs directly associated with the issuance of new shares.
Own equity instruments that are reacquired (treasury shares) are
recognised at cost and deducted from equity. No gain or loss is
recognised in profit or loss on the purchase, sale, issue or
cancellation of the Group’s own equity instruments. Any difference
between the carrying amount and the consideration received, if
reissued, is recognised in equity.
Hedging reserves and retained earnings
Hedging reserves reflect the changes in the fair value of derivative
financial instruments designated as cash flow hedges. Retained
earnings include results from prior periods, changes in equity arising
from business combination purchase price adjustments, and share-
based payments.
Share-based payments
Employees (including senior executives) of the Group receive
remuneration in the form of share-based payments, whereby
employees render services as consideration for equity instruments
(equity-settled transactions). For further details on the accounting
policies, refer to Note 7 in the Consolidated Financial Statements.
Changes in the fair value of derivative financial instruments
designated as cash flow hedges are recognised in equity and
presented under “Hedging reserves” (equity).
Leasing with the Company as lessee
The Company has decided to apply IAS 17 as the basis for accounting
for leases. Leases that do not transfer substantially all the risks and
rewards incident to ownership to the entity are operating leases.
Payments relating to operating leases and any other leases are
recognised in the income statement over the term of the lease. The
Group’s or the Parent Company’s total liabilities relating to operating
leases and other leases are disclosed under contingencies.
219
Note 2
Revenue
Refer to Note 3 in the consolidated financial statements for disclosure
relating to revenue.
Parent company revenue includes the receipt of termination fees
under a Long-Term Agreement (LTA). Further includes revenue from
related parties totalling EUR 7.4 million (2024: EUR 2.1 million; 2023:
EUR 3.6 million). Related party revenue consists of income derived
from the management and maintaining of the two WTIVs during off-
hire periods.
Deferred revenue relates to that portion of the consideration received
from customers that relates to unsatisfied performance obligations
under the relevant charter contract at the time of the receipt of that
revenue. Revenue will be recognised when the related services are
provided to the customers. For further information on accounting
policies, refer to Note 3 in the Consolidated Financial Statements.
Segment information
The Group’s management does not operate or make decisions based
on customer types, types of service, revenue streams or geographical
segments. In 2025, the Group operated nine WTIVs, which are viewed
as a single operating segment and can operate in all geographical
areas required for the specification of a specific windfarm project.
The following table presents financial information by country and
region based on the location of the service provided. Individual
countries are shown if they are above 10% of revenue:
EUR'000 | 2025 | 2024 | 2023 |
Total revenue by country and region | |||
Denmark | 102,466 | 51,095 | 5,000 |
UK | 131,631 | 68,060 | 48,472 |
Germany | 60,439 | — | — |
Poland | 58,512 | — | — |
Netherlands | — | 5,410 | 51,758 |
Rest of Europe | 12,435 | 2,115 | 3,580 |
Europe | 365,483 | 126,680 | 108,810 |
United States | 56,521 | — | — |
Total Revenue | 422,004 | 126,680 | 108,810 |
220
Note 3
Expenses by Nature
EUR'000 | Note | 2025 | 2024 | 2023 |
Cost of sales | ||||
Bareboat charter hire, from subsidiaries | 134,608 | 43,407 | 29,508 | |
Insurance | 3,598 | 1,066 | 42 | |
Seafarer payroll | 4 | 27,215 | 15,590 | 14,420 |
Fuel and oil | 6,015 | 1,121 | 501 | |
Maintenance | 9,550 | 4,145 | 4,917 | |
Messing costs | 2,743 | 1,304 | 1,398 | |
Seafarer travel | 7,774 | 3,031 | 2,835 | |
Specific charter costs | 28,535 | 6,463 | 2,882 | |
Utilities | 1,064 | 719 | 389 | |
Other operating expenses | 189 | 437 | 190 | |
Tonnage tax | 27 | — | (5) | |
Total cost of sales | 221,318 | 77,283 | 57,077 |
EUR'000 | Note | 2025 | 2024 | 2023 |
Administrative expenses | ||||
Depreciation and amortisation | 7,8 | 1,316 | 970 | 504 |
Employee compensation | 4 | 33,406 | 20,680 | 18,983 |
Repair and maintenance expenses | 2,802 | 2,270 | 1,123 | |
Legal and professional fees | 7,359 | 5,908 | 1,406 | |
Transaction costs | — | — | 7,707 | |
Rental expenses | 2,671 | 2,385 | 731 | |
Travel expense | 1,687 | 1,164 | 965 | |
Marketing and entertainment expenses | 830 | 1,001 | 601 | |
Other expenses | 5,146 | 3,969 | 1,646 | |
Total administrative expenses | 55,217 | 38,347 | 33,666 |
221
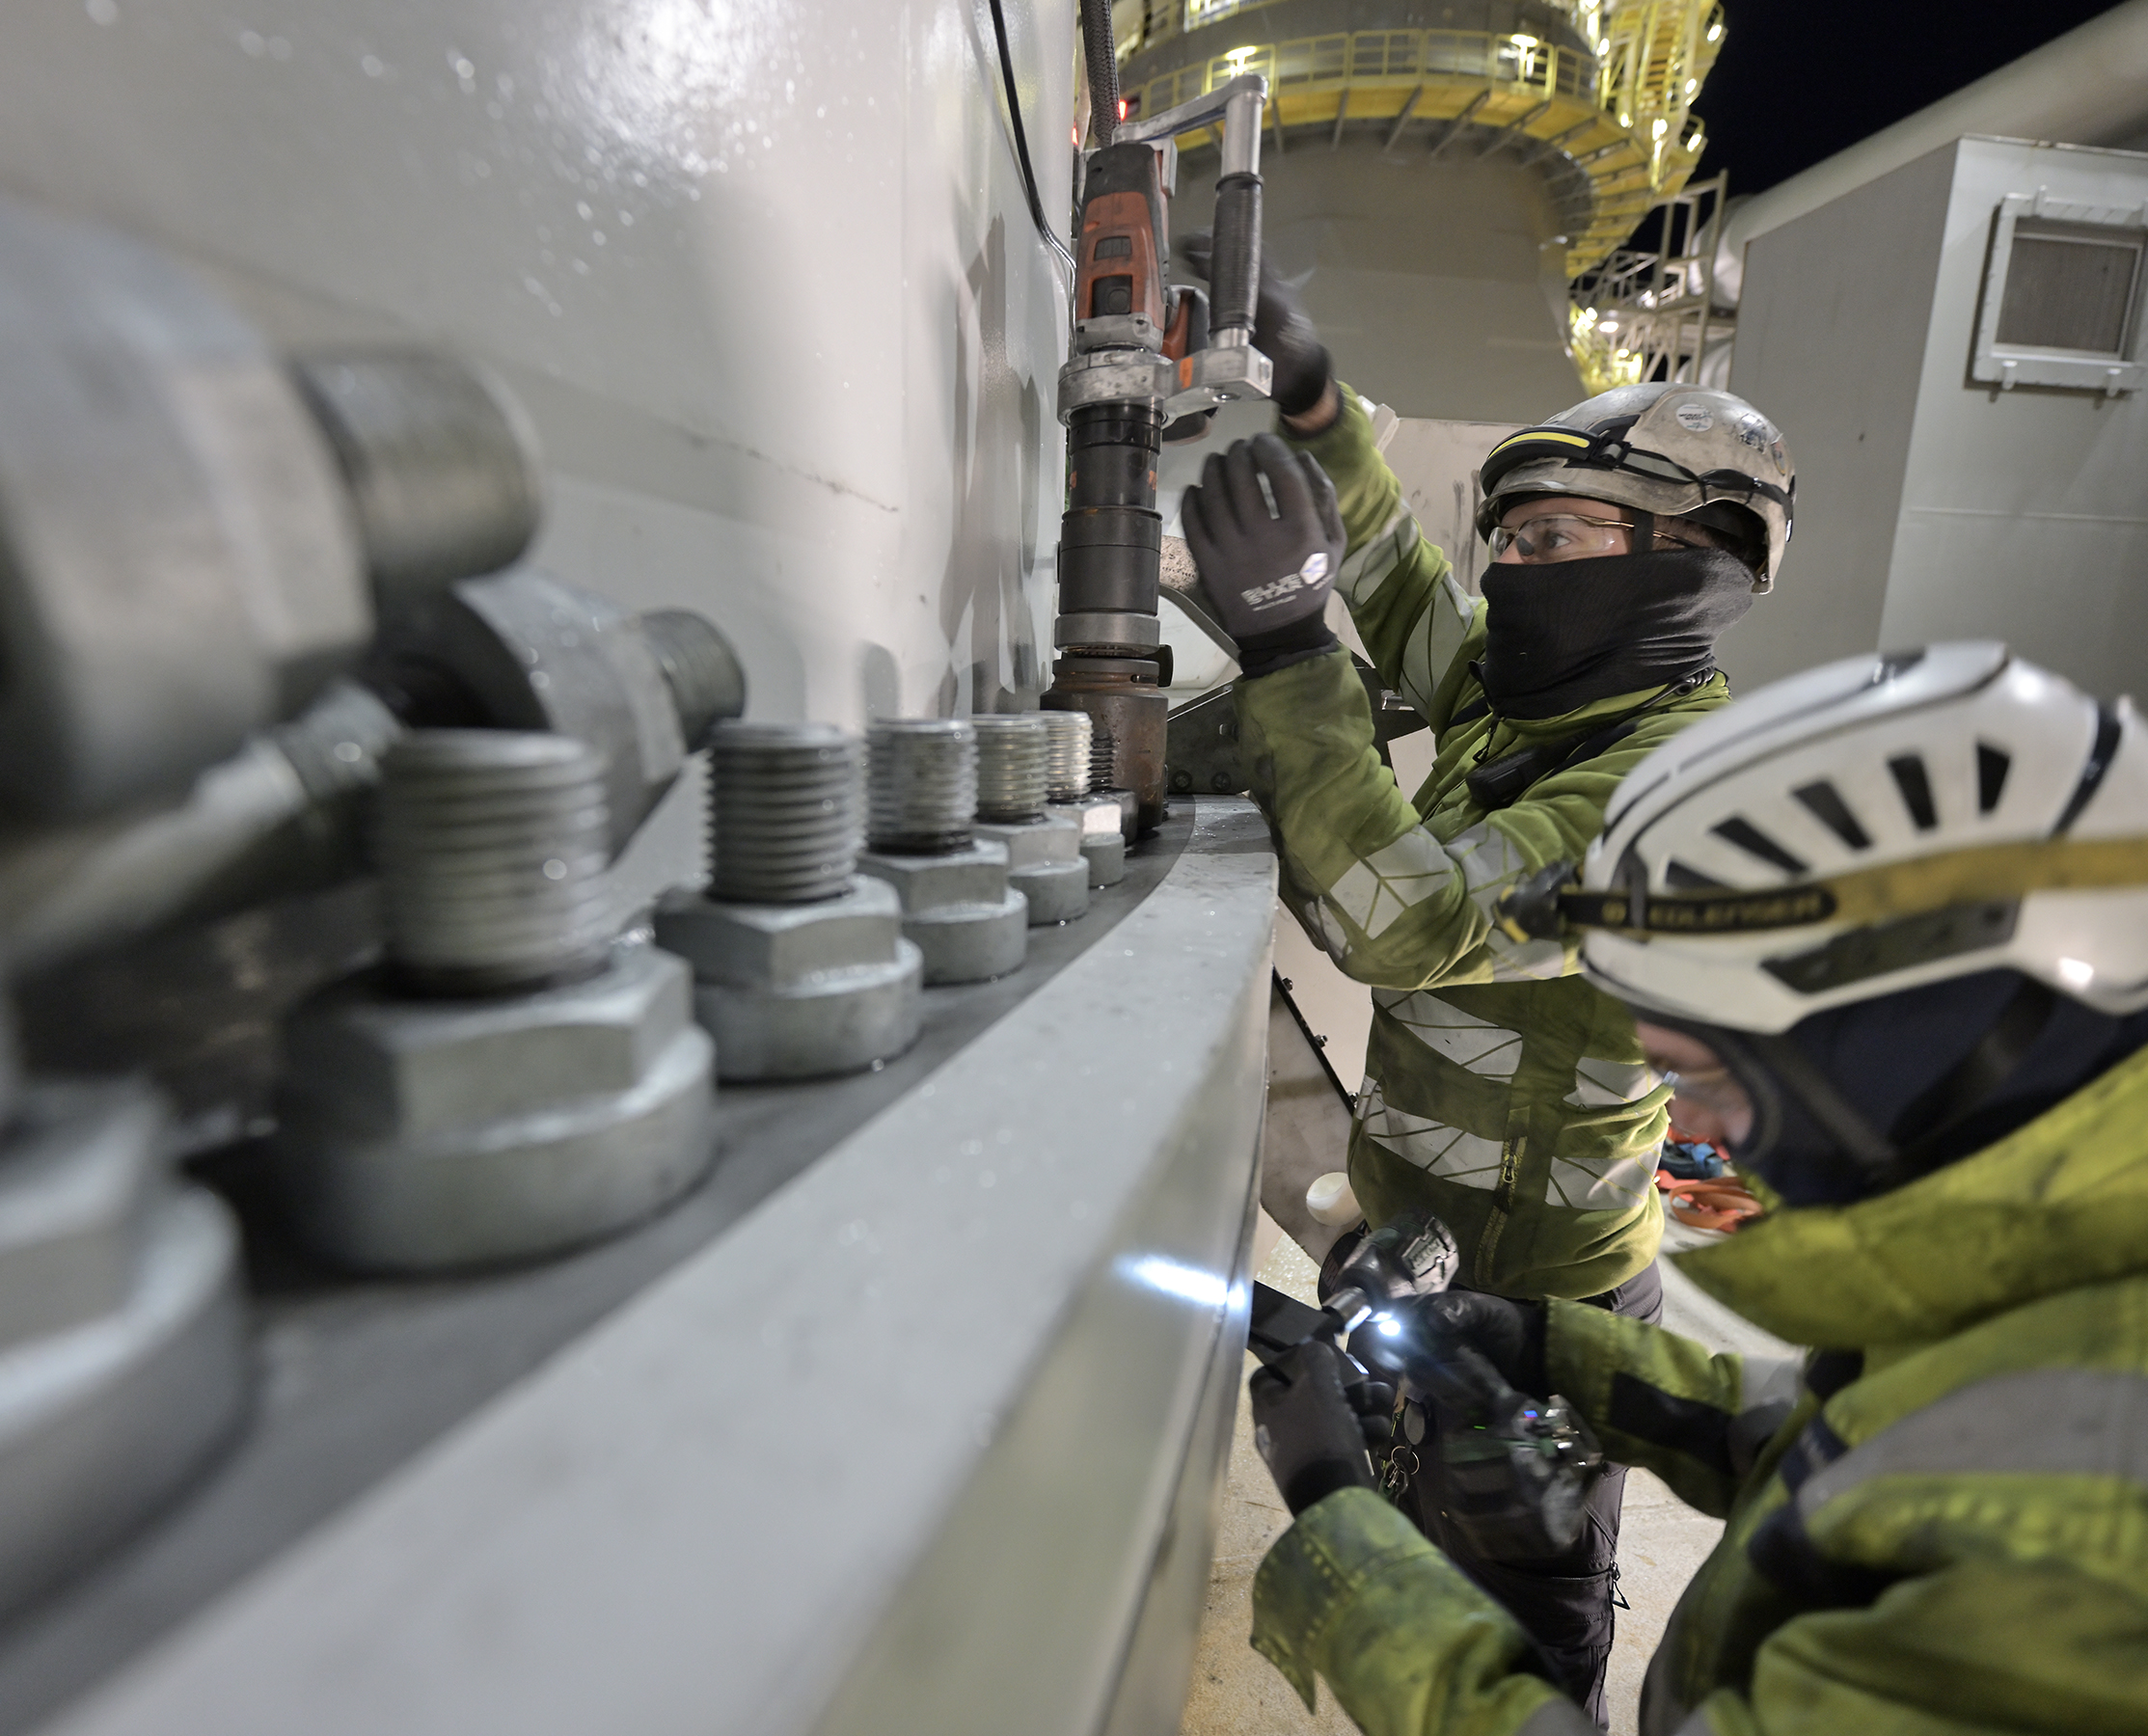
Note 3
Expenses by Nature
Continued from previous page
Auditor remuneration
Administrative expenses include fees to the auditors appointed by the shareholder at the Annual General
Meeting:
EUR'000 | 2025 | 2024 | 2023 |
Statutory audit | 1,748 | 1,930 | 464 |
Tax services | 34 | 201 | — |
Other assurance services | 25 | 9 | 1,608 |
Other services | — | 22 | 606 |
Total | 1,807 | 2,162 | 2,678 |
Statutory audit services consist of fees for professional services rendered by EY for the audit of the Group’s
annual consolidated financial statements, as well as services that are provided by the auditor in connection
with statutory audit.
Tax services consist of tax compliance services.
Other assurance services include re-audits and assurance reports in respect of pro-forma financial
information in connection with regulatory filings in December 2023, as well as reviews of interim financial
information.
Other services consist of permitted non-audit services, including fees for work performed in connection with
the US listing in December 2023.
222
Note 4
Employee Compensation
Onshore - presented within administrative expenses
EUR'000 | Note | 2025 | 2024 | 2023 |
Wages and salaries | 27,003 | 18,233 | 16,671 | |
Employer's contribution to defined contribution plans | 3,345 | 1,338 | 819 | |
Share based payment expense | 6 | 936 | 896 | 1,134 |
Other short-term benefits | 2,122 | 213 | 359 | |
Total onshore employee compensation | 33,406 | 20,680 | 18,983 | |
Average number of full-time employees | 211 | 144 | 105 |
Offshore - presented within cost of sales
EUR'000 | Note | 2025 | 2024 | 2023 |
Wages and salaries | 24,434 | 13,991 | 13,190 | |
Employer's contribution to defined contribution plans | 2,561 | 1,416 | 1,060 | |
Other short-term benefits | 220 | 183 | 170 | |
Total offshore employee compensation | 27,215 | 15,590 | 14,420 | |
Average number of full-time employees | 359 | 200 | 167 |
Total
EUR'000 | Note | 2025 | 2024 | 2023 |
Wages and salaries | 51,437 | 32,224 | 29,861 | |
Employer's contribution to defined contribution plans | 5,906 | 2,754 | 1,879 | |
Share based payment expense | 936 | 896 | 1,134 | |
Other short-term benefits | 2,342 | 396 | 529 | |
Total employee compensation | 60,621 | 36,270 | 33,403 | |
Average number of full-time employees | 570 | 344 | 272 |
223
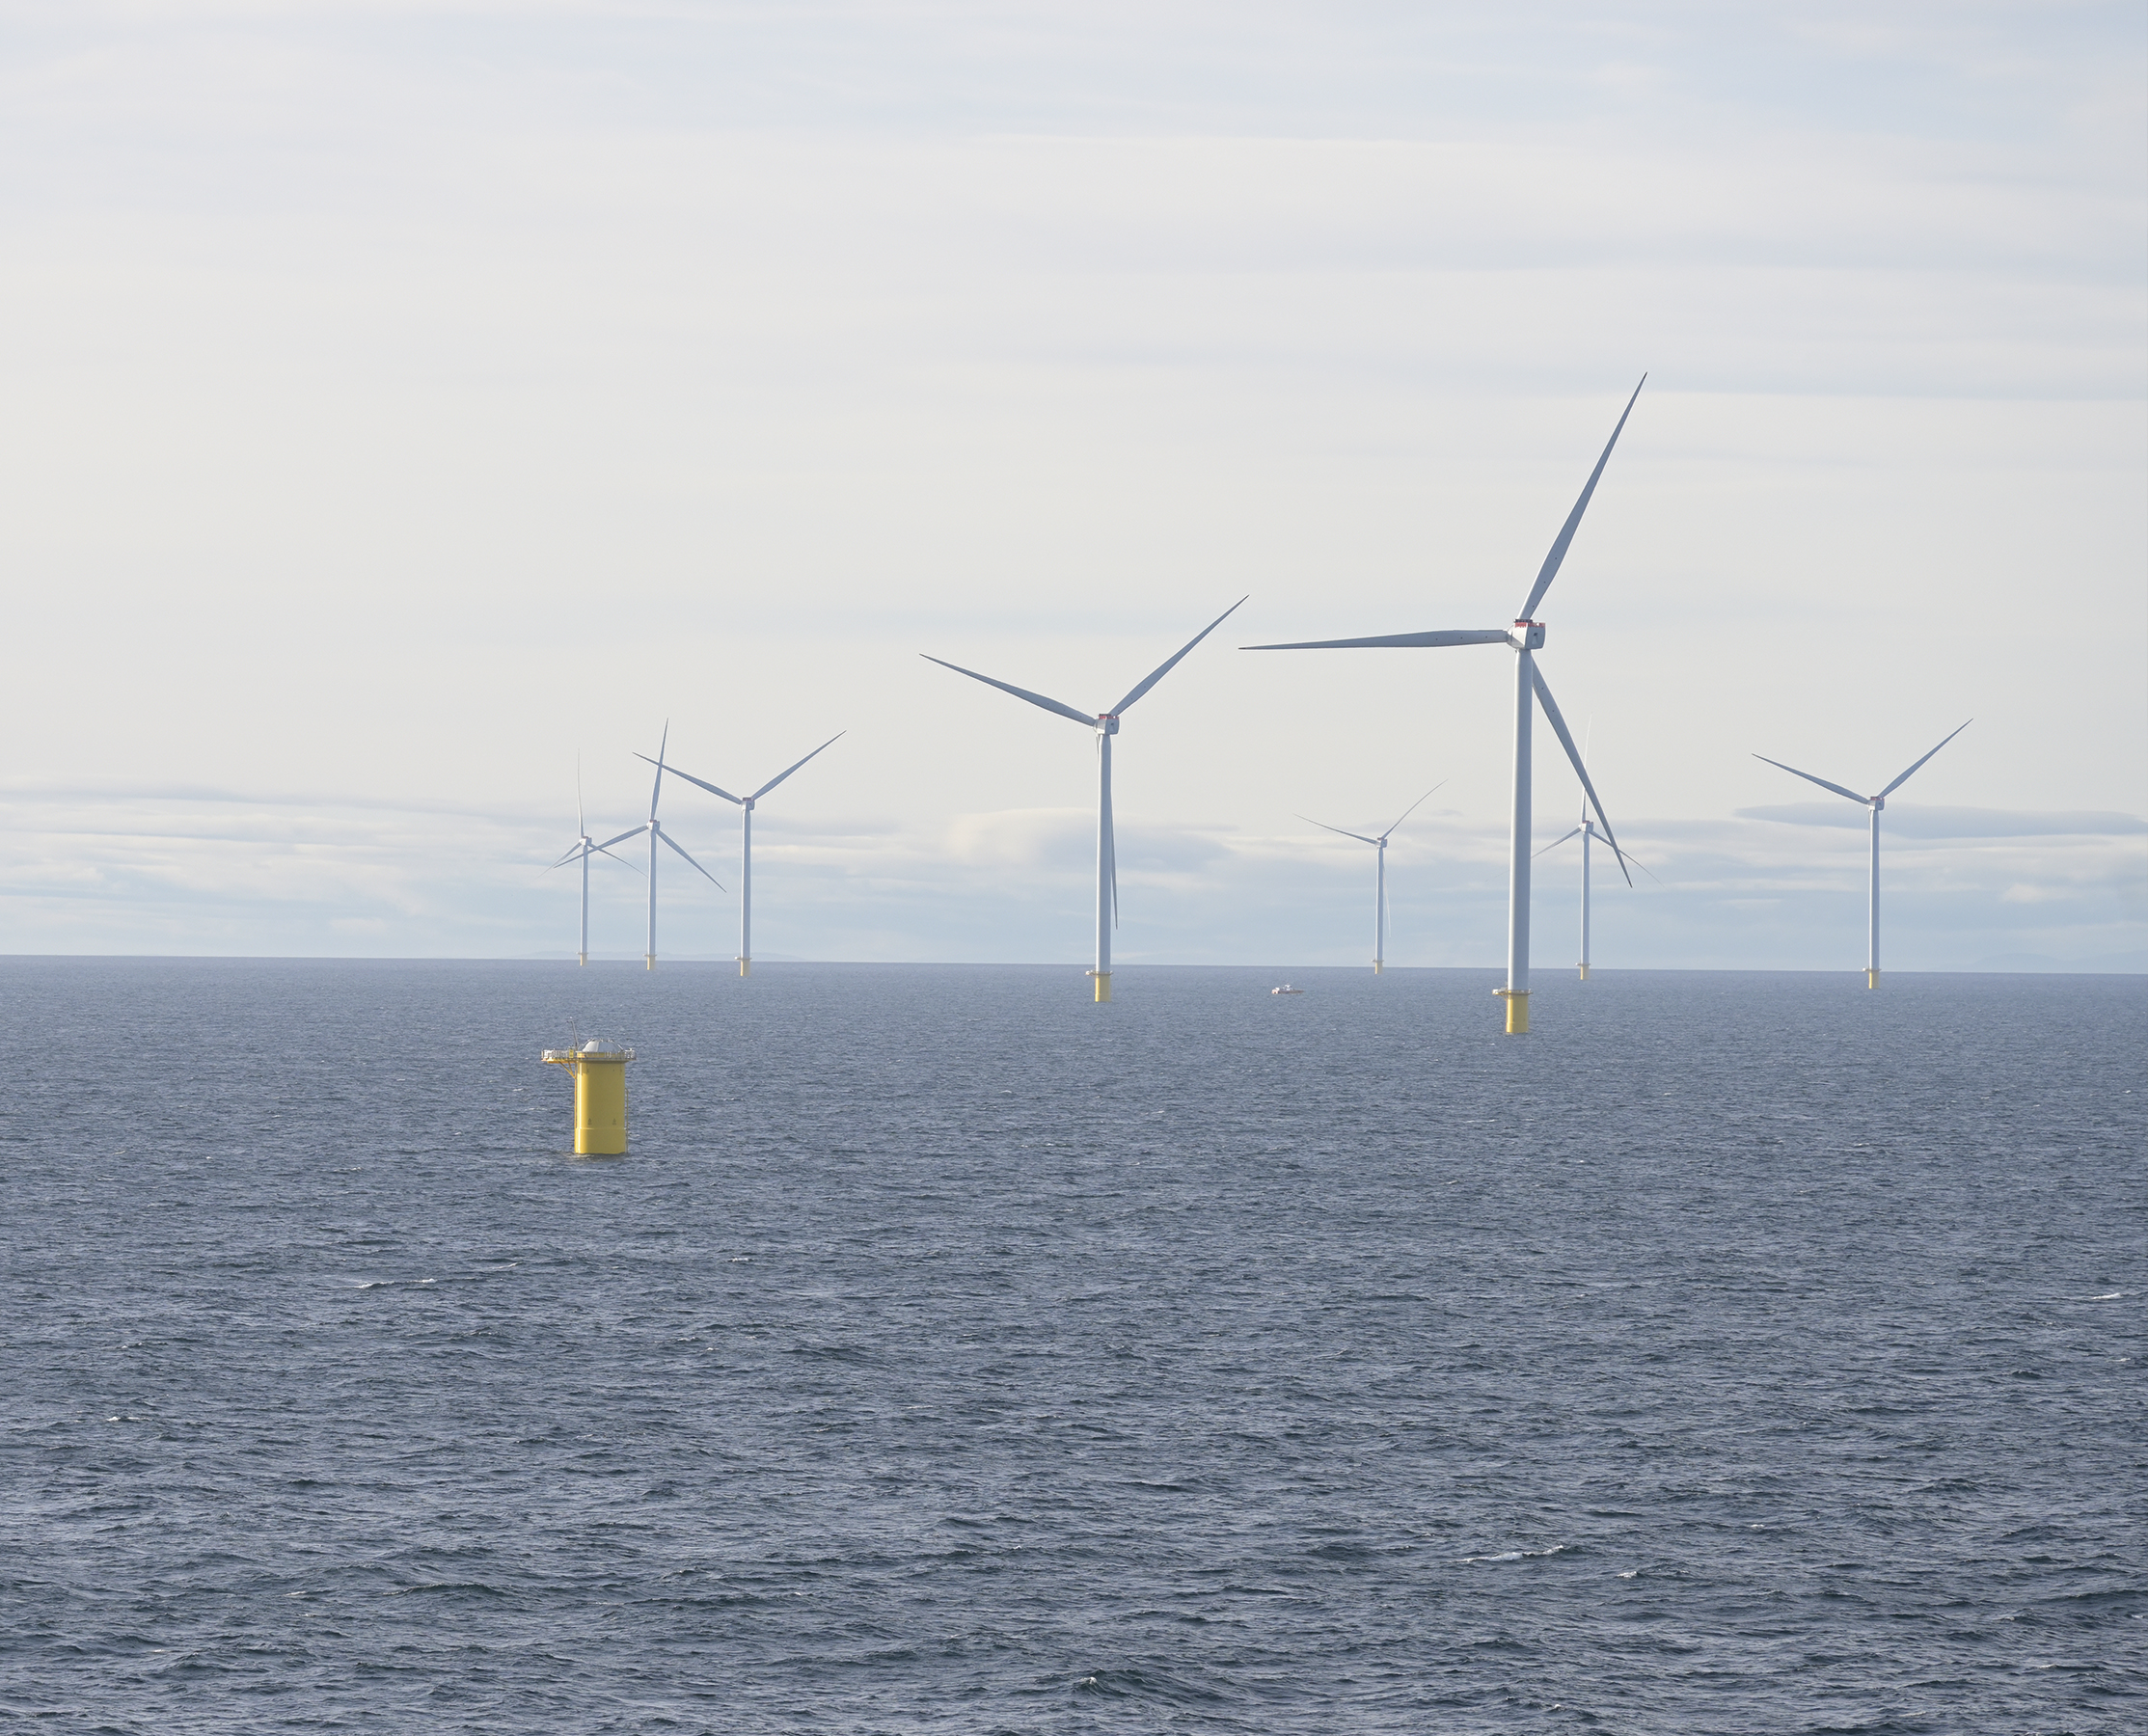
Note 5
Tax
EUR'000 | 2025 | 2024 | 2023 |
Tax expense attributable to profit is made up of: | |||
Adjustment to prior periods - current tax | 1,359 | — | — |
Total | 1,359 | — | — |
An expansion of the Danish Tonnage Tax regime to cover WTIVs was passed in January 2020 with
retroactive effect from 2017, 2017 inclusive.
On 15 December 2020, Cadeler A/S received a binding ruling from the Danish Tax Authorities. According to
this ruling, Cadeler A/S was permitted to apply the Danish Tonnage Taxation following the listing of its
shares on 27 November 2020. Management applied the Danish Tonnage Taxation during 2021. The
recorded tonnage tax expense for 2025 in Denmark amounts to EUR 34 thousand.
Cadeler A/S also has material tax losses from previous periods available for carry forward. Such tax losses
can be utilised against future tonnage taxation income and other income, which does not qualify for
tonnage taxation. The tax value of tax losses for carry forward as of 31 December 2025 is approximately EUR
52.1 million, which has not been recognised for the reasons set out in Note 21 to the consolidated financial
statements. The tax losses are not subject to expiry, but their utilisation is limited on an annual basis.
Tonnage taxes are not accounted for as income tax. Accordingly, the related costs are presented as part of
cost of sales. No tax expense has been recognised in 2025 in relation to Danish Tonnage Tax.
224
Note 6
Board of Directors and Executive Management Compensation
2025 | 2024 | 2023 | |||||||
EUR'000 | Board of directors | Executive management | Total | Board of directors | Executive management | Total | Board of directors | Executive management | Total |
Wages, salaries and board fees | 419 | 998 | 1,417 | 334 | 955 | 1,289 | 183 | 821 | 1,004 |
Pension costs - defined contribution plans | — | 100 | 100 | — | 95 | 95 | — | 29 | 29 |
Share based payment | — | 1,249 | 1,249 | — | 957 | 957 | — | 588 | 588 |
Other short-term benefits | — | 35 | 35 | — | 41 | 41 | — | 55 | 55 |
Cash bonus | — | 2,473 | 2,473 | — | 1,197 | 1,197 | — | 1,155 | 1,155 |
Total management compensation | 419 | 4,855 | 5,274 | 334 | 3,245 | 3,579 | 183 | 2,648 | 2,831 |
225
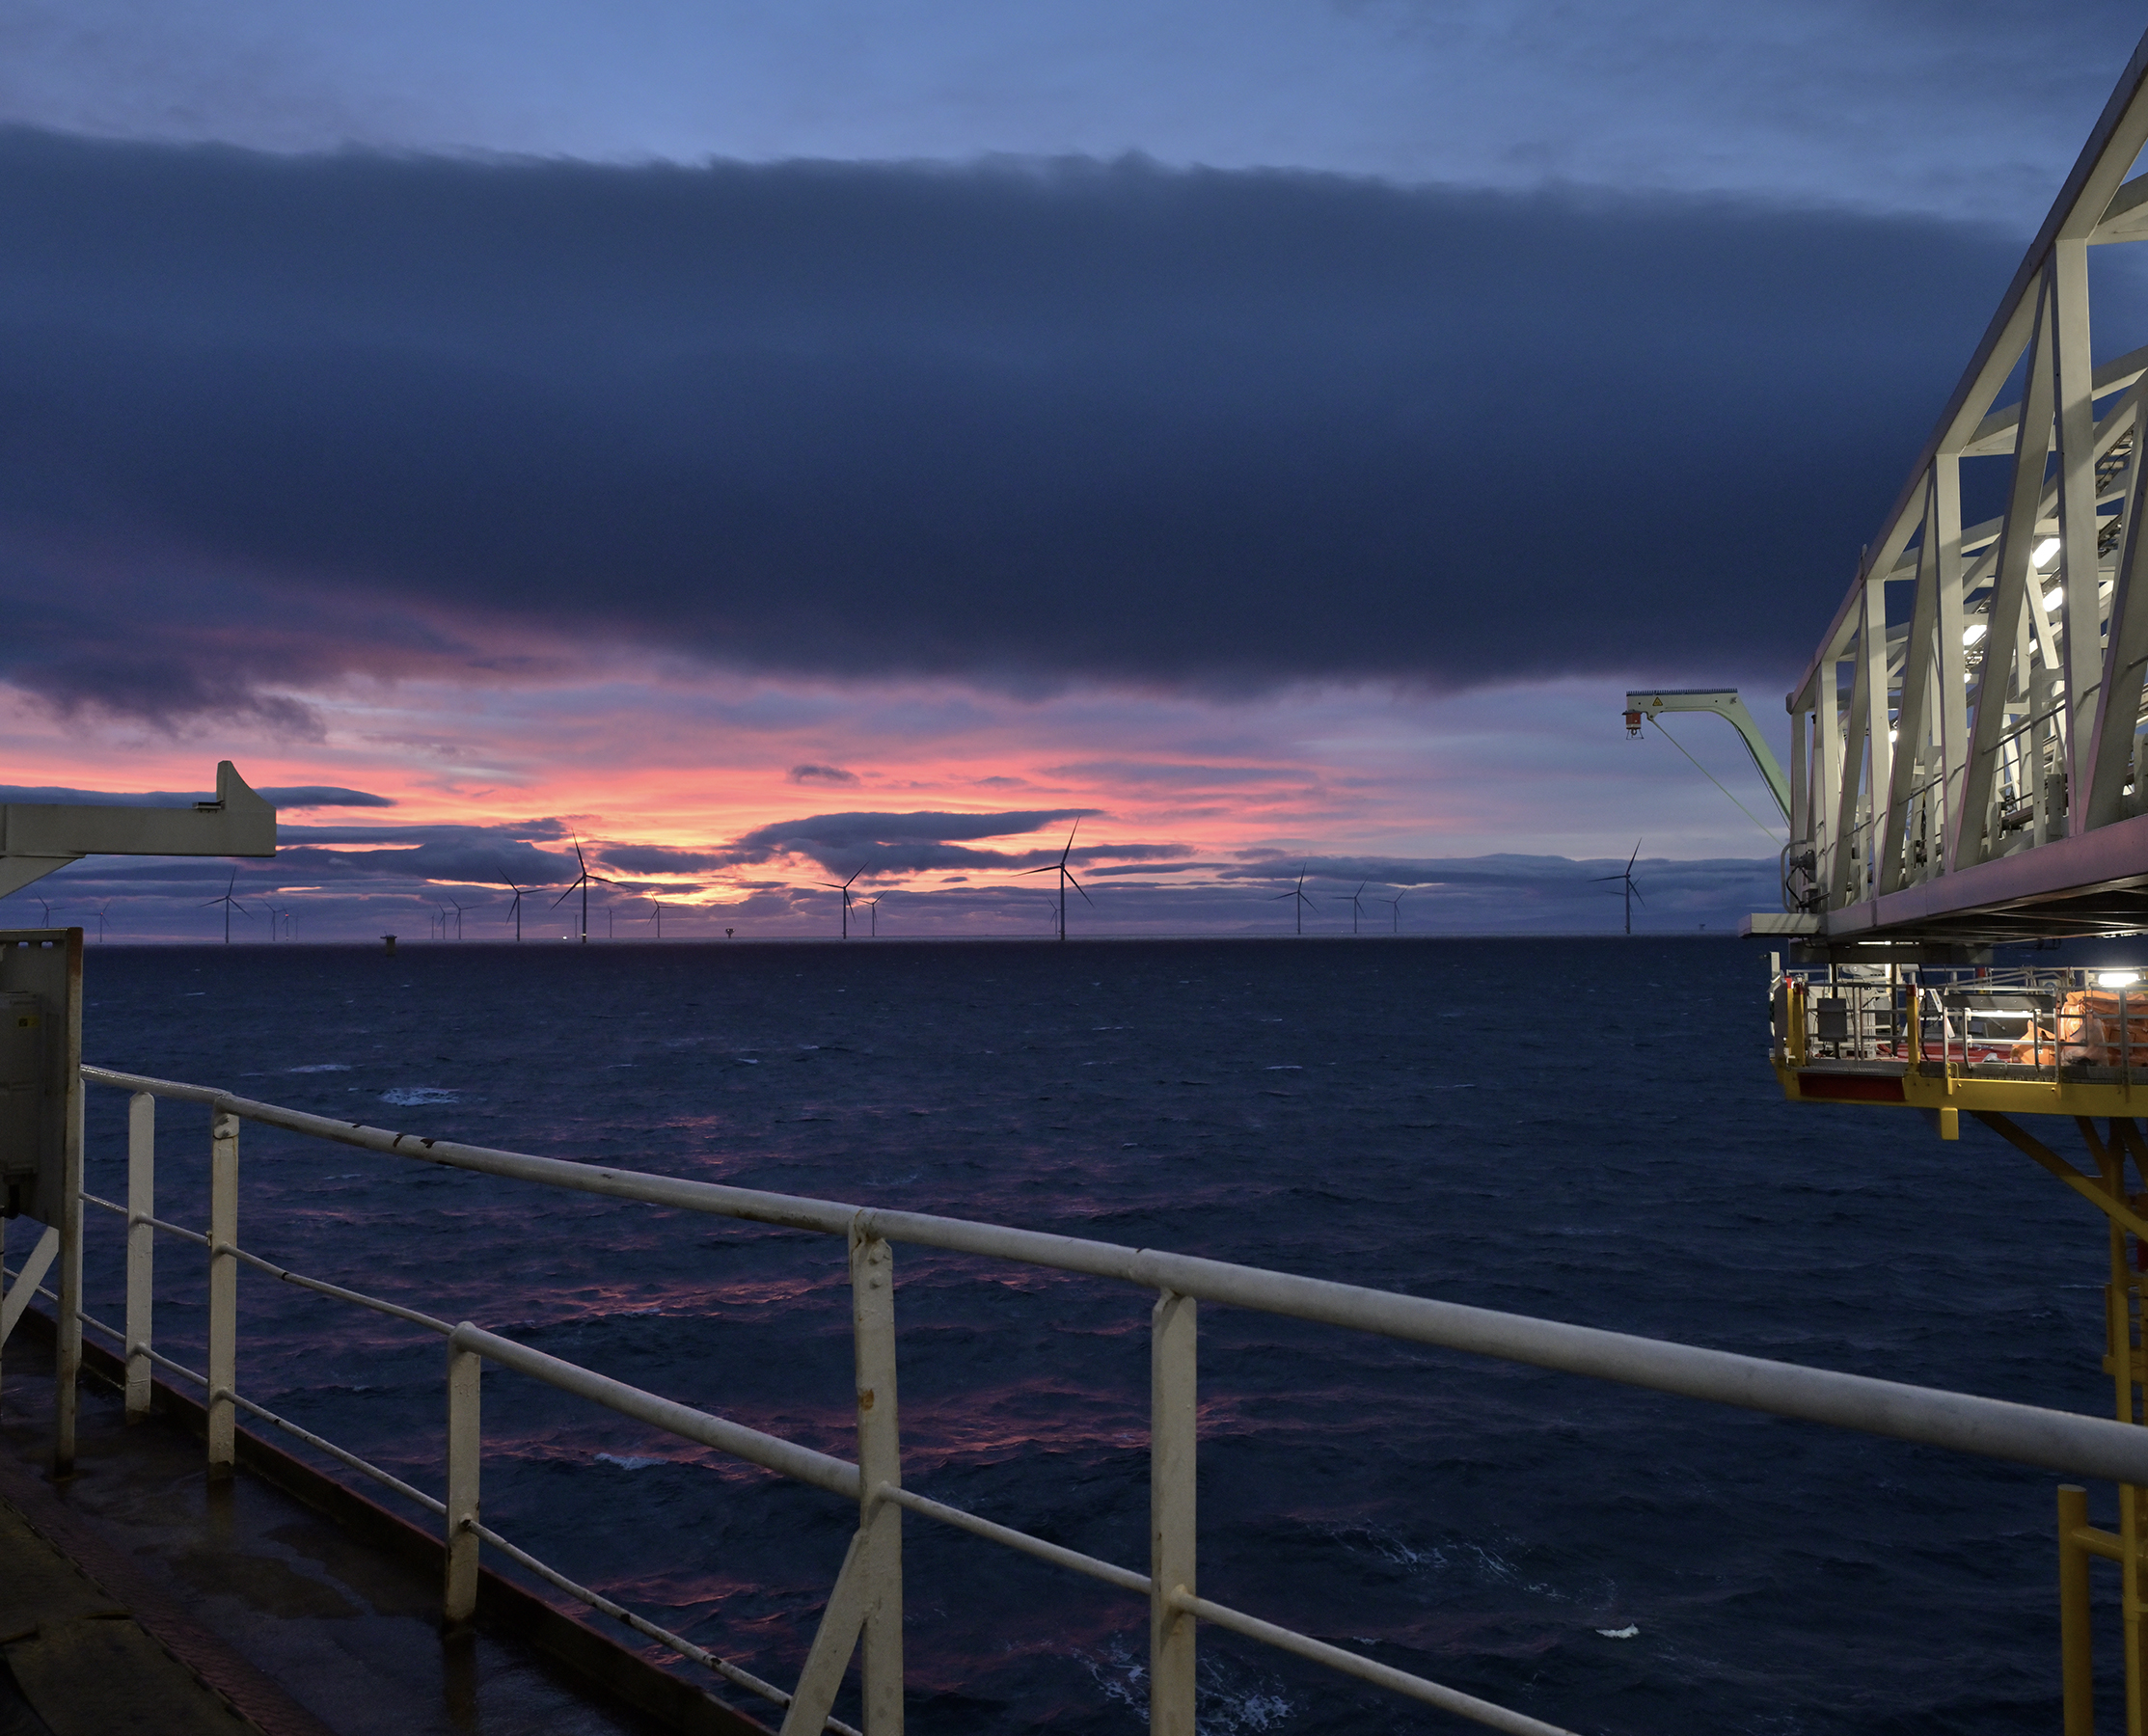
Note 7
Intangible Assets
EUR'000 | 2025 | 2024 | 2023 |
Software | |||
Cost | |||
Beginning of period | 954 | 693 | 662 |
Additions | 906 | 299 | 31 |
Disposals | — | (38) | — |
31 December 2025 | 1,860 | 954 | 693 |
Accumulated amortization | |||
Beginning of period | 642 | 453 | 243 |
Amortization charge | 218 | 189 | 210 |
31 December 2025 | 860 | 642 | 453 |
Carrying amount | 1,000 | 312 | 240 |
Additions during 2025 2024 and 2023: are mainly related to further developments of the Company’s
software solutions.
226
Note 8
Property, Plant and Equipment
EUR'000 | Other fixtures and fittings | Assets under construction | Total |
Cost 2025 | |||
Beginning of financial year | 3,053 | 473,505 | 476,558 |
Additions | 608 | 229,765 | 230,373 |
Disposals | — | (343,660) | (343,660) |
31 December 2025 | 3,661 | 359,610 | 363,271 |
Accumulated depreciation | |||
Beginning of financial year | 926 | — | 926 |
Depreciation charge | 1,097 | — | 1,097 |
Disposals | — | — | — |
31 December 2025 | 2,023 | — | 2,023 |
Net book value | 1,638 | 359,610 | 361,248 |
Additions during 2025 were mainly driven by vessel newbuild and upgrades. Disposals during 2025 were
mainly attributable to the sale of Wind Pace and Wind Ally to their respective subsidiaries, with no gain/loss
recognised due to the recharge taking place at cost. Borrowing costs for 2025 have been capitalised for a
total of EUR 13.1 million (2024: 19.7 million; 2023: EUR 7.1 million). The capitalisation rate used to determine
the amount of borrowing costs to be capitalised is the weighted average interest rate applicable to the
Company’s general borrowings during the reporting period, being 6.05% (2024: 7.6%; 2023: 5.5%).
EUR'000 | Other fixtures and fittings | Assets under construction | Total |
Cost 2024 | |||
Beginning of financial year | 539 | 368,470 | 369,605 |
Additions | 2,820 | 356,095 | 358,915 |
Disposals | (306) | (251,060) | (251,366) |
31 December 2024 | 3,053 | 473,505 | 476,558 |
Accumulated depreciation | |||
Beginning of financial year | 451 | — | 451 |
Depreciation charge | 781 | — | 781 |
Disposals | (306) | — | (306) |
31 December 2024 | 926 | — | 926 |
Net book value | 2,127 | 473,505 | 475,632 |
Additions during 2024 were mainly driven by vessel newbuild and upgrades. Disposals during 2024 were
driven by the sale of Wind Peak to a subsidiary.
227
Note 8
Property, Plant and Equipment
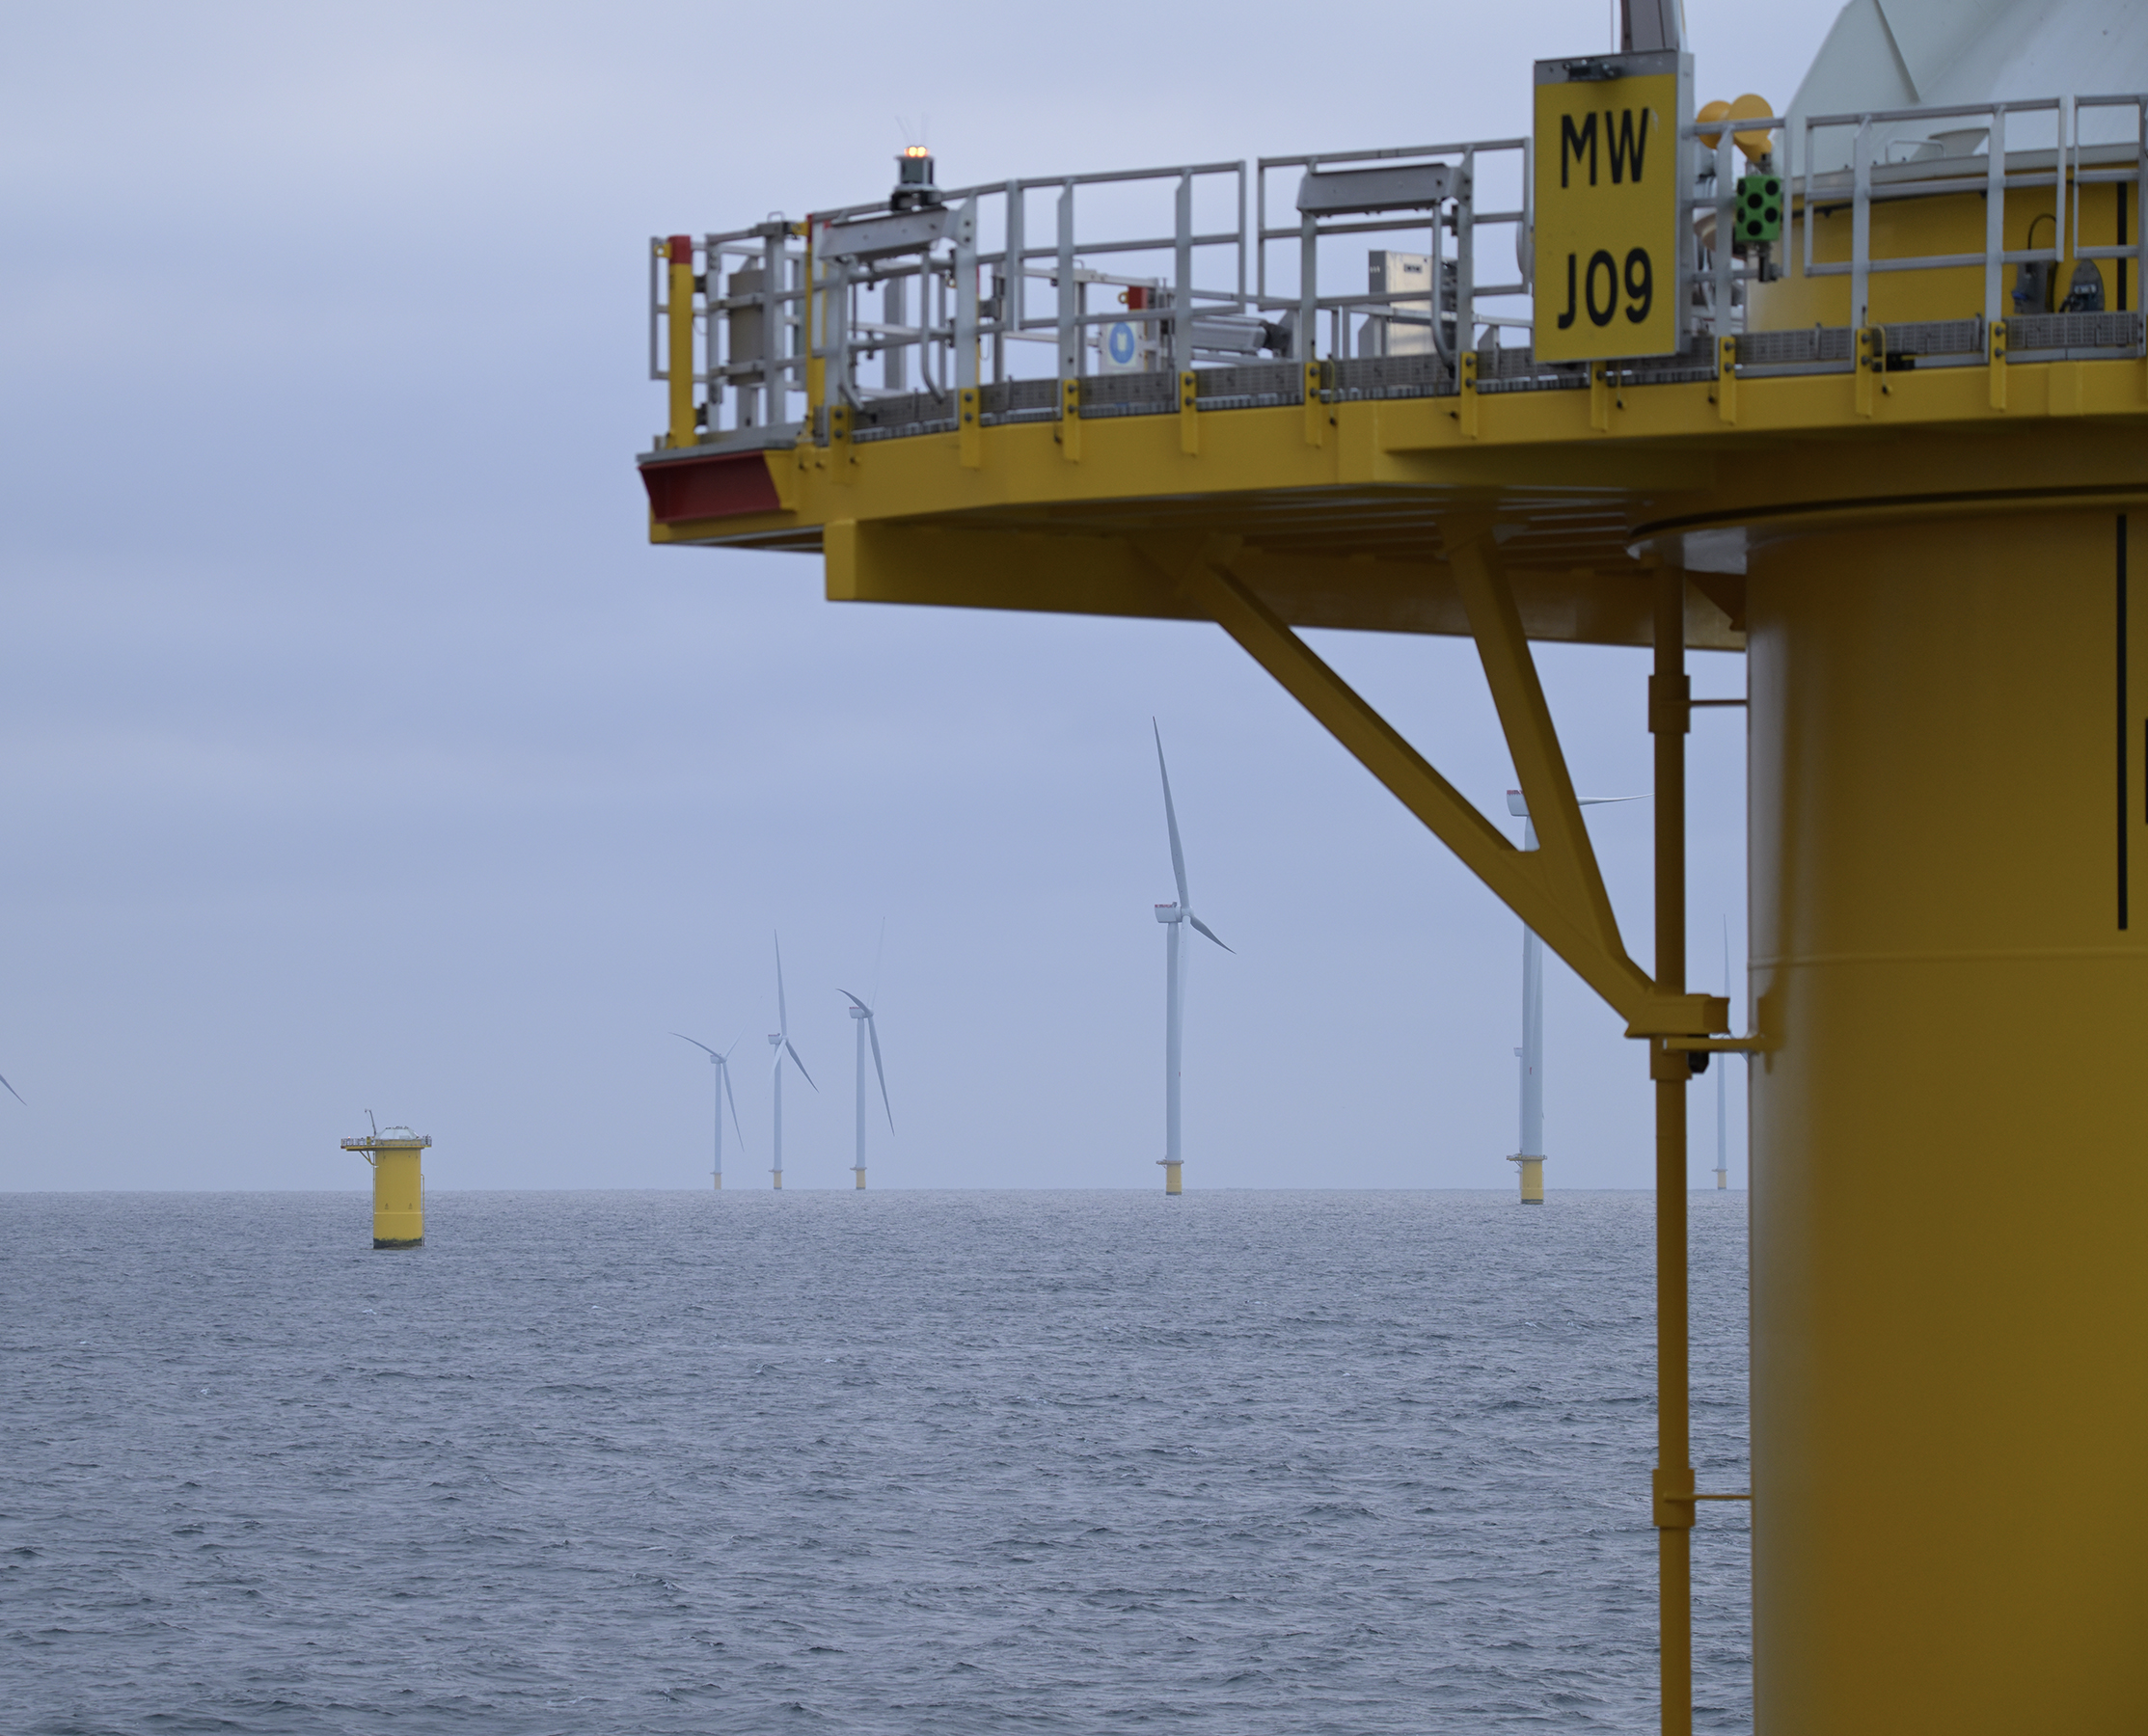
EUR'000 | Other fixtures and fittings | Assets under construction | Total |
Cost 2023 | |||
Beginning of financial year | 536 | 320,964 | 321,500 |
Additions | 3 | 47,506 | 48,105 |
31 December 2023 | 539 | 368,470 | 369,605 |
Accumulated depreciation | |||
Beginning of financial year | 445 | — | 445 |
Depreciation charge | 6 | — | 6 |
31 December 2023 | 451 | — | 451 |
Net book value | 88 | 368,470 | 369,154 |
Additions during 2023 were primarily driven by down payments of EUR 19.2 million relating to the new P-
class installation vessels (EUR 15.4 million) and the new A-class FIVs (EUR 3.8 million), which are represented
above as assets under construction. In addition, assets under construction include EUR 7.6 million in
guarantee fees payable to BW Group related to the A-class and P-class newbuild vessels as well as EUR 2.2
million relating to assets associated with future projects that have not yet commenced.
Borrowing costs for 2023 have been capitalised in the amount of EUR 7.1 million (2023: EUR 4.2 million). The
capitalisation rate applied to determine the amount of borrowing costs eligible for capitalisation is the
weighted average interest rate applicable to the Company’s general borrowings during the reporting
period, being 5.5%.
228
Note 9
Investment in Subsidiaries
Shown below are movements related to investments in subsidiaries:
EUR'000 | 2025 | 2024 | 2023 |
Cost | |||
Beginning of financial year | 745,489 | 745,489 | 249,534 |
Additions | 360,056 | — | 495,955 |
End of financial year | 1,105,545 | 745,489 | 745,489 |
Impairment | |||
Beginning of financial year | — | — | — |
End of financial year | — | — | — |
Carrying amount | 1,105,545 | 745,489 | 745,489 |
The list of subsidiaries is presented in Note 29 of the Consolidated Financial Statements.
In 2023, an additional EUR 496 million relates to a business combination, pursuant to which Cadeler A/S
acquired 100% of the shares in Eneti through a share exchange.
The shares were recognised at a cost price of EUR 496 million, including acquisition-related expenses
amounting to EUR 15 million. This cost consists of the fair value of shares issued, amounting to EUR 441
million, and a squeeze-out payment of EUR 55 million.
All transaction costs incurred have been included in the cost, which differs from the presentation in the
Consolidated Financial Statements, where some transaction costs are expensed, while others are deducted
from equity.
Further details regarding the issuance of shares in connection with the business combination are disclosed
in Note 14.
As of 31 December 2025, management has not identified any indicators of impairment. Accordingly, no
impairment has been recognised. The carrying amount of investments in subsidiaries is subject to
impairment testing if impairment indicators are identified.
Note 10
Share-based Payments
Share-based payments are disclosed in Note 7 to the Consolidated Financial Statements.
Note 11
Derivatives
Derivative Financial Instruments are disclosed in Note 24 to the Consolidated Financial Statements. Not all
derivatives are entered into by the Parent Company, as derivative liabilities of EUR 8.4 million and derivative
assets of EUR 2.1 million are entered into by subsidiaries. Derivatives are measured at Level 2 in the fair value
hierarchy. As of 31 December 2025, the fair value of the derivative assets amounts to EUR 2,640 thousand
(2024: EUR 9.7 million; 2023: EUR 338 thousand) and derivative liabilities amount to EUR 13.7 million (2024:
EUR 12.9 million; 2023: EUR 22 million). Derivatives in the parent Company primarily relate to interest rate
swap contracts and FX forward contract, for which further details are provided in note 24 to the
consolidated financial statements.
Note 12
Debt to credit institutions
The total amount of utilised debt, amounting to EUR 468 million, is due within 5 years.
229
Note 13
Off-Balance Sheet Obligations and Commitments
The Company has off-balance sheet obligations relating to the leasing of vessels from its subsidiaries Wind
Orca Ltd, Wind Osprey Ltd., Wind Peak Ltd, Wind Pace Ltd, and Wind Ally Ltd. The off-balance sheet
obligations relating to the vessels are estimated to amount to up to EUR 208.9 million, depending on the
number of days the vessels are on hire. Moreover, the Company has concluded customary bilateral
agreements in the ordinary course of business of the Company.
Additionally, the Company’s has off-balance sheet commitments related to the lease of third-party vessels
related to T&I activities. The off-balance sheet obligations relating to these vessel is estimated to amount to
up to EUR 16.3 million.
The Company has issued performance and payment guarantees through its banking partners in favour of
customers and suppliers in connection with offshore wind installation projects. At 31 December 2025,
outstanding guarantees totalled EUR 201 million. The guarantees relate to the Group’s contractual
performance and payment obligations. No provision has been recognised, as management assesses that an
outflow of resources is not probable. The Company would be required to reimburse the issuing bank should
any guarantee be called.
P-class vessels
Since 30 June 2021, the Company has a contract with COSCO to build two new P-class WTIVs. On 14 August
2024, Wind Peak was delivered and the final instalments were paid upon delivery. On 26 March 2025, Wind
Pace was delivered with the final instalments also paid upon delivery.
A-class vessels
On 9 May 2022 and 22 November 2022, the Company signed contracts with COSCO to build a total of two
new A-class FIVs. In May 2024, the Company signed an additional contract with COSCO to build the third A-
class FIV. On 29 September 2025, Wind Ally was delivered with the final instalments paid upon delivery.
The total contract value for the new vessels amounts to approximately EUR 1.0 billion, of which
approximately EUR 167 million was paid in 2022 EUR 94 million was paid in 2024 and EUR 257 million was
paid in 2025. The remaining amounts will fall due in the period from 2026 to 2027.
Of the total contract value, USD 794 million is payable in USD and EUR 299 million is payable in EUR.
Further information regarding the remaining instalments for the newbuild vessels is provided in Note 28 to
the Consolidated Financial Statements.
Financial liabilities: Interest-bearing loans and borrowings
Terms and covenants relating to the Debt Facilities are disclosed in Note 25 to the Consolidated Financial
Statements.
230
Note 14
Issued Share Capital
EUR'000 | No. of shares (in thousands) | Total |
Beginning of financial year 2023 | 197,600 | 26,575 |
First issue for capital increase 2023 | 113,809 | 15,264 |
Second issue for capital increase 2023 | — | — |
End of financial year 2023 | 311,409 | 41,839 |
First issue for capital increase 2024 | 39,520 | 5,301 |
Second issue for capital increase 2024 | 28 | 4 |
End of financial year 2024 | 350,957 | 47,144 |
End of financial year 2025 | 350,957 | 47,144 |
As of 31 December 2025, the Group had share capital amounting to DKK 350,958 thousand, equal
to EUR 47,143 thousand, consisting of 350,957,583 shares of nominal DKK 1 each.
All shares carry equal rights.
Treasury shares
On 30 May 2025, the Company completed a share buy-back programme to fulfil share based incentive
obligations resulting in the repurchase of 395,200 shares of a nominal value of DKK 1 each at an average
price of NOK 49.90, corresponding to an aggregate amount of EUR 1.7 million, including commission.
On 31 December 2025, the Company held 89,992 treasury shares.
Note 15
Related Parties
Cadeler A/S’ related party transactions include revenue from the subsidiaries of EUR 7.4 million relating to
the management and maintenance of vessels during off-hire periods as well as operating lease expenses
paid to the subsidiaries of EUR 134.6 million relating to vessels during on-hire periods. Furthermore,
receivables from subsidiaries of EUR 173.2 million are recognised.
Cadeler A/S’ related parties comprise its subsidiaries, as listed in Note 9, all of which are wholly owned by
the Company.
Cadeler A/S also engages in related party transactions, as disclosed in Note 27 to the Consolidated
Financial Statements, excluding transactions related to Scorpio Holdings that were not entered into by the
parent company.
Note 16
Appropriation of Profit and Loss
EUR'000 | 2025 | 2024 | 2023 |
Recommended appropriation of profit and loss | |||
Retained earnings/accumulated loss | 114,139 | 19,812 | 11,348 |
114,139 | 19,812 | 11,348 |
231
Note 17
Events After Reporting Period
Management has evaluated events and transactions occurring after
the balance sheet date through the date the financial statements
were available to be issued. Based on this evaluation, there were no
subsequent events identified that require adjustment to or disclosure
in the accompanying financial statements.
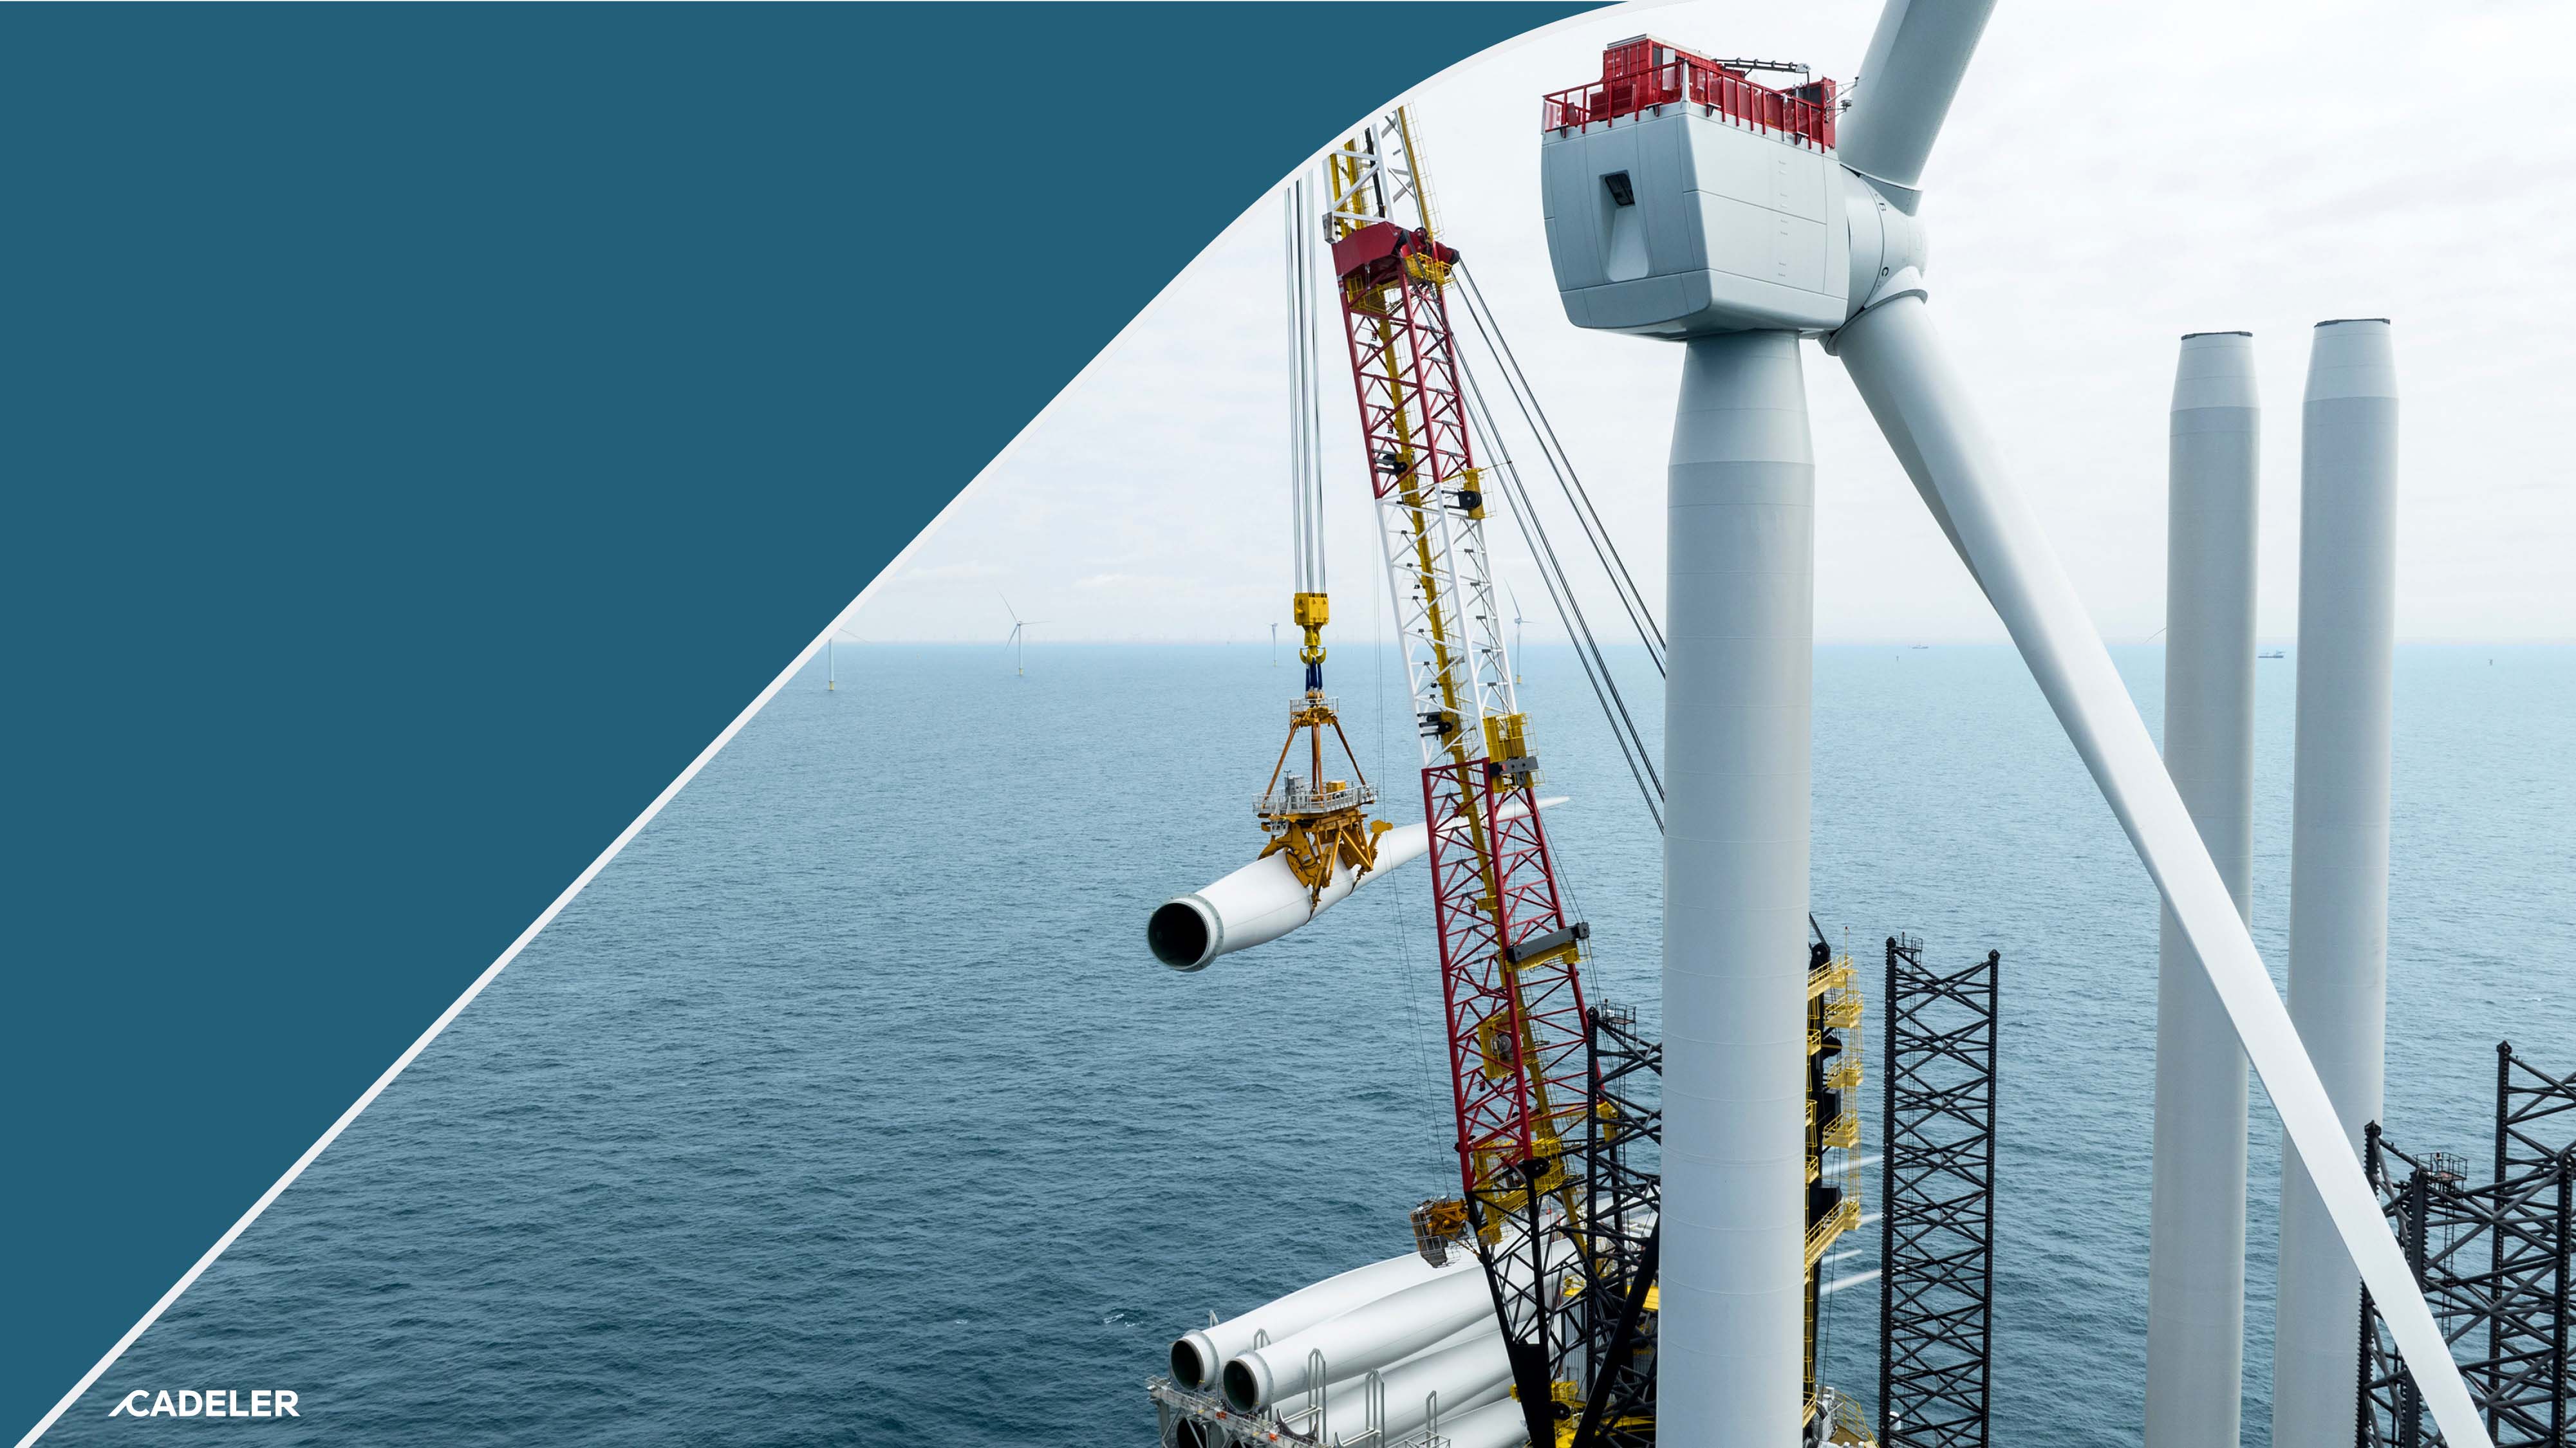
232
Statement by
Management
233
Statement by Management
The Board of Directors and the Executive Board have today discussed
and approved the annual report of Cadeler A/S for 2025.
The consolidated financial statements have been prepared in
accordance with IFRS Accounting Standards as adopted by the EU
and as issued by the International Accounting Standards Board
(IASB), and with additional disclosure requirements in the Danish
Financial Statements Act. The Parent Company financial statements
have been prepared in accordance with the Danish Financial
Statements Act.
In our opinion, the consolidated financial statements and the Parent
Company financial statements give a true and fair view of the
financial position of the Group and the Parent Company as of
31 December 2025 and of the results of their operations and the
consolidated cash flows for the financial year 1 January to
31 December 2025
In connection with digital filing under the ESEF Regulation, in our
opinion, the Annual Report for the financial year ended 31 December
2025, has been prepared in all material respects in compliance with
the ESEF Regulation.
The sustainability statement has been prepared in accordance with
the ESRS as required by the Danish Financial Statements Act section
99a as well as Article 8 of the EU Taxonomy Regulation.
Further, in our opinion, the Management's review gives a fair review
of the development of the Group's and the Parent Company's
activities and financial matters, results for the year, consolidated cash
flows and financial position as well as a description of material risks
and uncertainties that the Group and the Parent Company face.
We recommend that the Annual Report be approved at the annual
general meeting.
Copenhagen, 24 March 2026
Executive Management
Mikkel Gleerup CEO | Peter Brogaard Hansen CFO |
Board of Directors
Andreas Sohmen-Pao
Emanuele Lauro
Ditlev Wedell-Wedellsborg
Andrea Abt
James B. Nish
Colette Cohen
Thomas Thune Andersen
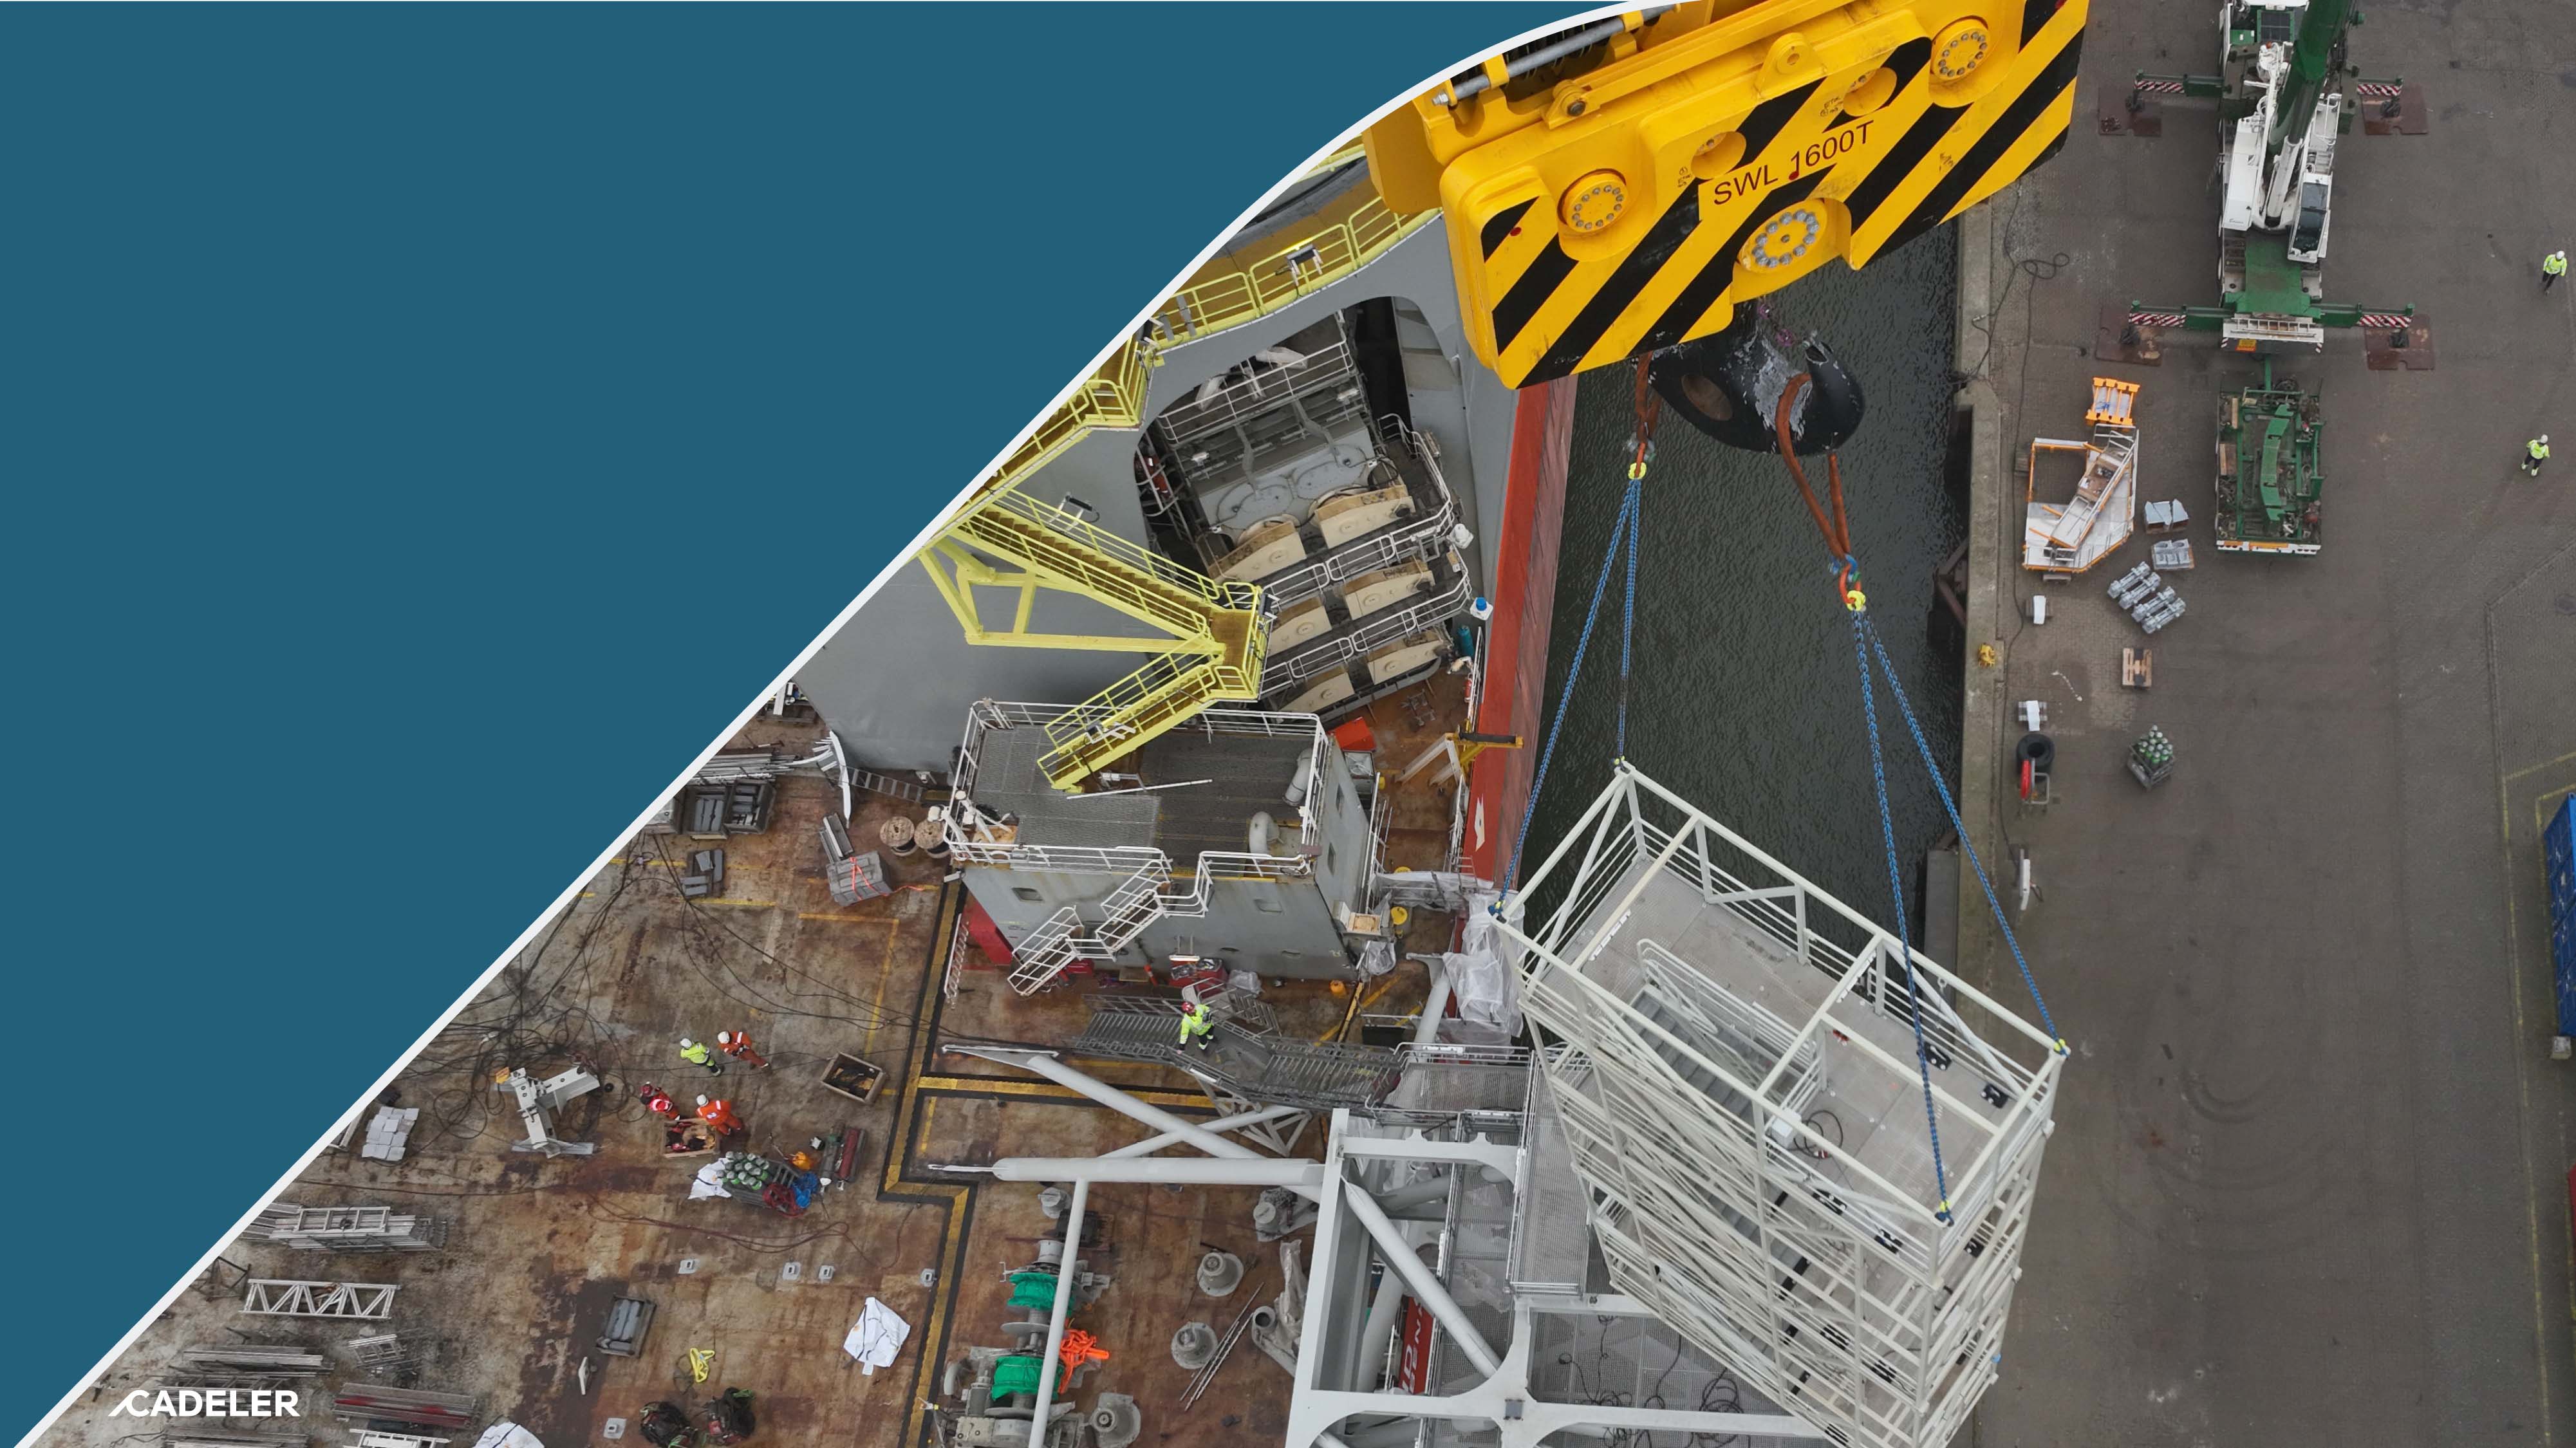
234
Independent
Auditor's
Reports
235
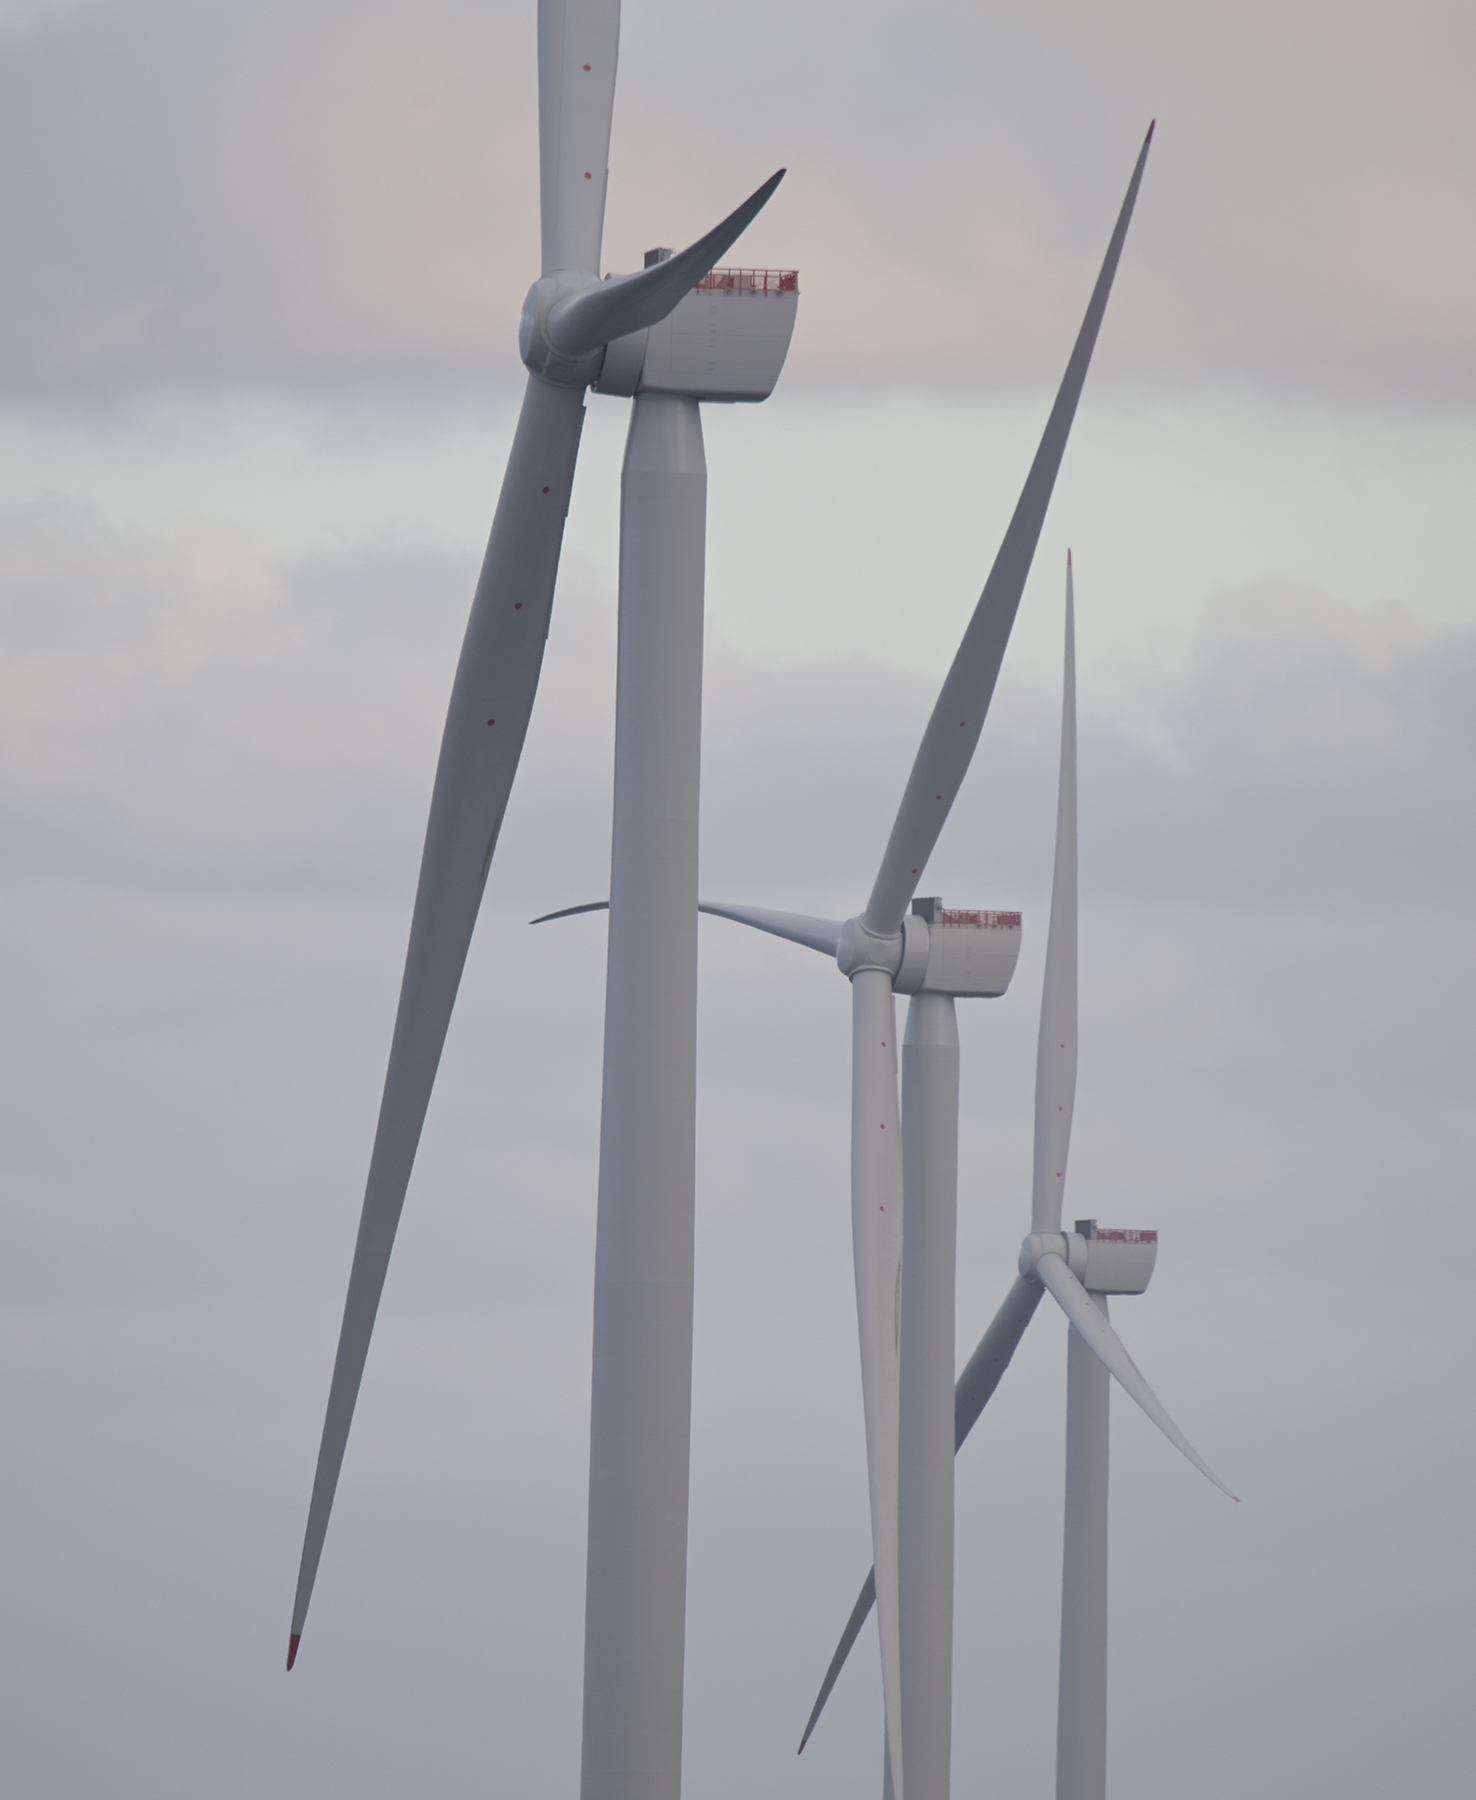
Independent Auditor's Reports
Independent Auditor’s report
To the shareholders of Cadeler A/S
Report on the audit of the Consolidated Financial Statements and
Parent Company Financial Statements
Opinion
We have audited the consolidated financial statements and the
parent company financial statements of Cadeler A/S for the financial
year 1 January – 31 December 2025, which comprise balance sheet,
statement of changes in equity and notes, including material
accounting policy information, for the Group and the Parent
Company, a consolidated statement of profit and loss and other
comprehensive income and a consolidated statement of cash flow for
the Group, and a statement of profit and loss for the Parent
Company. The consolidated financial statements are prepared in
accordance with IFRS Accounting Standards as issued by the IASB
and as adopted by the EU and additional requirements of the Danish
Financial Statements Act, and the parent company financial
statements are prepared in accordance with the Danish Financial
Statements Act.
In our opinion, the consolidated financial statements give a true and
fair view of the financial position of the Group at 31 December 2025
and of the results of the Group's operations and cash flows for the
financial year 1 January – 31 December 2025 in accordance with IFRS
Accounting Standards as issued by the IASB and as adopted by the
EU and additional requirements of the Danish Financial Statements
Act.
Further, in our opinion the parent company financial statements give
a true and fair view of the financial position of the Parent Company at
31 December 2025 and of the results of the Parent Company's
operations for the financial year 1 January – 31 December 2025 in
accordance with the Danish Financial Statements Act.
Our opinion is consistent with our long-form audit report to the Audit
Committee and the Board of Directors.
Basis for opinion
We conducted our audit in accordance with International Standards
on Auditing (ISAs) and additional requirements applicable in
Denmark. Our responsibilities under those standards and
requirements are further described in the "Auditor's responsibilities
for the audit of the consolidated financial statements and the parent
company financial statements" (hereinafter collectively referred to as
"the financial statements") section of our report. We believe that the
audit evidence we have obtained is sufficient and appropriate to
provide a basis for our opinion.
Independence
We are independent of the Group in accordance with the
International Ethics Standards Board for Accountants' International
Code of Ethics for Professional Accountants (IESBA Code), as
applicable to audits of financial statements of public interest entities,
and the additional ethical requirements applicable in Denmark to
audits of financial statements of public interest entities. We have also
fulfilled our other ethical responsibilities in accordance with these
requirements and the IESBA Code.
To the best of our knowledge, we have not provided any prohibited
non-audit services as described in article 5(1) of Regulation (EU) no.
537/2014.
236
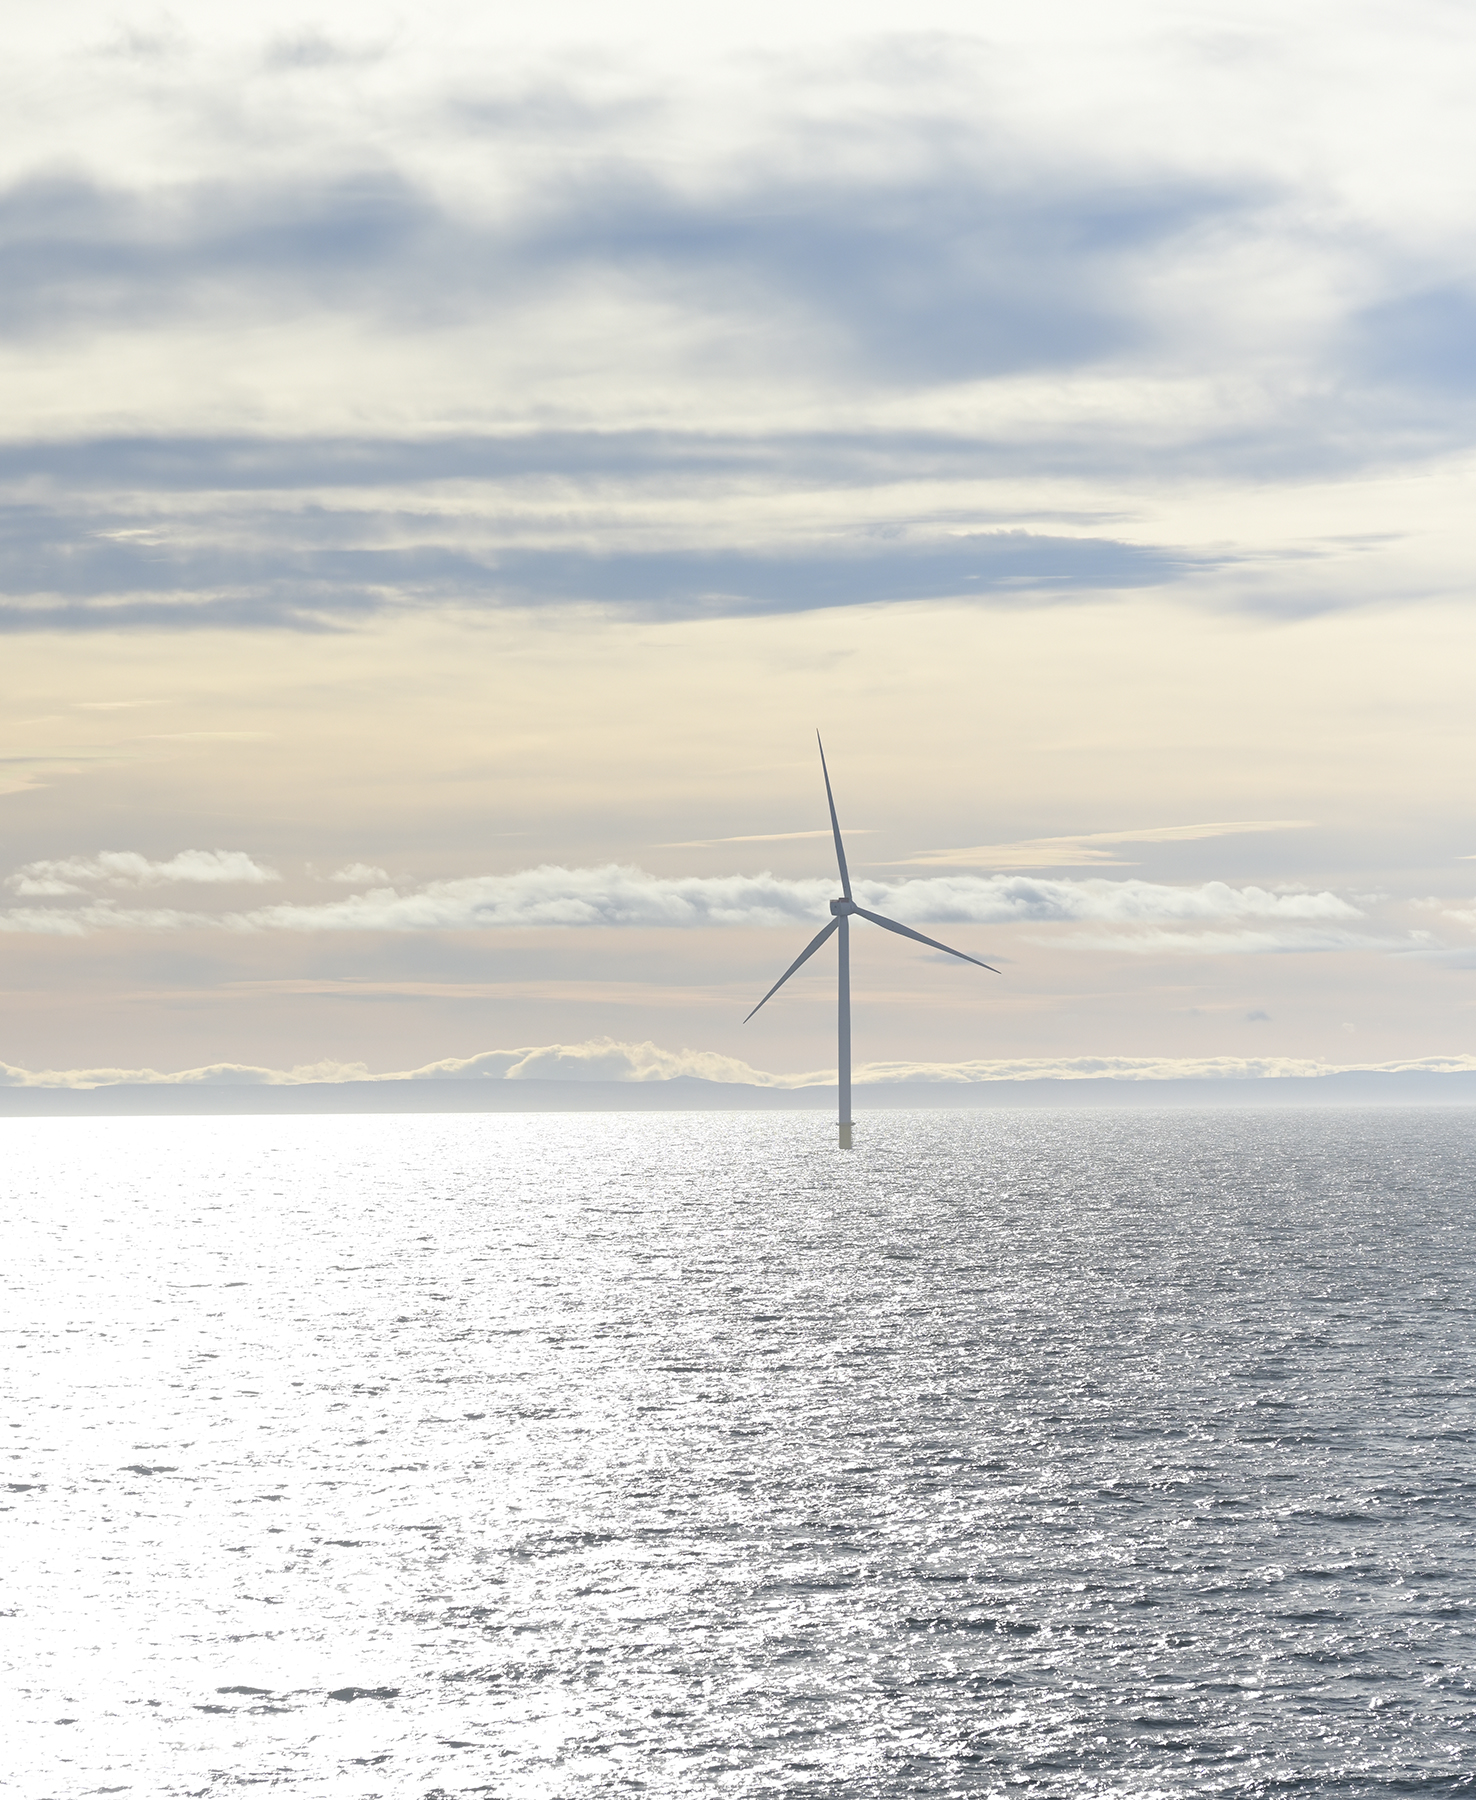
Independent Auditor's Reports
Continued from previous page
Appointment of auditor
Cadeler A/S’ shares were initially listed on Nasdaq Oslo in November
2020. Subsequent to the listing, we were appointed by resolution of
the general meeting held on 29 April 2021 for the financial year 2021
and since the listing, we have been reappointed annually by
resolution of the general meeting for a total consecutive period of 5
years up until the financial year 2025.
Key audit matters
Key audit matters are those matters that, in our professional
judgement, were of most significance in our audit of the financial
statements for the financial year 2025. These matters were addressed
during our audit of the financial statements as a whole and in
forming our opinion thereon. We do not provide a separate opinion
on these matters. For each matter below, our description of how our
audit addressed the matter is provided in that context.
We have fulfilled our responsibilities described in the "Auditor's
responsibilities for the audit of the financial statements" section,
including in relation to the key audit matter below. Accordingly, our
audit included the design and performance of procedures to respond
to our assessment of the risks of material misstatement of the
financial statements. The results of our audit procedures, including
the procedures performed to address the matter below, provide the
basis for our audit opinion on the financial statements.
Recognition of revenue from time charter and
transportation and installation activities
As discussed in note 3 to the consolidated financial statements, the
Company recognized EUR 490 million in revenue from time charter
and transportation and installation activities for the year ended
31 December 2025. Evaluating the criteria for recognizing revenue
from contracts required management judgment in identifying
performance obligations.
Auditing the Company’s revenue from time charter and
transportation and installation activities is a key audit matter due to
the complexity and efforts in determining whether the contracts
contain one or more performance obligations.
How we addressed the matter in our audit
We obtained an understanding, evaluated the design and tested the
operating effectiveness of the Company's internal controls over the
revenue recognition process, including management’s review
controls over the contracts and related determination of the
performance obligations.
Our audit procedures included, among others, inspection of
customer contracts to understand the contracts. For a sample of
customer agreements, we obtained and inspected the contract
source documents and evaluated the Company’s identification of
distinct performance obligations and measurement methods against
the principles in IFRS 15 Revenue from Contracts with Customers and
IFRS 16 Leases.
We also evaluated the adequacy of the Company’s disclosures
included in Note 3 to the consolidated financial statements.
237
Independent Auditor's Reports
Continued from previous page
Statement on the Management's review
Management is responsible for the Management's review.
Our opinion on the financial statements does not cover the
Management's review, and we do not as part of our audit express any
assurance conclusion thereon.
In connection with our audit of the financial statements, our
responsibility is to read the Management's review and, in doing so,
consider whether the Management's review is materially inconsistent
with the financial statements, or our knowledge obtained during the
audit, or otherwise appears to be materially misstated.
Moreover, it is our responsibility to consider whether the
Management's review provides the information required by relevant
law and regulations. This does not include the requirements in
paragraph 99a related to the sustainability statement covered by the
separate auditor’s limited assurance report hereon.
Based on our procedures, we conclude that the Management's
review is in accordance with the financial statements and has been
prepared in accordance with the requirements of relevant law and
regulations. We did not identify any material misstatement of the
Management's review.
Management's responsibilities for the financial
statements
Management is responsible for the preparation of consolidated
financial statements that give a true and fair view in accordance with
IFRS Accounting Standards as adopted by the EU and additional
requirements of the Danish Financial Statements Act and for the
preparation of parent company financial statements that give a true
and fair view in accordance with the Danish Financial Statements Act.
Moreover, Management is responsible for such internal control as
Management determines is necessary to enable the preparation of
financial statements that are free from material misstatement,
whether due to fraud or error.
In preparing the financial statements, Management is responsible for
assessing the Group's and the Parent Company's ability to continue
as a going concern, disclosing, as applicable, matters related to going
concern and using the going concern basis of accounting in
preparing the financial statements unless Management either intends
to liquidate the Group or the Parent Company or to cease operations,
or has no realistic alternative but to do so.
Auditor's responsibilities for the audit of the financial
statements
Our objectives are to obtain reasonable assurance as to whether the
financial statements as a whole are free from material misstatement,
whether due to fraud or error, and to issue an auditor's report that
includes our opinion. Reasonable assurance is a high level of
assurance, but is not a guarantee that an audit conducted in
accordance with ISAs and additional requirements applicable in
Denmark will always detect a material misstatement when it exists.
Misstatements can arise from fraud or error and are considered
material if, individually or in the aggregate, they could reasonably be
expected to influence the economic decisions of users taken on the
basis of the financial statements.
238
Independent Auditor's Reports
Continued from previous page
As part of an audit conducted in accordance with ISAs and additional
requirements applicable in Denmark, we exercise professional
judgement and maintain professional scepticism throughout the
audit. We also:
•Identify and assess the risks of material misstatement of the
financial statements, whether due to fraud or error, design
and perform audit procedures responsive to those risks and
obtain audit evidence that is sufficient and appropriate to
provide a basis for our opinion. The risk of not detecting a
material misstatement resulting from fraud is higher than
for one resulting from error, as fraud may involve collusion,
forgery, intentional omissions, misrepresentations or the
override of internal control.
•Obtain an understanding of internal control relevant to the
audit in order to design audit procedures that are
appropriate in the circumstances, but not for the purpose of
expressing an opinion on the effectiveness of the Group's
and the Parent Company's internal control.
•Evaluate the appropriateness of accounting policies used
and the reasonableness of accounting estimates and related
disclosures made by Management.
•Conclude on the appropriateness of Management's use of
the going concern basis of accounting in preparing the
financial statements and, based on the audit evidence
obtained, whether a material uncertainty exists related to
events or conditions that may cast significant doubt on the
Group's and the Parent Company's ability to continue as a
going concern. If we conclude that a material uncertainty
exists, we are required to draw attention in our auditor's
report to the related disclosures in the financial statements
or, if such disclosures are inadequate, to modify our
opinion. Our conclusions are based on the audit evidence
obtained up to the date of our auditor's report. However,
future events or conditions may cause the Group and the
Parent Company to cease to continue as a going concern.
•Evaluate the overall presentation, structure and contents of
the financial statements, including the note disclosures, and
whether the financial statements represent the underlying
transactions and events in a manner that gives a true and
fair view.
•Plan and perform the group audit to obtain sufficient
appropriate audit evidence regarding the financial
information of the entities or business units within the
group as a basis for forming an opinion on the group
financial statements and the parent company financial
statements. We are responsible for the direction,
supervision and review of the audit work performed for
purposes of the group audit. We remain solely responsible
for our audit opinion.
We communicate with those charged with governance regarding,
among other matters, the planned scope and timing of the audit and
significant audit findings, including any significant deficiencies in
internal control that we identify during our audit.
We also provide those charged with governance with a statement
that we have complied with relevant ethical requirements regarding
independence, and to communicate with them all relationships and
other matters that may reasonably be thought to bear on our
independence, and where applicable, actions taken to eliminate
threats or safeguards applied.
From the matters communicated with those charged with
governance, we determine those matters that were of most
significance in the audit of the consolidated financial statements and
the parent company financial statements of the current period and
are therefore the key audit matters. We describe these matters in our
auditor's report unless law or regulation precludes public disclosure
about the matter.
239
Independent Auditor's Reports
Continued from previous page
Report on compliance with the ESEF Regulation
As part of our audit of the Consolidated Financial Statements and
Parent Company Financial Statements of Cadeler A/S, we performed
procedures to express an opinion on whether the annual report of
Cadeler A/S for the financial year 1 January – 31 December 2025 with
the file name cadeler-2025-12-31-en.zip is prepared, in all material
respects, in compliance with the Commission Delegated Regulation
(EU) 2019/815 on the European Single Electronic Format (ESEF
Regulation) which includes requirements related to the preparation of
the annual report in XHTML format and iXBRL tagging of the
Consolidated Financial Statements including notes.
Management is responsible for preparing an annual report that
complies with the ESEF Regulation. This responsibility includes:
•The preparing of the annual report in XHTML format;
•The selection and application of appropriate iXBRL tags,
including extensions to the ESEF taxonomy and the
anchoring thereof to elements in the taxonomy, for all
financial information required to be tagged using
judgement where necessary;
•Ensuring consistency between iXBRL tagged data and the
Consolidated Financial Statements presented in human
readable format; and
•For such internal control as Management determines
necessary to enable the preparation of an annual report
that is compliant with the ESEF Regulation.
Our responsibility is to obtain reasonable assurance on whether the
annual report is prepared, in all material respects, in compliance with
the ESEF Regulation based on the evidence we have obtained, and to
issue a report that includes our opinion. The nature, timing and
extent of procedures selected depend on the auditor’s judgement,
including the assessment of the risks of material departures from the
requirements set out in the ESEF Regulation, whether due to fraud or
error. The procedures include:
•Testing whether the annual report is prepared in XHTML
format;
•Obtaining an understanding of the company’s iXBRL
tagging process and of internal control over the tagging
process;
•Evaluating the completeness of the iXBRL tagging of the
Consolidated Financial Statements including notes;
•Evaluating the appropriateness of the company’s use of
iXBRL elements selected from the ESEF taxonomy and the
creation of extension elements where no suitable element in
the ESEF taxonomy has been identified;
•Evaluating the use of anchoring of extension elements to
elements in the ESEF taxonomy; and
•Reconciling the iXBRL tagged data with the audited
Consolidated Financial Statements.
240
Independent Auditor's Reports
Continued from previous page
In our opinion, the annual report of Cadeler A/S for the financial year
1 January – 31 December 2025 with the file name cadeler-2025-12-31-
en.zip is prepared, in all material respects, in compliance with the
ESEF Regulation.
Copenhagen, 24 March 2026
EY Godkendt Revisionspartnerselskab
CVR no. 30700228
Mikkel Sthyr State Authorised Public Accountant mne26693 | Christian Schwenn Johansen State Authorised Public Accountant mne33234 |
241
Independent Auditor's Reports
Continued from previous page
Independent auditor’s Limited Assurance Report on
Sustainability Statements
To the shareholders of Cadeler A/S
Limited assurance conclusion
We have conducted a limited assurance engagement on the
sustainability statement of Cadeler A/S (the group) included in the
Sustainability Statements of the Annual Report (the sustainability
statement), page 38 – 136, for the financial year 1 January –
31 December 2025 including disclosures incorporated by reference
listed on page 40-42.
Based on the procedures we have performed and the evidence we
have obtained, nothing has come to our attention that causes us to
believe that the sustainability statement is not prepared, in all
material respects, in accordance with the Danish Financial Statements
Act section 99 a, including:
•compliance with the European Sustainability Reporting
Standards (ESRS), including that the process carried out by
the management to identify the information reported in the
sustainability statement (the process) is in accordance with
the description set out in chapter General information, in
the section Double Materiality assessment, pages 54-66;
and
•compliance of the disclosures in chapter EU Taxonomy
within the environmental section, pages 85-93 of the
sustainability statement with Article 8 of EU Regulation
2020/852 (the Taxonomy Regulation).
Basis for conclusion
We conducted our limited assurance engagement in accordance with
International Standard on Assurance Engagements (ISAE) 3000
(Revised), Assurance engagements other than audits or reviews of
historical financial information (ISAE 3000 (Revised)) and the
additional requirements applicable in Denmark.
The procedures in a limited assurance engagement vary in nature
and timing from, and are less in extent than for, a reasonable
assurance engagement. Consequently, the level of assurance
obtained in a limited assurance engagement is substantially lower
than the assurance that would have been obtained had a reasonable
assurance engagement been performed.
We believe that the evidence we have obtained is sufficient and
appropriate to provide a basis for our conclusion. Our responsibilities
under this standard are further described in the Auditor's
responsibilities for the assurance engagement section of our report.
Our independence and quality management
We are independent of the group in accordance with the
International Ethics Standards Board for Accountants' International
Code of Ethics for Professional Accountants (IESBA Code) and the
additional ethical requirements applicable in Denmark. We have also
fulfilled our other ethical responsibilities in accordance with these
requirements and the IESBA Code.
EY Godkendt Revisionspartnerselskab applies International Standard
on Quality Management 1, which requires the firm to design,
implement and operate a system of quality management including
policies or procedures regarding compliance with ethical
requirements, professional standards and applicable legal and
regulatory requirements.
242
Independent Auditor's Reports
Continued from previous page
Inherent limitations in preparing the sustainability
statement
In reporting forward-looking information in accordance with ESRS,
management is required to prepare the forward-looking information
on the basis of disclosed assumptions about events that may occur in
the future and possible future actions by the group. Actual outcomes
are likely to be different since anticipated events frequently do not
occur as expected.
Management's responsibilities for the sustainability
statement
Management is responsible for designing and implementing a
process to identify the information reported in the sustainability
statement in accordance with the ESRS and for disclosing this Process
in chapter General Information, in the section Double Materiality
assessment, pages 54-66 of the sustainability statement. This
responsibility includes:
•understanding the context in which the group's activities
and business relationships take place and developing an
understanding of its affected stakeholders;
•the identification of the actual and potential impacts (both
negative and positive) related to sustainability matters, as
well as risks and opportunities that affect, or could
reasonably be expected to affect, the group's financial
position, financial performance, cash flows, access to finance
or cost of capital over the short-, medium-, or long-term;
•the assessment of the materiality of the identified impacts,
risks and opportunities related to sustainability matters by
selecting and applying appropriate thresholds; and
•making assumptions that are reasonable in the
circumstances.
Management is further responsible for the preparation of the
sustainability statement, in accordance with the Danish Financial
Statements Act paragraph 99a, including:
•compliance with the ESRS;
•preparing the disclosures in chapter EU Taxonomy within
the environmental section, pages 85-93 of the sustainability
statement, in compliance with Article 8 of the Taxonomy
Regulation;
•designing, implementing and maintaining such internal
control that management determines is necessary to enable
the preparation of the sustainability statement that is free
from material misstatement, whether due to fraud or error;
and
•the selection and application of appropriate sustainability
reporting methods and making assumptions and estimates
that are reasonable in the circumstances.
243
Independent Auditor's Reports
Continued from previous page
Auditor's responsibilities for the assurance engagement
Our objectives are to plan and perform the assurance engagement to
obtain limited assurance about whether the sustainability statement is
free from material misstatement, whether due to fraud or error, and
to issue a limited assurance report that includes our conclusion.
Misstatements can arise from fraud or error and are considered
material if, individually or in the aggregate, they could reasonably be
expected to influence decisions of users taken on the basis of the
sustainability statement as a whole.
As part of a limited assurance engagement in accordance with ISAE
3000 (Revised) we exercise professional judgement and maintain
professional scepticism throughout the engagement.
Our responsibilities in respect of the process include:
•Obtaining an understanding of the process but not for the
purpose of providing a conclusion on the effectiveness of
the process, including the outcome of the process;
•Considering whether the information identified addresses
the applicable disclosure requirements of the ESRS, and
•Designing and performing procedures to evaluate whether
the process is consistent with the group's description of its
process, as disclosed in chapter General information, in the
section Double Materiality assessment, pages 54-66.
Our other responsibilities in respect of the sustainability statement
include:
•Identifying disclosures where material misstatements are
likely to arise, whether due to fraud or error; and
•Designing and performing procedures responsive to
disclosures in the sustainability statement where material
misstatements are likely to arise. The risk of not detecting a
material misstatement resulting from fraud is higher than
for one resulting from error, as fraud may involve collusion,
forgery, intentional omissions, misrepresentations, or the
override of internal control.
244
Independent Auditor's Reports
Continued from previous page
Summary of the work performed
A limited assurance engagement involves performing procedures to
obtain evidence about the sustainability statement.
The nature, timing and extent of procedures selected depend on
professional judgement, including the identification of disclosures
where material misstatements are likely to arise, whether due to fraud
or error, in the sustainability statement.
In conducting our limited assurance engagement, with respect to the
process, we:
•Obtained an understanding of the process by performing
inquiries to understand the sources of the information used
by management; and reviewing the group's internal
documentation of its process; and
•Evaluated whether the evidence obtained from our
procedures about the Process implemented by the group's
was consistent with the description of the Process set out in
chapter General information, in the section Double
Materiality assessment, pages 54-66.
In conducting our limited assurance engagement, with respect to the
sustainability statement, we:
•Obtained an understanding of the group's reporting
processes relevant to the preparation of its sustainability
statement including the consolidation processes by
obtaining an understanding of the group's control
environment, processes and information systems relevant to
the preparation of the Sustainability Statement but not
evaluating the design of particular control activities,
obtaining evidence about their implementation or testing
their operating effectiveness;
•Evaluated whether material information identified by the
process is included in the sustainability statement;
•Evaluated whether the structure and the presentation of the
sustainability statement are in accordance with the ESRS;
•Performed inquiries of relevant personnel and analytical
procedures on selected information in the sustainability
statement;
•Performed substantive assurance procedures on selected
information in the sustainability statement;
•Evaluated methods, assumptions and data for developing
material estimates and forward-looking information and
how these methods were applied;
•Obtained an understanding of the process to identify the EU
taxonomy economic activities for turnover, CAPEX and
OPEX and the corresponding disclosures in the sustainability
statements;
•Evaluated the presentation and use of EU taxonomy
templates in accordance with relevant requirements;
•Reconciled and ensured consistency between the reported
EU taxonomy economic activities and the items reported in
the primary financial statements including the disclosures
provided in related notes.
Copenhagen, 24 March 2026
EY Godkendt Revisionspartnerselskab
CVR no. 30700228
Mikkel Sthyr State Authorised Public Accountant mne26693 | Christian Schwenn Johansen State Authorised Public Accountant mne33234 |
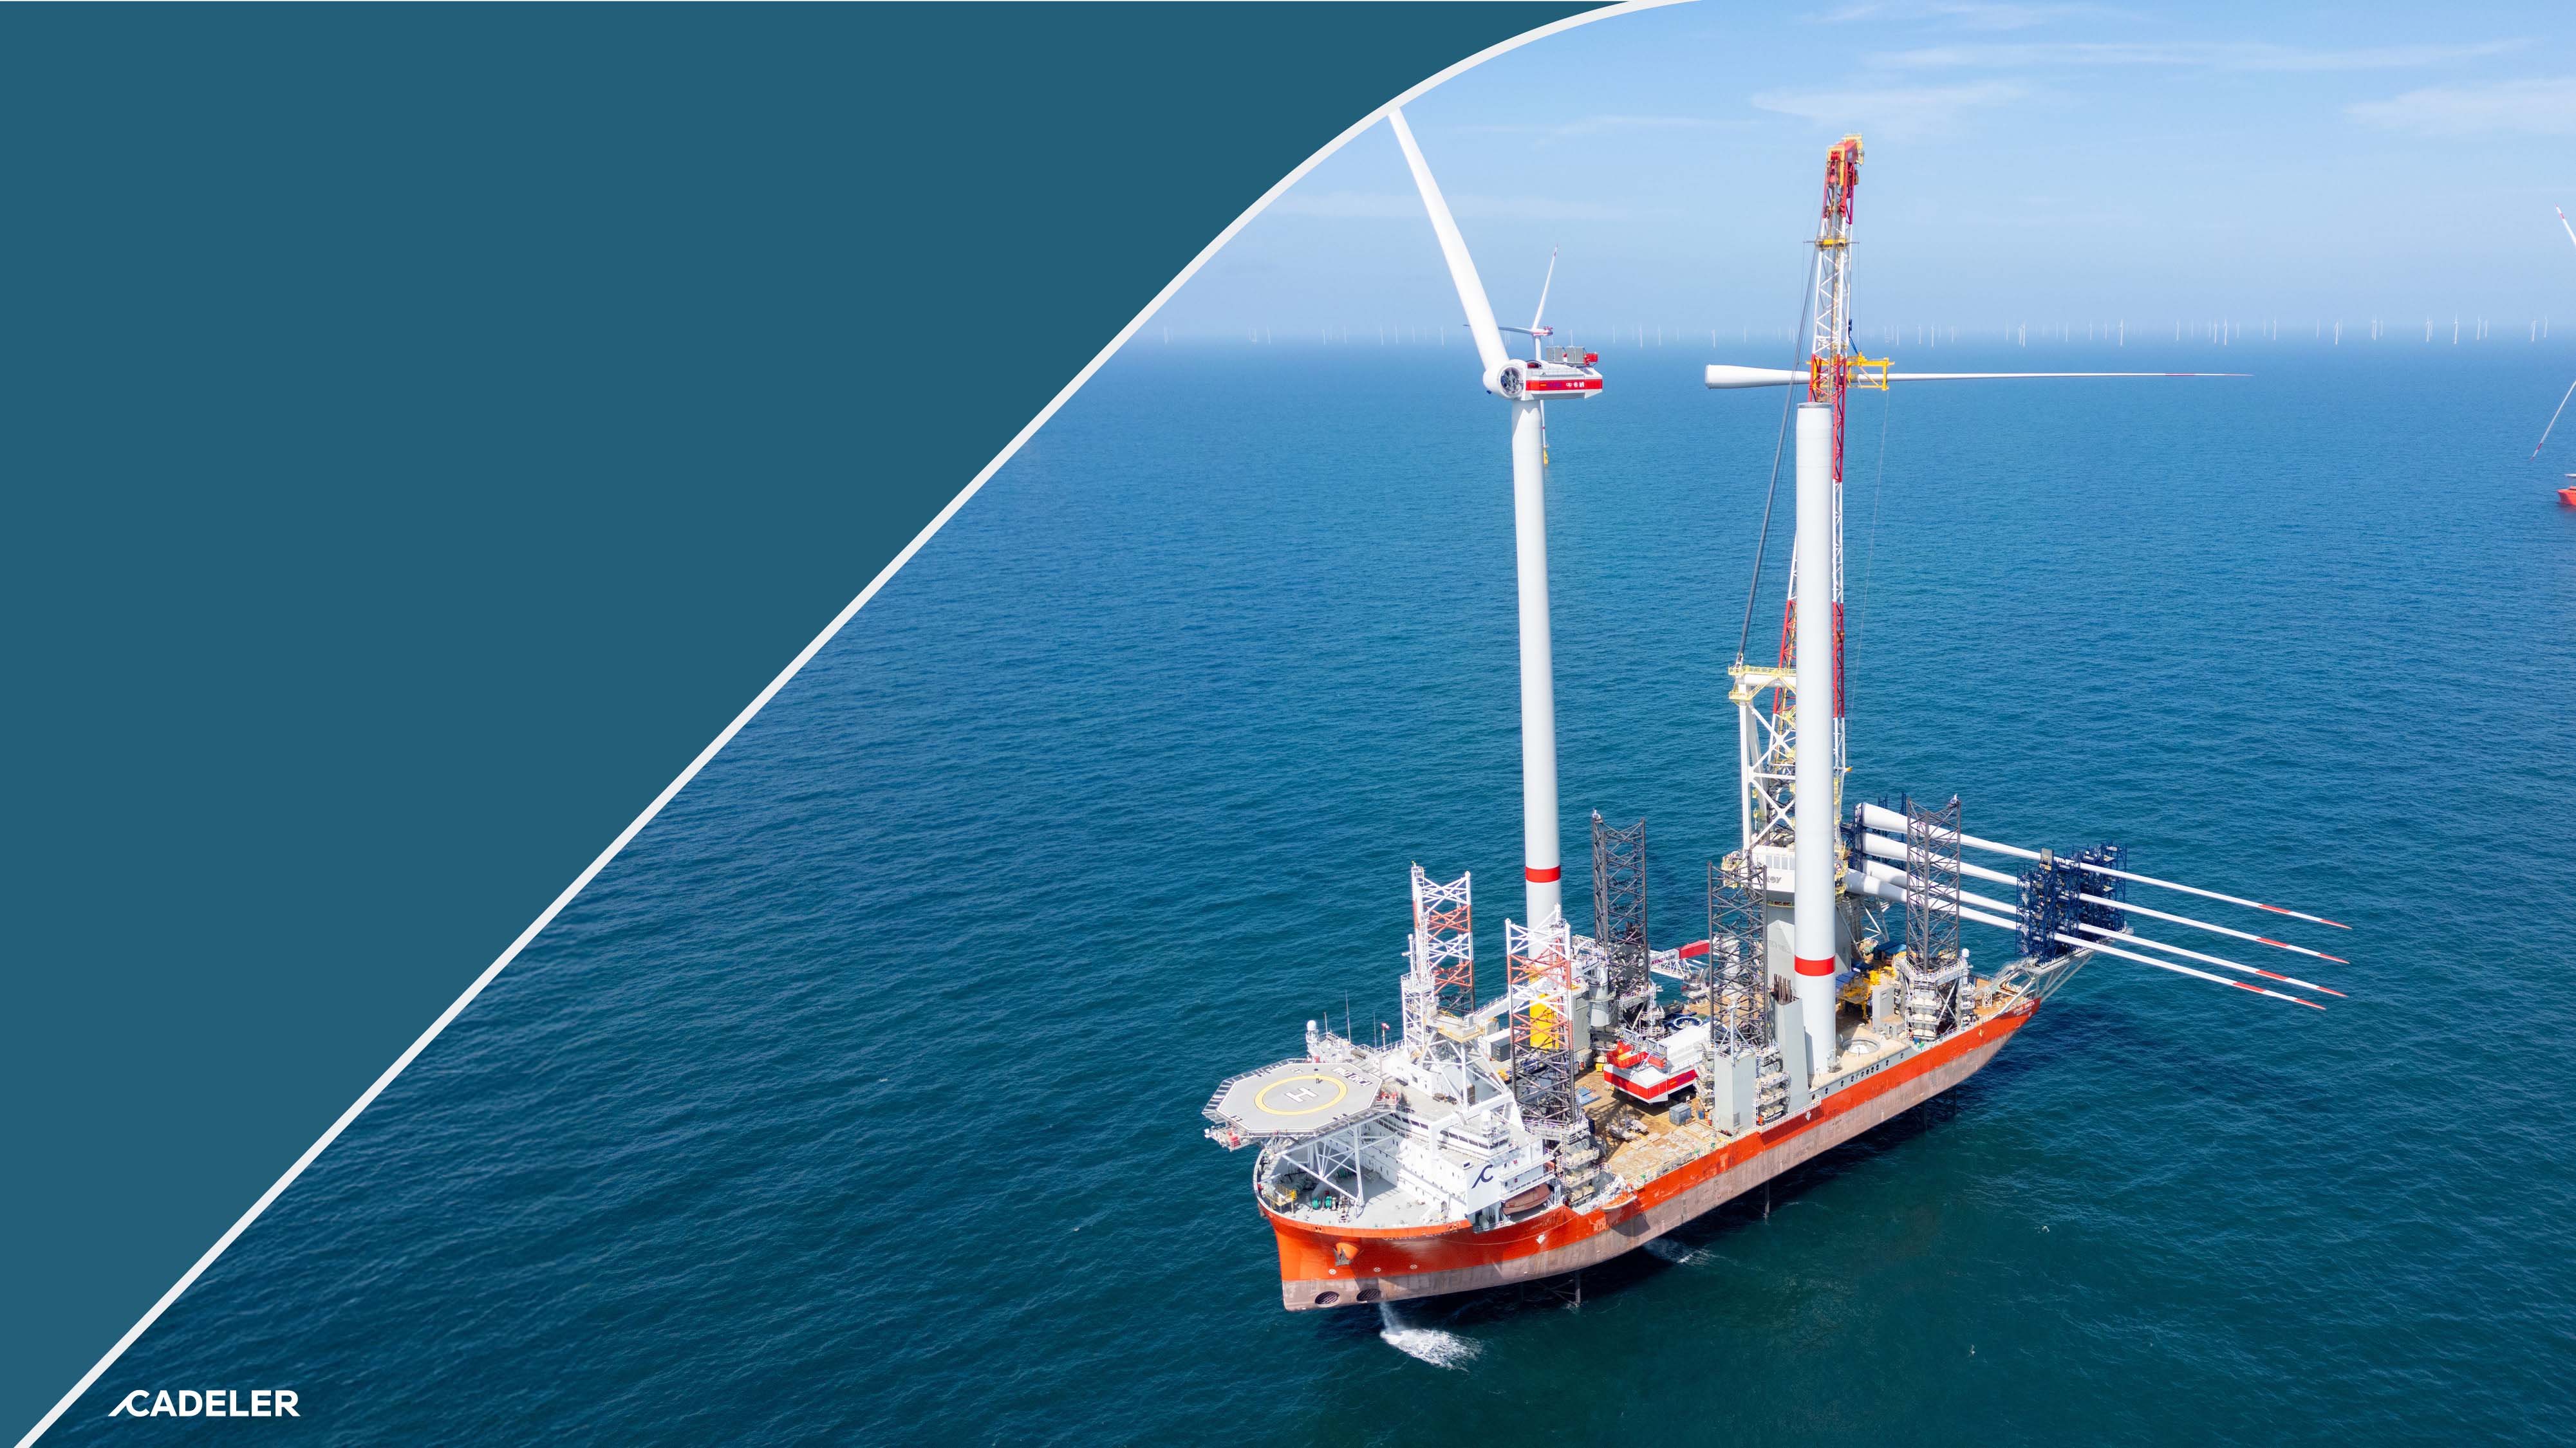
245
Forward-looking
Statements
246
Forward-Looking Statements
The Annual Report contains certain forward-looking statements
relating to the business, financial performance and results of the
Company and/or the industry in which it operates.
Forward-looking statements concern future circumstances and results
and other statements that are not historical facts, sometimes
identified by the words “believes”, expects”, "predicts", "in-tends",
"projects", "plans", "estimates", "aims", "foresees", "anticipates",
"targets", and similar expressions. The forward-looking statements
contained in the Annual Report, including assumptions, opinions and
views of the Company or cited from third party sources are solely
opinions and forecasts which are subject to risks, uncertainties and
other factors that may cause actual events to differ materially from
any anticipated development. Such factors may, for example, include
a change in the price of raw materials.
None of the Company or any of its parent or subsidiaries
undertakings, or any such person's officers or employees, provides
any assurance that the assumptions underlying such forward-looking
statements are free from errors, nor does any of them accept any
responsibility for the future accuracy of the opinions expressed in the
Annual Report or the actual occurrence of the forecast developments.
The Company assumes no obligation, except as required by law, to
update any forward-looking statements or to conform these forward-
looking statements to its actual results.
The Annual Report contains information obtained from third parties.
You are advised that such third-party information has not been
prepared specifically for inclusion in the Annual Report and the
Company has not undertaken any independent investigation to
confirm the accuracy or completeness of such information.
Several other factors could cause the actual results, performance or
achievements of the Company to be materially different from any
future results, performance or achievements that may be ex-pressed
or implied by statements and information in the Annual Report.
Should any risks or uncertainties materialise, or should underlying
assumptions prove incorrect, actual results may vary materially from
those described in the annual report.
No representation or warranty (express or implied) is made as to, and
no reliance should be placed on, any information, including
projections, estimates, targets and opinions, contained herein, and no
liability whatsoever is accepted as to any errors, omissions or
misstatements contained herein. Accordingly, neither the Company
nor any of its subsidiaries or shareholders or any officers, directors,
board members or employees accept any liability whatsoever arising
directly or indirectly from the use of the Annual Report.
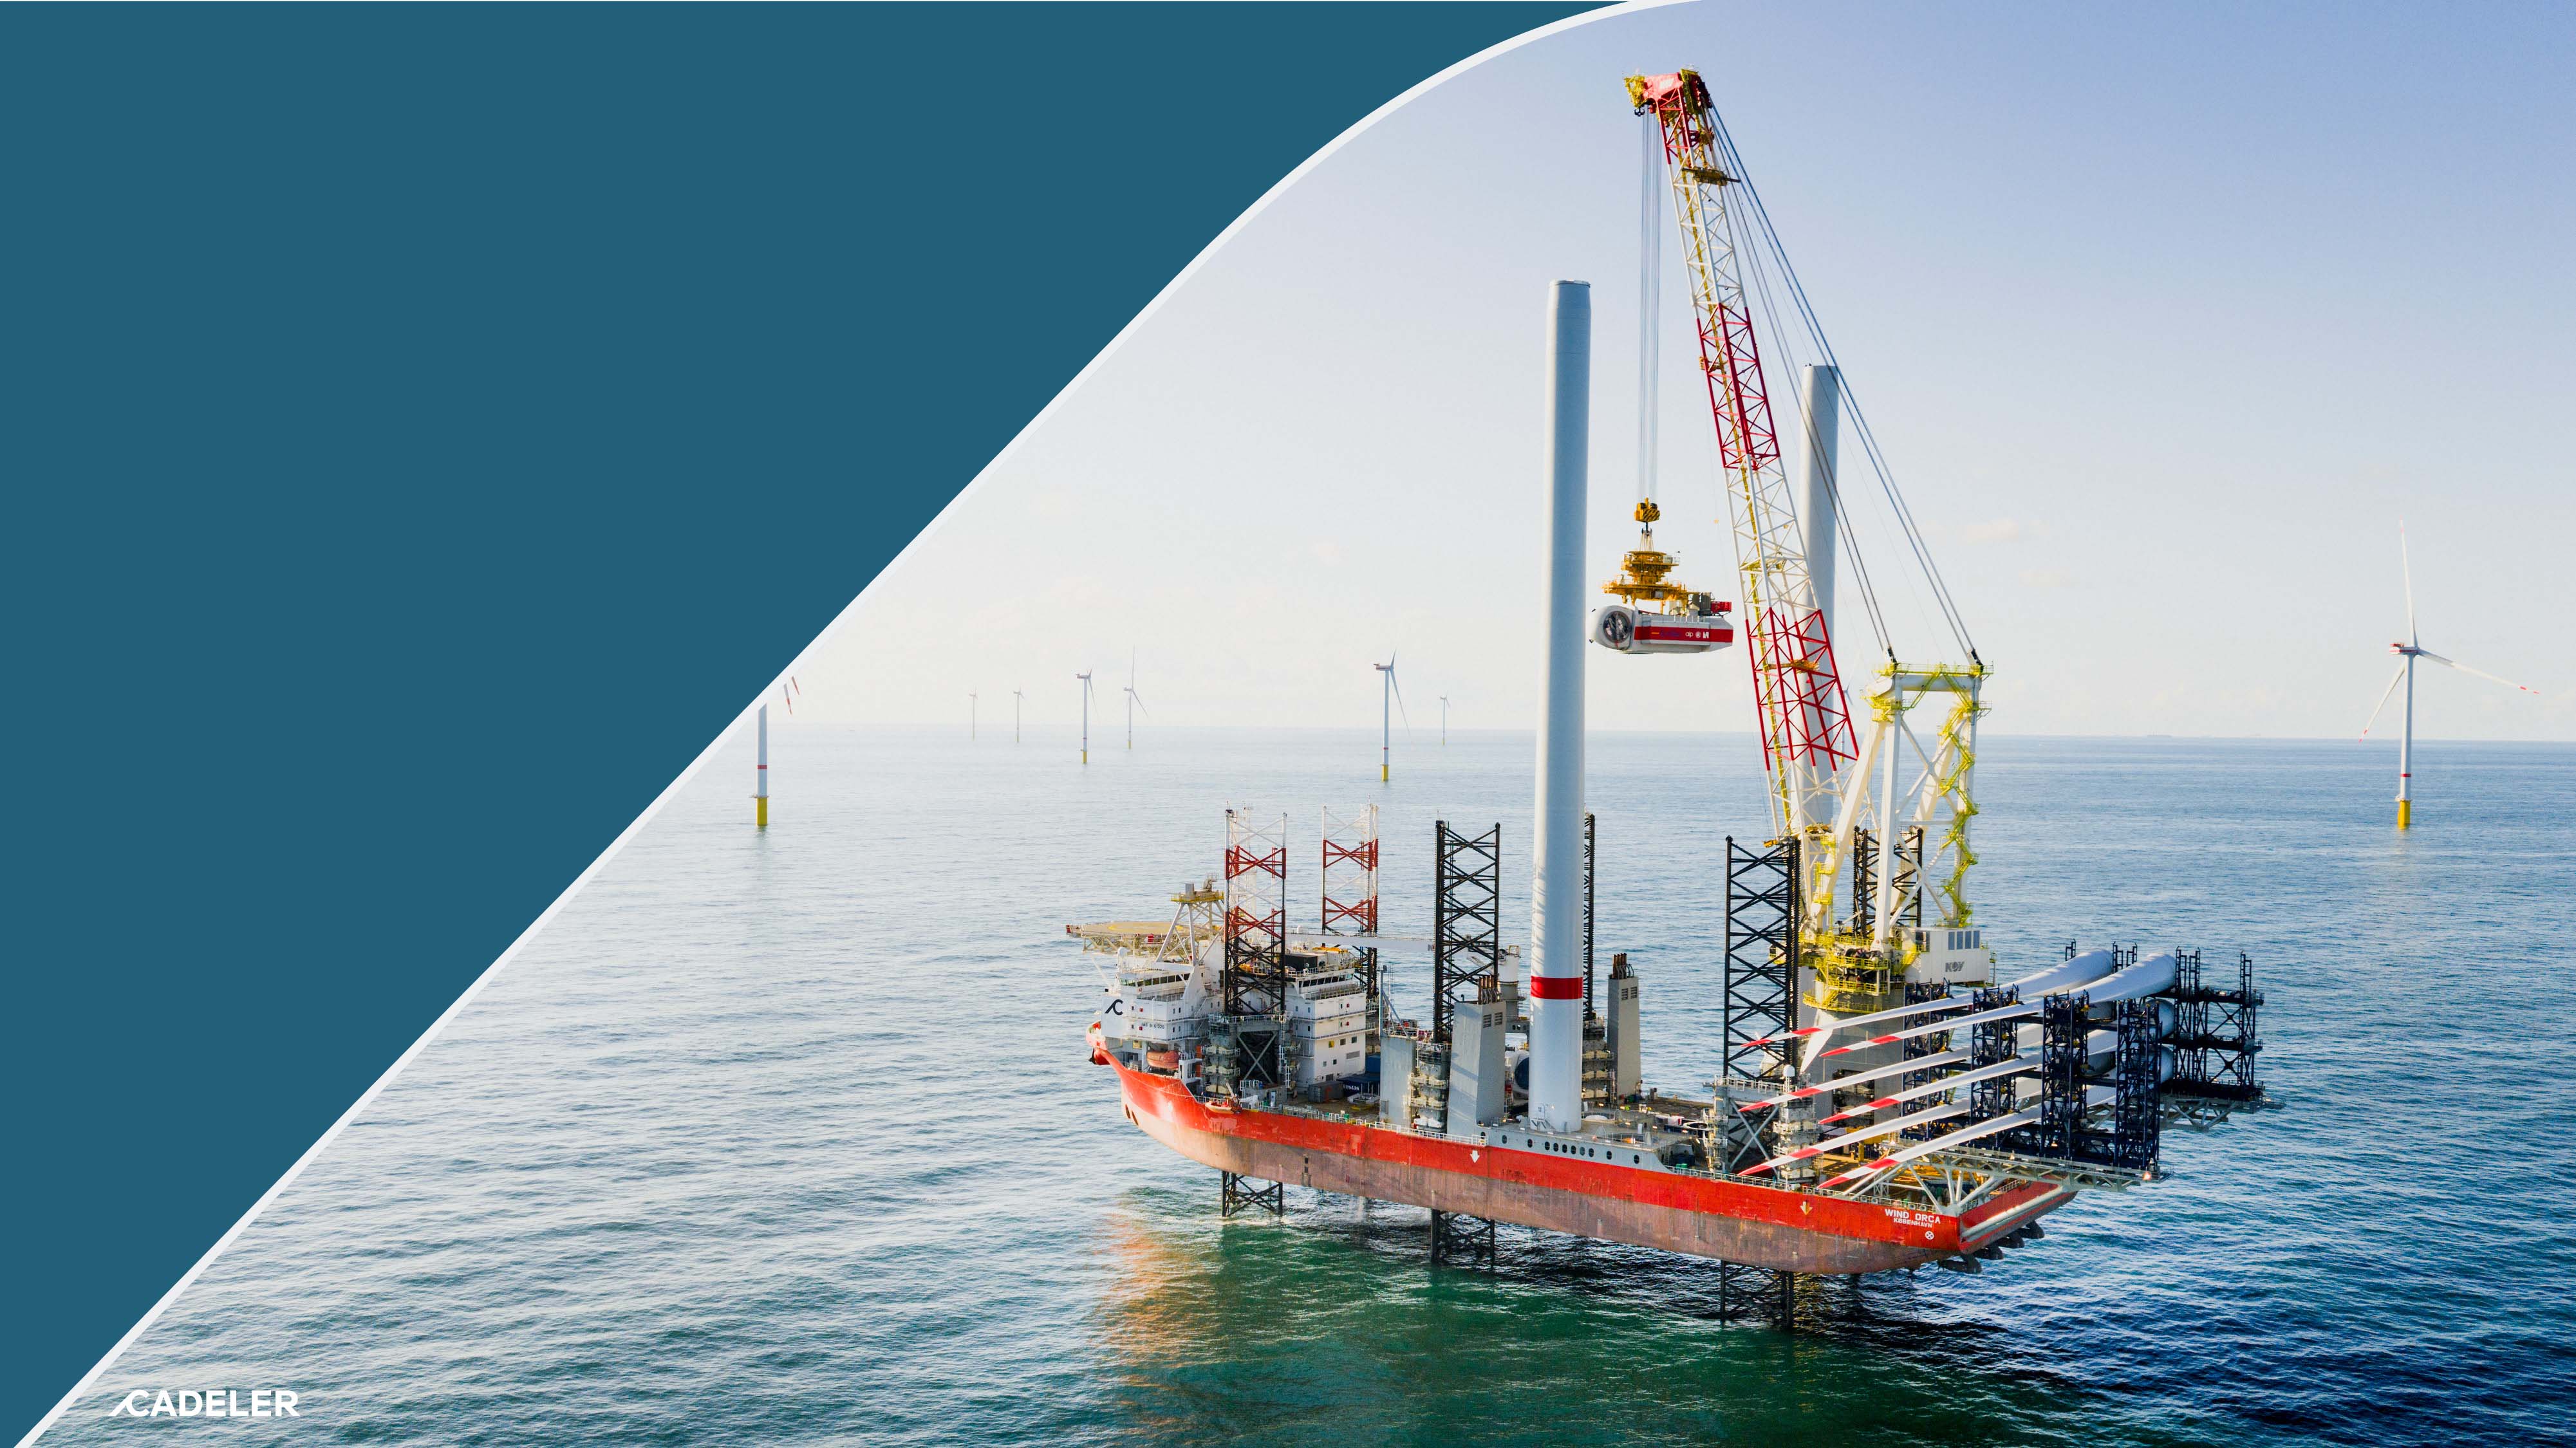
247
Alternative
Performance
Measures
248
Alternative Performance Measures
Group
Non-IFRS Financial Measures
To supplement its financial information presented in accordance with IFRS, the Group uses certain non-IFRS
measures, including EBITDA, when measuring performance, including when measuring current period
results of operations against prior periods. Because of their non-standardised definition, these non-IFRS
measures (unlike IFRS measures) may not be comparable to the calculation of similar measures used by
other companies. These supplementary non-IFRS measures are presented solely to permit investors to more
fully understand how the Group Management assesses underlying performance.
These supplementary non-IFRS measures are not, and should not, be viewed as a substitute for IFRS
measures. Management believes the presentation of these non-IFRS measures provides investors with
greater transparency and supplementary data relating to the Group’s financial condition and results of
operations, and therefore a more complete understanding of factors affecting its business and operating
performance. In addition, Management believes the presentation of these non-IFRS measures is useful to
investors for period-to-period comparison of results as the items may reflect certain unique and/or non-
operating items such as asset sales, write-offs, contract termination costs or items outside of Management’s
control.
As a performance measure, the Company uses EBITDA: Earnings before interest, tax, depreciation,
amortisation and foreign exchange gains/losses.
EBITDA is calculated as shown below:
EUR'000 | Note | 2025 | 2024 | 2023 |
Operating profit as reported in the statement of profit and loss | 317,743 | 69,444 | 14,443 | |
Right-of-use asset amortisation | 14 | 1,861 | 1,544 | 334 |
Depreciation and amortisation | 12 , 13 | 105,730 | 54,909 | 22,714 |
Impairment of property, plant and equipment | — | — | 5,000 | |
EBITDA | 425,334 | 125,897 | 42,491 | |
Transactional costs | — | — | 7,707 | |
Adjusted EBITDA | 425,334 | 125,897 | 50,198 |
The Company defines adjusted EBITDA as EBITDA net of transactional costs. Transactional costs comprise
significant unusual and/or infrequently occurring items that are not attributable to Cadeler’s normal
operations.
As of 31 December 2023, transactional costs include all costs related to the business combination with Eneti
closed on 19 December 2023, such as advisory, legal and consulting fees.
249
Alternative Performance Measures
Continued from previous page
Financial ratios and operational metrics
Return on assets | Profit/loss from operating activities |
Average assets | |
Return on equity | Profit/loss for the year |
Average equity | |
Equity ratio | Equity, year-end |
Total equity and liabilities, year-end | |
Contracted days | Number of on hire days in the fiscal year |
(in total for all vessels) | |
Utilisation | Contracted days |
Days in the year (365*all vessels) |
Contract backlog (As of report release date) | The total value of all customer contracts, both firm and options, that are not yet recognised as revenue as of the reporting date, but includes all new contracts signed until the release date of the annual or interim report. Firm contracts are counted at full committed amounts. Contract backlog including options assumes 100% of counterparty options are exercised with 50% classified as subject to exercise of counterparty options contingent to consideration included in revenue recognition and the remaining 50% as non-contingent. Contract backlog excludes vessel reservation agreements. All contracts may be subject to future modifications, and off-hire days, that might impact the amount and/or timing of revenue recognition. |
Non-financial definitions
Vessel Reservation Agreements (VRAs) | A time-limited agreement with a third party to secure the availability of one or more of Cadeler’s vessels for a fixed period in the future, pending the negotiation of full contractual terms. Cadeler is generally entitled to receive a fee in the event that a VRA is cancelled or permitted to expire without full contractual terms having been entered into with the relevant counterpart. |
Final Investment Decision (FID) | Where a project remains subject to counterparty FID, the relevant counterpart has not yet publicly announced its final decision to commit to the development and operation of the project. |
Net financials | Net of finance income and finance costs |

250
Kalvebod Brygge 43
DK–1560 Copenhagen V
Denmark
+45 3246 3100
www.cadeler.com